Defining the Working Class
Social scientists use 3 common methods to define class—by occupation, income, or education—and there is really no consensus about the “right” way to do it. Michael Zweig, a leading scholar in working-class studies, defines the working class as “people who, when they go to work or when they act as citizens, have comparatively little power or authority. They are the people who do their jobs under more or less close supervision, who have little control over the pace or the content of their work, who aren't the boss of anyone."
Using occupational data as the defining criteria, Zweig estimated that the working class makes up just over 60 percent of the labor force. The second way of defining class is by income, which has the benefit of being available in both political and economic data sets. Yet defining the working class by income raises complications because of the wide variation in the cost of living in the United States. An annual income of $45,000 results in a very different standard of living in New York City than it does in Omaha, Nebraska. Incomes are also volatile, subject to changes in employment status or the number of hours worked in the household, making it easy for the same household to move in and out of standard income bands in any given year.
The third way to define class is by educational attainment, which is the definition used in this paper. Education level has the benefit of being consistently collected in both economic and political data sets, but, more importantly, education level is strongly associated with job quality. The reality is that the economic outcomes of individuals who hold bachelor’s degrees and those who don’t have diverged considerably since the late 1970s. While people with bachelor’s degrees experienced real wage growth in the 30 years between 1980 and 2010, incomes among those with only a high school education or some college declined precipitously. Today having a college degree is essential (but no guarantee, of course) to securing a spot among the professional middle class. As unionized manufacturing jobs got sent overseas, the once-blurred lines between occupation and class grew quite sharp. The blue-collar middle class is an endangered species, shrunk to a size that makes it no longer identifiable in national surveys. The downside of using education to define the working class is that education is not a perfect proxy for establishing the power or autonomy one has in the workplace or society—the traditional definition of class. There are definitely well-educated workers who hold menial jobs or jobs that pay low wages, just as there are less well-educated workers who have jobs with great autonomy or power. It is a blunt definition, but in the aggregate it is a reasonably accurate way to distinguish between the working class and the middle class.
In this brief, “working class” is defined as individuals in the labor force who do not have bachelor’s degrees. This includes high school dropouts, high school graduates, people with some college, and associate’s-degree holders. It includes the unemployed, who are counted as still in the labor force as long as they are actively looking for work. Because it is increasingly difficult, and some would argue nearly impossible, to reach the middle class without a bachelor’s degree, the middle class is defined here as workers with a bachelor’s degree or higher. This both distinguishes the types of work performed by the working class and the middle class, and reflects a major distinction in how these different classes of workers earn their pay. Nearly 6 out of 10 workers in America are paid hourly wages, as opposed to annual salaries. And the majority (8 out of every 10) of these hourly workers do not hold a bachelor’s degree. As a result of the divergence in economic fates experienced by those with and without bachelor’s degrees, today’s middle class is overwhelmingly a professional class, comprising workers who get paid annual salaries, work in an office setting, and most assuredly do not have to ask permission to take a bathroom break.
The Demographics of the Working Class
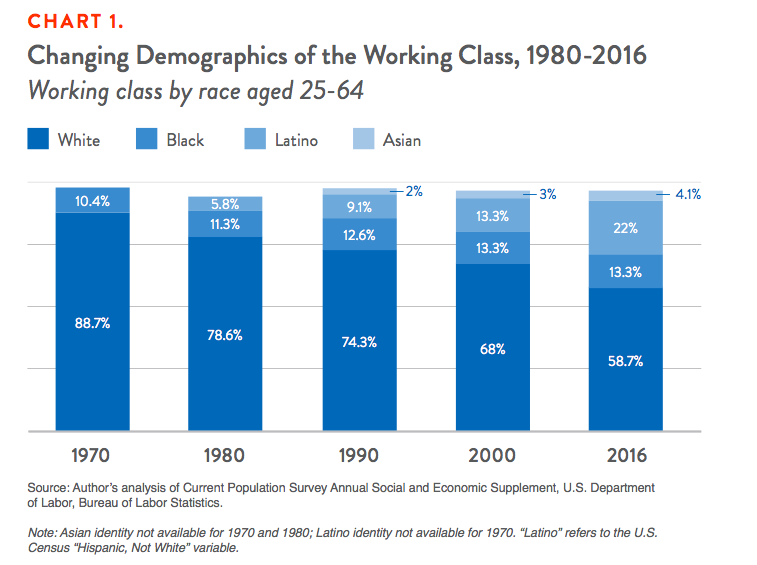
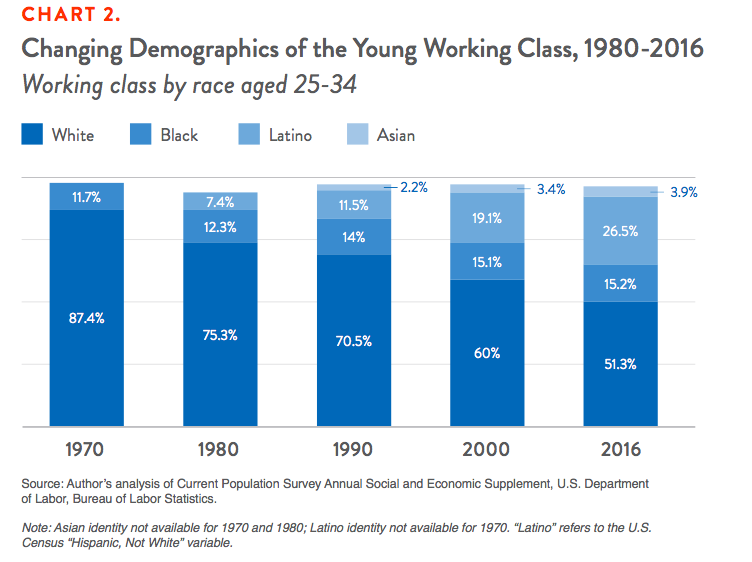
Far too often, the term “working class” is conflated with white and male identities, frequently used as a short-hand to conjure the former archetype of the working class as a white man who works in manufacturing. Of course, the working class has always been more diverse than this stereotype, and that is even more true today (see Chart 1 and Chart 2). As factories shuttered and good jobs for those without college degrees became scarcer, millions more Americans earned bachelor’s and advanced degrees, a process that perversely exacerbated already hardened lines of privilege, with whites earning college degrees at a much greater rate than blacks or Latinos as the cost of college increased substantially over the same time period. As a result, today’s working class is more black and Latino than it was in the industrial era. And it is more female too, as a result of the growing labor force participation of women with children since the 1970s.
As the manufacturing footprint in the working class has shrunk, so has the white male archetype that has historically defined the working class. And as the share of private-sector workers in unions shrank along with those jobs, and working-class jobs became more diffuse and spread across numerous sectors, the idea of a coherent working class has lost its force.
Put simply, the working class shifted from “making stuff” to “serving and caring for people”—a change that carried significant sociological baggage. The long-standing “others” in our society—women and people of color—became a much larger share of the non-college-educated workforce. And their marginalized status in our society carried over into the working class, making it easier to overlook and devalue their work. The racial and gender diversity of today’s working class facilitates its invisibility in two important ways. First, a unifying, single archetype of the new working class remains elusive. Would it be a Latina hotel housekeeper? A black home care worker? A white warehouse worker? An Asian cashier? Definitions want to be neat and tidy, but this working class lacks the defining center of gravity that manufacturing provided the old working class. The second way in which the racial and gender diversity of the new working class undercuts its power is by the very fact that it is so disproportionately black, brown, and female—groups long marginalized in our nation’s political and economic spheres.
- The new working class is more racially diverse than it was decades ago, with more than 41 percent comprising African Americans (13 percent), Latinos (22 percent), and Asian Americans (4 percent). It’s even more diverse if we look at the youngest members of the working class, those aged 25 to 34, with people of color comprising 49 percent of the younger working class.
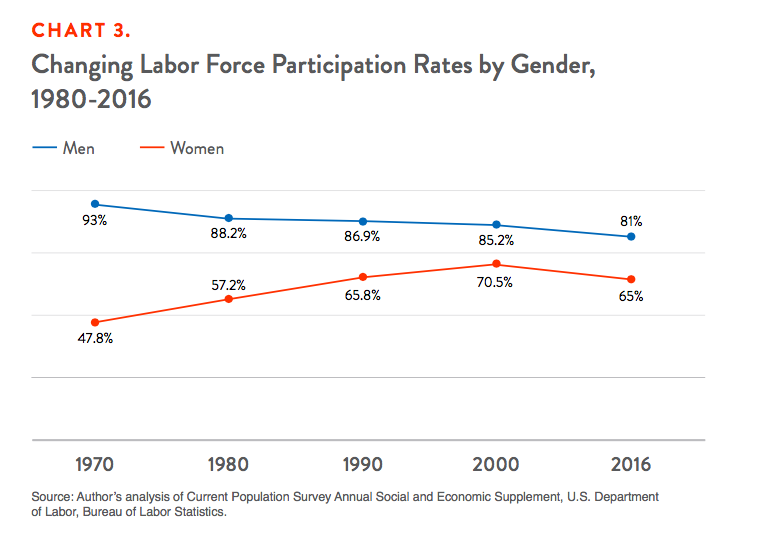
- Today, 2 out of 3 non-college-educated women are in the labor force, up from just over half in 1980 (see Chart 3). Meanwhile, non-college-educated men are in the labor force at a lower rate than they were in 1980, down from 9 out of 10 to 8 out of 10.
As the working class becomes more racially diverse with each passing year, addressing issues of economic insecurity will require addressing how gender and racial inequalities are woven together in the class struggle.
The Jobs of the Working Class
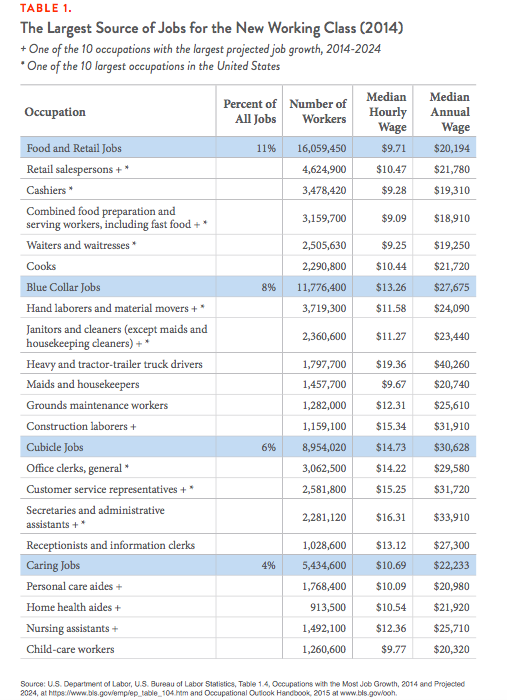
The largest sources of jobs for the new working class fall into 4 main groups: retail and food jobs, blue-collar jobs, cubicle jobs, and caring jobs (see Table 1). Many of these jobs exist at the bottom of a long line of contracts and subcontracts, or are staffed by temp agencies, or are part of a franchise system—all forms of hiring that no longer align with existing labor laws written almost a century ago, making this working class more vulnerable to wage theft, unstable schedules and occupational and safety hazards.
- Only 8 percent of the working class holds jobs in the manufacturing sector, down from about 20 percent in 1980. Today 1 out of 5 working-class employees holds a job in the behemoth retail sector and another 1 out of 5 holds a job in the catchall category of professional and related services, a sector that includes the mushrooming health services occupations. Today’s working-class is centered in the service and caring economy, where robust job growth is expected for the foreseeable future.
- Only 4 out of the 15 occupations that will add the most jobs to our economy in the next decade will require a bachelor’s degree.
- The 5 occupations that employ the largest number of workers include only 1 clear middle-class job requiring a bachelor’s degree: registered nurse. The rest of America’s largest occupations are retail salespeople, cashiers, food service and prep workers, and janitors.
Food and Retail Jobs
Topping the list of the largest source of jobs for the new working class are food and retail positions, employing over 14 million workers. There’s an enduring image of retail and food workers as being high school or college students who cruise through during summers or work after school year-round but then kiss those jobs goodbye once they’ve earned better credentials. But like most stereotypes, this image is far from accurate. Among waiters and waitresses who are aged 25 to 64, a full 8 out of 10 do not have a college degree. Similarly, most retail salespeople don’t have college degrees either: 75 percent. But what about fast-food workers? Aren’t they mostly teenagers? Nothing epitomizes teen jobs more than flipping burgers or working the drive-through for any of the big fast-food companies. Well, it turns out that just 30 percent of fast-food workers are teenagers. Another 30 percent are aged 20 to 24. The rest—40 percent—are 25 or older. And just over one-quarter of fast-food workers are parents who must rely on meager pay and unstable schedules to provide for their children.
The reality of retail workers is also quite different from the stereotype. Over half of retail workers are contributing 50 percent or more to their family’s income. And as in fast food, most of these jobs are held by adults without college degrees—defying the notion of a teen-centered workplace.
The Blue Collar Jobs
In the top-10 list of occupations providing the largest number of jobs in our country, 2 of the 10 (laborers/material movers and janitors) could be described as traditional blue-collar work, that is, physical labor done overwhelmingly by men. But unlike 4 decades ago, these jobs aren’t on the assembly line or factory floor. Today 2 million people in the new working class are employed as janitors or cleaners, earning an average hourly wage of $11.95. Nearly 7 out of 10 of these jobs are held by men. About half of them are held by whites, whereas Latinos make up 30 percent, African Americans 16 percent, and Asian Americans 3 percent of the other half. The other big occupation for working-class men today is what’s known as hand laborers and material movers, employing 3.5 million people. This is classic manual labor: moving freight or stock to and from cargo containers, warehouses, and docks. It also includes sanitation workers, who pick up commercial and residential garbage and recycling. The job requires a lot of strength, because most of the lifting and moving is done by hand, not by a machine.
The Cubicle Jobs
The third largest source of jobs for the working class, coming in at over 7.5 million, breaks into 3 large occupational categories: general office clerks, secretaries and administrative assistants, and customer-service representatives. None of these jobs requires more than a high school diploma, though a fair number of college graduates may find themselves doing this kind of work as a way to get their foot in the door. But by and large, these jobs are held by working-class women. They answer phones, file papers, deal with customer complaints, type memos, make copies, order supplies, and basically keep everything in the office running smoothly. These jobs are found in a wide range of settings, from doctors’ offices to technology companies to local bank branches. In fact, despite the prevalence of ATMs, over a half million people work as bank tellers, with a median pay of $11.99. And like fast-food and retail workers, one-third of bank tellers must rely on public assistance such as food stamps and health insurance programs.
The Caring Jobs
Throughout the first half of the 20th century, it was not uncommon for white middle-class families to employ a woman of color to help clean the house, prepare meals, and care for children or elders. The legacy of this occupational segregation remains today: the majority of these caring jobs are still done by women of color, with a disproportionate share held by black women. Black women make up a full one-third of nursing assistants and home health aides and one-fifth of personal care aides (compared to about 6.5 percent of the population). Latinas make up 14 percent of nursing assistants and home health aides and close to 20 percent of personal care aides (compared to about 8.5 percent of the population). Taken together, close to 5 million people in our economy are employed as home health aides, personal aides, nursing assistants, and child-care workers, all earning around $9 or $10 an hour. The number of home-care industry jobs has more than tripled since the 1970s and will continue to be one of the largest sources of new jobs in the coming decades, as the baby boomers continue to age. Similarly, as the Millennial generation hits its peak child-bearing years, the demand for child-care workers is also expected to grow rapidly.
The Wages of the Working Class
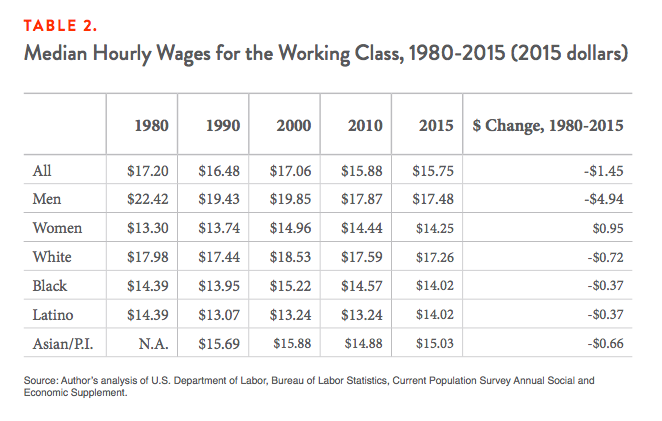
The median hourly wage of today’s working class is $15.75—a full $1.44 less than in 1980, after adjusting for inflation. Today more than one-third of full-time workers earn less than $15 an hour, and fully 47 percent of all workers earn less than $15 an hour. Close to half of workers making less than $15 per hour are over the age of 35. Looking at the working class as an undifferentiated whole hides very important distinctions by gender, race, and age (see Table 2). Like American society more generally, there’s a hierarchy of earnings. Working-class men still out-earn all other demographic groups in the working class, despite a nearly $5 per hour decline in real wages over the past 3 decades. Today the median hourly wage for working-class men is $17.56, down from $22.04 in 1980. The white working class makes significantly more than any other demographic group, thanks in large part to the higher wages of men. As Table 2 shows, hourly wages for most workers have been stagnant over the past 3 decades, with modest increases for women and only significant declines for men.
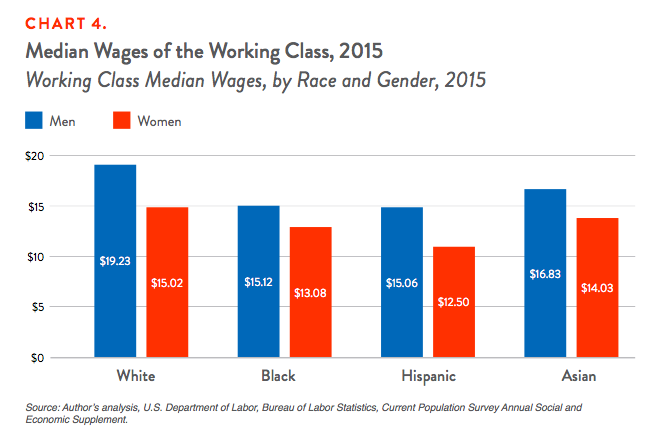
An examination of wage trends by race and gender shows the reality of an enduring white and male wage premium (See Chart 4). In 2015 white working-class men earned $4.11 more per hour than black working-class men and $4.17 more than Latino working-class men. White working-class women earned $1.94 more than black working-class women and $2.52 more than working-class Latinas. Across all races, working-class men earned more than working-class women.
Women and people of color have made great strides in the past 50 years, but there’s no turning away from the reality that our society is still organized along relatively rigid gender and racial hierarchies. As the quality of the new jobs being created in America continues to deteriorate, the inequities by race and gender are further exacerbated.
Nearly twice as many women as men work in jobs paying wages below the poverty line. In fact, 5 of the most common occupations for women—home health aides, cashiers, maids and household cleaners, waitresses, and personal-care aides—fall into that category, compared to just 2 of the most common jobs for men. With the exception of waitresses, these jobs are either primarily or disproportionately done by women of color.
The Politics of the Working Class
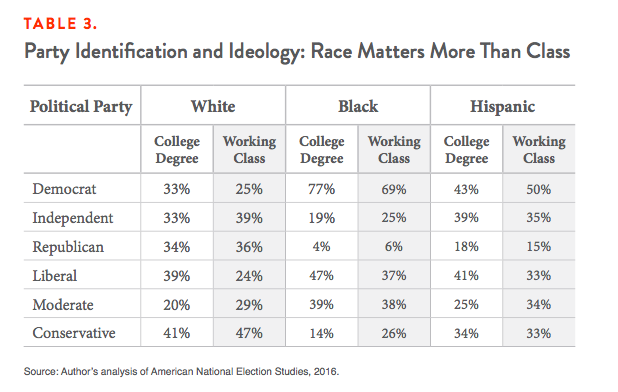
Much has been made of the polarization of American politics, with the conventional split being between Republicans and Democrats. What’s less acknowledged is how much one’s race correlates with being a Republican or a Democrat, a liberal or a conservative. Data from American National Election Studies (ANES), the premier source for public opinion on issues, elections, and political participation, shows substantial differences by race in whether someone considers themselves a Democrat, Republican, or independent—and less significant differences by class. Both blacks and Latinos consider themselves Democrats over Republicans by a very large degree. Working-class blacks are almost 3 times as likely as working-class whites to be Democrats, and working-class Latinos are twice as likely to be Democrats as working-class whites.
Working-Class Political Participation
There is no doubt that the United States has a serious voter turnout problem. Over the past 4 decades, turnout in presidential elections has hovered around 60 percent. In 2016, 61 percent of eligible voters cast a ballot. And among that meager percentage, wealthier and white voters show up in greater numbers than others. In 2016, 48 percent of people with incomes below $30,000 voted, compared to 78 percent of people with incomes above $100,000. And contrary to popular perception, voters with incomes below $30,000 overwhelming cast their ballots for Hillary Clinton over Donald Trump, by 53 percent to 40 percent.
Since 1972, the difference in the policy preferences of voters and nonvoters about government’s role in our society have widened, with voters much more aligned with conservative preferences and nonvoters more aligned with progressive policy preferences. Missing voters, who are more likely to be low-income, are more liberal on questions of redistribution in particular, specifically on the need for government to provide jobs, services, and health care.
Politicians focus their campaigns, and all of their polling, on motivating “likely voters” to cast their vote for them. But structural barriers, including burdensome registration procedures, combined with an enthusiasm gap means that the working class is more likely to be missing from the pool of “likely voters.” And so the agenda is set by an electorate that is more white and more affluent than the nation as a whole. This has profound consequences on the types of issues candidates campaign on and what they prioritize once in office. And those decisions have deep implications about the kind of social contract our elected leaders deem appropriate for our country, generation after generation.
Research on turnout and policy outcomes in other countries corroborates the idea that countries with less class bias in voting and higher turnout have more generous social welfare policies. Researchers examining our nation’s depressed levels of voting came to the conclusion that “low turnout offers a potentially compelling explanation why the American welfare state has been so much less responsive to rising market inequality than other welfare states.” A study of 85 democracies found that higher voter turnout leads to higher total revenues, higher government spending, and more generous welfare state spending.
One could conclude from this research that the recent conservative attacks on voting rights, from requiring photo identification to shortening early voting opportunities, both of which dampen turnout among younger, lower-income, and voters of color, are clearly designed to preserve an ideological hegemony that doesn’t reflect the needs of all the people in our democracy.
Who Calls Themselves Working Class?
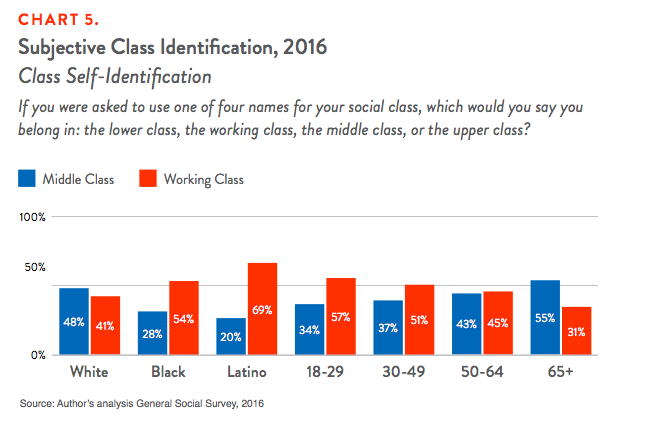
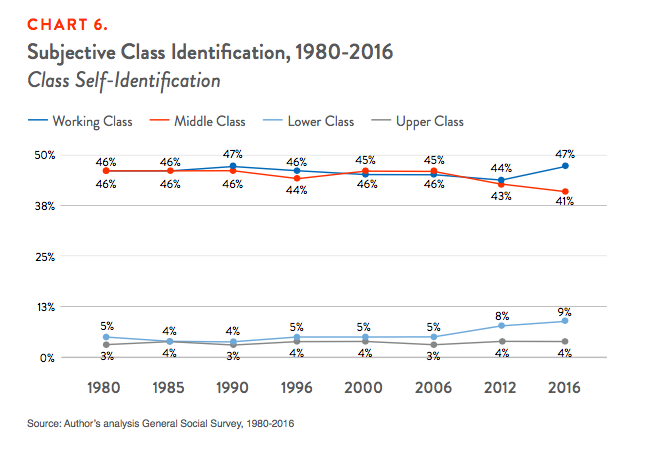
It’s all too common to hear a political pundit say that most Americans identify as middle class. But it isn’t true. Part of the problem is that many polls don’t even include the option of identifying as “working class,” instead offering only upper, middle, and lower class as options. It turns out that when polls offer “working class” as an option, just as many people self-identify as working class as middle class. The General Social Survey, a long-running public opinion survey, found in 2016 that 47 percent of respondents identified themselves as working class, compared to 41 percent who identified themselves as middle class. Interestingly, black and Latino individuals were much more likely than whites to identify as working class (See Chart 5). Seventy percent of Latinos consider themselves working class, compared to 54 percent of blacks and 41 percent of whites. In fact, in every year since the early 1970s, the percentage of Americans who identify as working class has ranged between 44 and 50 percent (See Chart 6).