Key Findings from the June 2020 Primary
- Black and Brown New Mexicans voted absentee at lower rates than white New Mexicans, likely because voting by mail is less accessible to Black and Brown communities, especially Native American voters.
- Black and Brown voters turned out to vote at lower rates, often at dramatically so, than white voters in most counties and state senate districts we examined. Across geographies, Black and Brown voters often represented lower percentages of voters than their share in the population, and, white voters were often overrepresented among voters.
- Threats of white vigilante-led intimidation and violence at the polls, especially targeted at Black and Brown neighborhoods, are on the rise in New Mexico.
- Despite the risks inherent in showing up to vote in person during a global pandemic, Black and Brown New Mexicans will do so, if they are able, in order to make their voices heard.
Democracy and resilience go hand in hand in New Mexico. As a global pandemic has raged through the state, disproportionately impacting the lives of working-class Black and Brown communities, our strength has been tested yet again. In the midst of uncertainty and fear, we have continued to fight for our rights and show solidarity with one another. But we cannot do it alone.
This year marks one of the most consequential elections of many of our lifetimes. While accessing the ballot has never been easy for working-class Black and Brown communities, the disparate impact of COVID-19 along racial lines, and an unwillingness by the courts and state legislature to give the Secretary of State and county clerks the ability to mail ballots without adding extra steps, threaten to silence our voices. This may come as a shock to some, because the official story from the mainstream press has focused on record turnout in the primaries and the success of vote-by-mail and absentee balloting. While it is true that these options provided a safe alternative to in-person voting for many, as our analysis shows, those who were able to vote by mail were overwhelmingly white, while Native, Hispanic, and Black voices were once again marginalized. We can, and must, do better.
What the numbers bear out is a story about differential access in New Mexico, based on race and on class. This is voter suppression. In a time of economic crisis, we are asking people to vote by mail as they are losing their homes, or forcing people to travel miles to post a ballot because they lack a USPS mailing address. Tools like online voter registration, while critical, are meaningless for communities that lack high-speed internet access. Ballot materials only in English and Spanish are insufficient for New Mexicans who speak other languages. Polling locations unevenly distributed throughout counties prevent in-person voting for those without public transportation or sufficient job flexibility to wait in line.
These injustices are familiar to us. They derive from policy choices, inaction, and neglect. However, there is another, darker, undercurrent both in New Mexico and throughout the country, from Oregon to Missouri to New York. That undercurrent is voter intimidation and the threat of violence. In New Mexico, that has taken the form of white supremacist militia groups who infiltrate peaceful protests and who may just as easily show up at the polls this November. These are people who deeply fear the political power of Black and Brown voters and who have quite literally taken up arms to fight against it. There are also bad actors within state government who benefit from low voter turnout. They have tried to put up barriers to making voting easier and more accessible, and they do so at the risk of compromising our elections and forfeiting one of the state’s most sacred responsibilities: to protect New Mexicans and to strengthen democracy.
What militia groups, outgoing lawmakers, and some election officials who seek to restrict access to the ballot are not counting on is the courage, commitment, and resilience of our communities. We are not afraid. We will not be scared off from the polls, we will not stay silent about the threats and intimidation, and we will hold the state accountable this year and every year.
New Mexico’s Silenced Voters
In the analysis that follows, we looked at turnout data for the June 2020 primary to understand how the intersecting barriers of COVID-19 and racist voter suppression schemes are affecting New Mexicans’ ability to participate in our elections and our democracy. Their impact is striking: across nearly every single candidate race and geography we examined, Native American, Hispanic, Black and Asian American New Mexicans had less access to voting in this year’s primary than white New Mexicans.
Method of Voting
First, we looked at the use of absentee ballots among New Mexican voters, as well as rates of in-person voting, by race and ethnicity. The findings suggest what we know to be true across the country: voting by mail is less accessible to Black and Brown voters—and is particularly burdensome and inaccessible to Native American voters. They also suggest that, despite the risks inherent in showing up to vote in person during a global pandemic, Black and Brown New Mexicans will do so, if they are able, in order to make their voices heard.
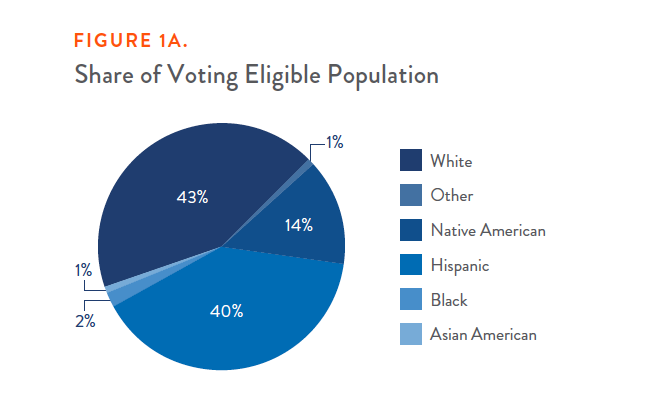
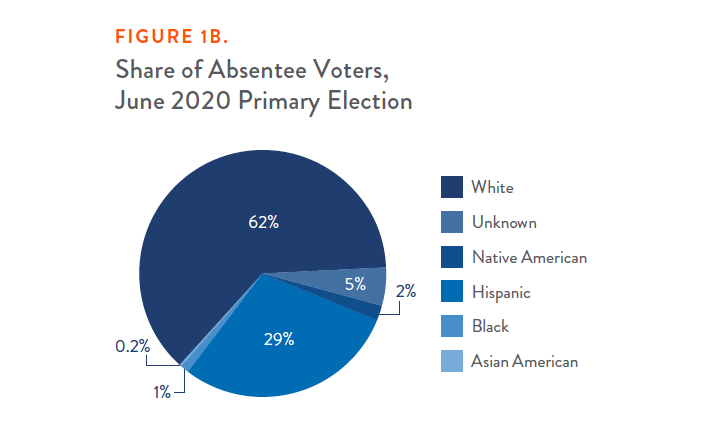
We find that white voters utilized absentee voting at significantly higher rates than Black and Brown voters, and they comprised a share of all absentee voters much larger than their share of the voting eligible population. While white New Mexicans make up 43 percent of the voting eligible population, they accounted for 62 percent of all those who voted absentee during the June primary. Hispanic New Mexicans, who represent 40 percent of the voting eligible population, comprised just 29 percent of absentee voters. Native American New Mexicans, who make up 14 percent of the population, represented a mere 2 percent of voters who cast their ballot absentee.
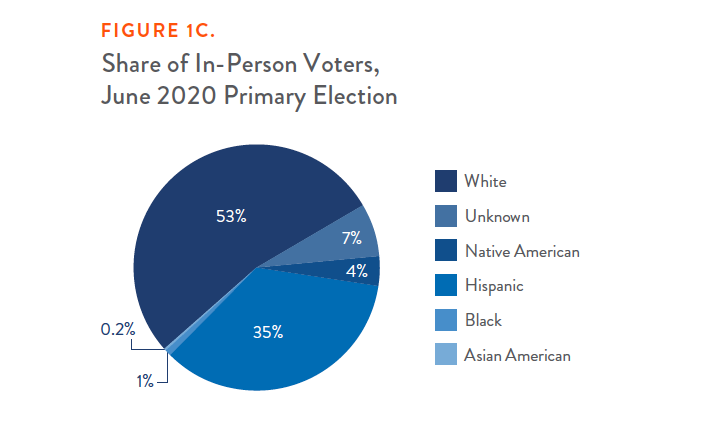
Meanwhile, Hispanic and Native American voters represented a higher share of those who voted in person, on Election Day, than their share of absentee voters. While Hispanic voters were 29 percent of those who cast ballots absentee, they were 35 percent of those who voted in person on Election Day. Native voters were 2 percent of those who voted absentee but 4 percent of those who voted in person on Election Day. Both shares are significantly lower than their representation in the voting eligible population.
County Analysis
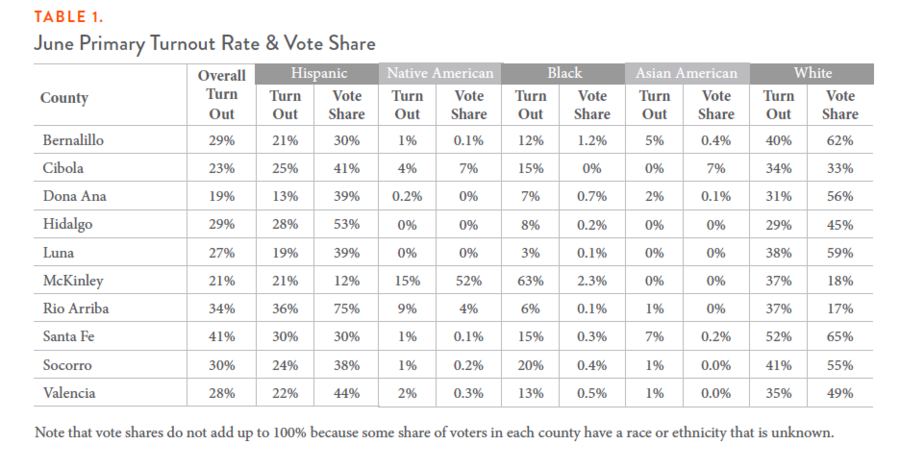
To understand how these trends played out across the state, we looked at 10 counties with significant populations of New Mexicans of color, finding that across nearly every county, turnout among Hispanic voters, Native American voters, Black voters, and Asian American voters was lower than that of white voters, in most cases significantly lower. Clearly, long-standing barriers to the ballot box and civic participation, coupled with the pandemic and new threats erected to keep Black and Brown voters out, are taking a significant toll on New Mexico’s democracy.
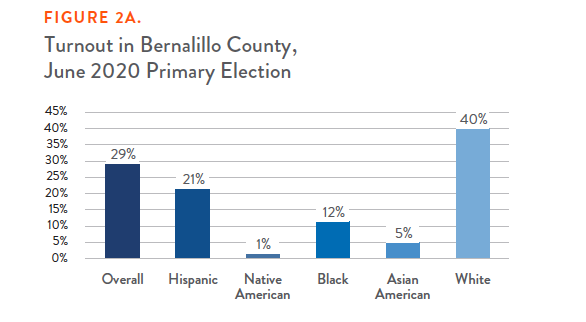
In Bernalillo County, the overall turnout rate of 29 percent masks striking gaps between Black and Brown voters and white voters. Forty percent of non-Hispanic white voters voted in the June primary, a rate twice that of Hispanic voters (21 percent), more than 3 times the rate of Black voters (12 percent), 8 times the rate of Asian American voters (5 percent), and a staggering 40 times the rate of Native American voters, only 1 percent of whom were able to turn out to vote. These turnout rates are significantly disproportionate to each community’s share of the population: Hispanic people are 50 percent of the Bernalillo population but were only 30 percent of voters; non-Hispanic white people make up 38 percent of the Bernalillo population but accounted for 62 percent of the vote share.
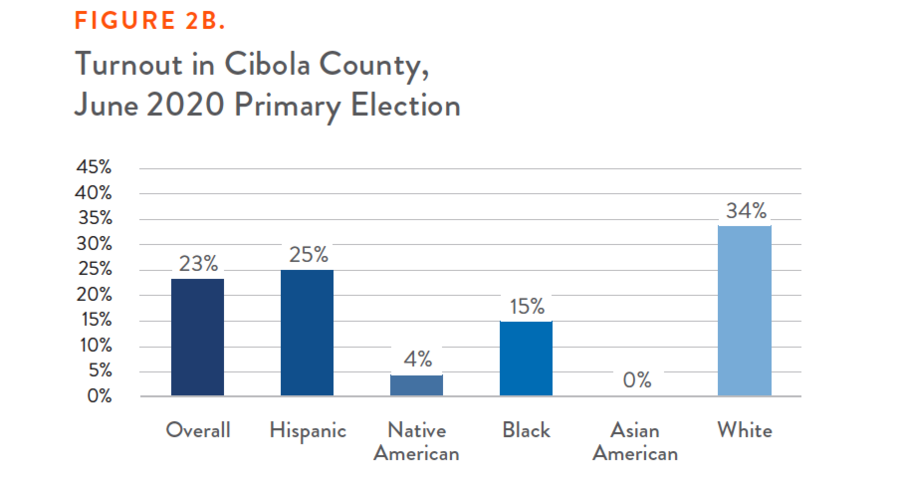
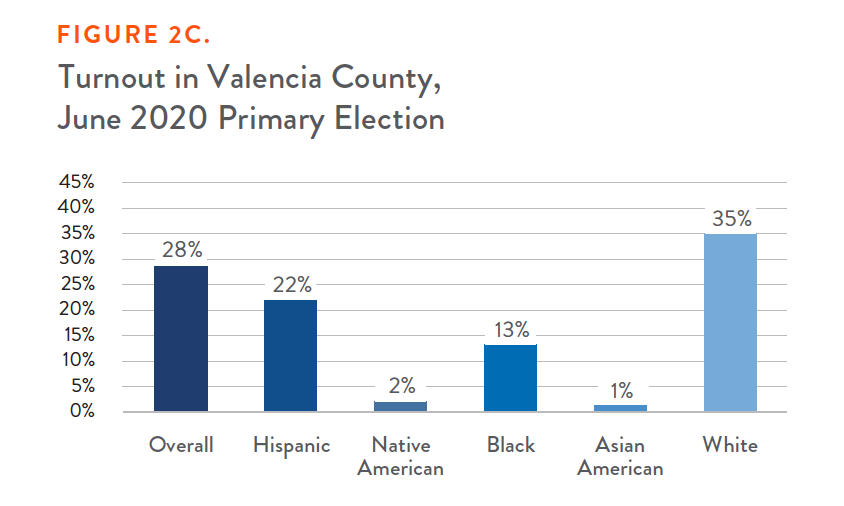
The gaps were somewhat smaller but still significant in neighboring Cibola and Valencia Counties. In Cibola, where non-Hispanic white voters make up only 19 percent of the population, these voters made up 33 percent of the vote share and turned out at a rate 9-34 percentage points higher than Hispanic, Native American, Black, and Asian American voters. While Native Americans represent 44 percent of the population of Cibola, they made up only 7 percent of the vote share. Black and Brown voters in Valencia make up two-thirds of the population but represented just half the vote share and turned out to vote at rates 13-34 percentage points lower than white voters.
State Senate Analysis
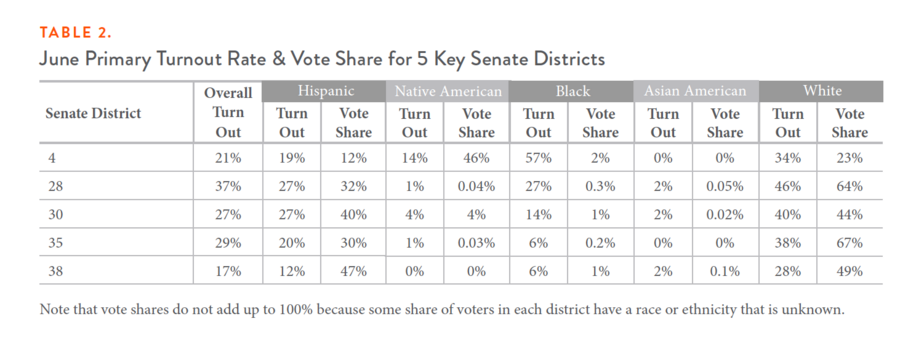
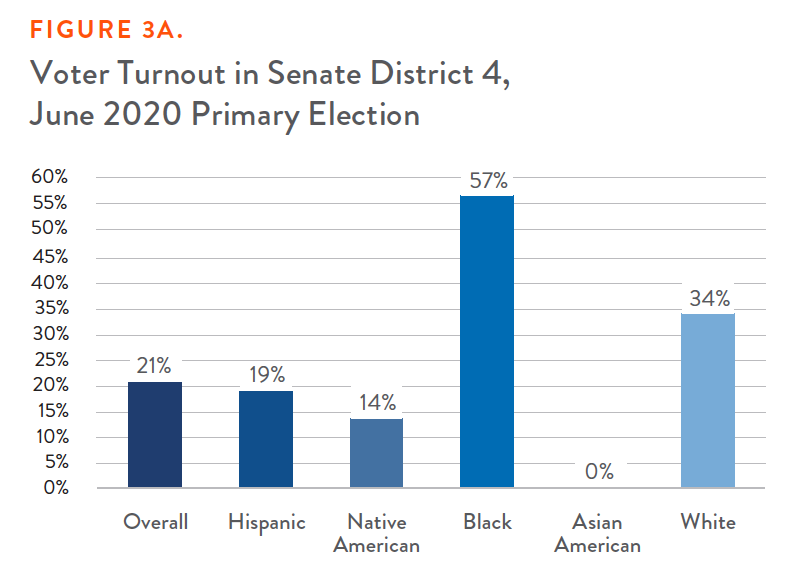
We see similarly troubling gaps in who was able to turn out to vote in 5 key state senate races this June. With one exception in Senate District 4, barriers to civic engagement and the ballot box meant Native Americans, Hispanic, Black, and Asian American voters all turned out to vote at much lower rates than white voters in these critical races. These Black and Brown New Mexicans also represented vote shares well below their share of the population.
In Senate District 4, Native Americans make up 71 percent of the population but accounted for 46 percent of voters, while non-Hispanic whites, who make up just 13 percent of the population, accounted for 23 percent of voters. As Figure 3a illustrates, Native American voters turned out to vote at a rate 20 percentage points lower than white voters were able to in Senate District 4.
In Senate District 28, Hispanic New Mexicans make up 48 percent of the population but accounted for 32 percent of voters, while non-Hispanic whites, who make up 46 percent of the population, accounted for 64 percent of voters. Figure 3b shows that white voters in Senate District 28 were able to turn out to vote at rates 19-45 percentage points higher than Black and Brown voters.
While grassroots organizers engaged in tremendous efforts to connect with and support voters in these key state senate districts, the collective impact of policies that make it harder for Black and Brown people to vote, and intimidation tactics aimed directly at these same communities, mean that racialized turnout gaps persisted.
Building a More Inclusive Democracy in New Mexico
While the story of voting in New Mexico is of course more nuanced than what a single turnout analysis demonstrates, there can be no doubt that our state is failing to enable all communities to access their fundamental right to vote. The kinds of policy solutions that are necessary to bring democracy in New Mexico into balance are far beyond the piecemeal solutions that have been offered by the State Supreme Court, the legislature, and some local elected officials. Some policies, such as mailing only absentee ballot applications, rather than the ballot itself, have the potential to cause more harm and confusion by creating additional burdens for voters at a time when many are struggling just to survive. Yet a truly inclusive democracy is well within reach. The challenges of this brutal year have been considerable, but they have also illuminated inequities and barriers so large that they can no longer be ignored. The elevation of these issues provides a platform for bold reforms, and we are confident New Mexico is ready to meet this moment.
Policy Recommendations
- Automatically mail ballots to every registered voter with a postage-paid return envelope.
- Increase the number and accessibility of ballot drop boxes, including setting criteria for equitable placement that results in more drop boxes in communities that face higher barriers to voting by mail.
- Create ample opportunities for voters to safely vote in person, including increasing the number of in-person polling locations, particularly in Black and Brown communities, and allowing for expanded curbside voting.
- Set statewide, uniform standards for expanded early voting, starting at least 3 weeks before Election Day and running through Election Day.
- Allow voters to designate any person of their choosing, including non-relatives and representatives of community organizations, to pick up their completed mail-in ballot and deliver it to their county or municipal elections office or a nearby ballot drop box.
- Ensure that all mail-in ballots placed in a drop box or postmarked by the time polls close on Election Day and received within 10 days after Election Day are counted.
- Employ translation services that connect limited English-proficient voters to a live translator who can assist them in completing their mail-in ballots and answer questions about voting options and the voting process.
- Ensure limited English-proficient voters and voters with disabilities are allowed to receive help from a person of their choosing as they vote in person or by mail.
- Implement a statewide Election Day holiday.
- Ensure that election-related organizations receive clear guidelines on what they can and cannot do, and make them aware that voter intimidation is a felony.
- Conduct Know Your Rights trainings that are accessible to working-class people and people who do not speak English, and mail Know Your Rights materials in English, Spanish, and languages spoken by New Mexico’s Native communities, as well as other languages, to all registered voters.
- Ensure poll workers are trained in voter rights, and in tactics to prevent intimidation at polling places.
- Issue a ban on evictions, at least through the clear end of the pandemic, so no voter is denied their right to vote because they have lost their permanent address, and so no New Mexicans are made houseless during a global pandemic.
Conclusion
For too long, voting infrastructure has been built around the needs and norms of middle- and upper middle-class white voters, who we can see consistently outstrip all other communities in turnout. Rather than creating law and policy around those who already have the most access, New Mexico must center those with the least access, starting with Native American New Mexicans. The activism of Black and Brown communities proves that depressed voter turnout is not voter apathy, a myth that is too often used to excuse inaction on the part of the state and local governments. We need solutions that address the intersectionality of access to the ballot, which is dependent on everything from housing, to transportation, to workplace flexibility, to childcare, to English, Spanish, and Native language proficiency. Finally, we need the courage to call out and fight back against tactics of violence and intimidation designed to keep people from the polls.
Methodological Notes
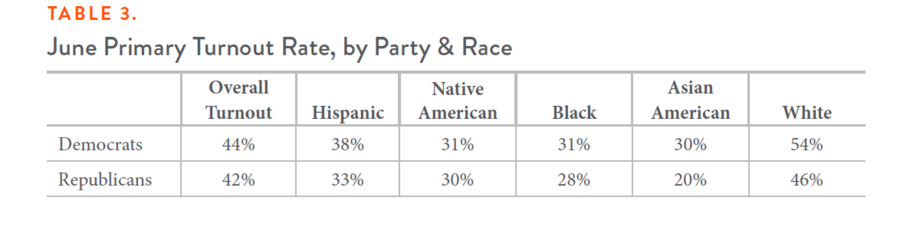
We accessed voting totals by county and state senate district using the New Mexico Voter Activation Network (VAN), which uses models to project race and ethnicity for New Mexican voters. We accessed population data, including race and ethnicity, age, and citizenship status, by county and state senate district using the latest data available from the Census. Our analysis considers all citizens age 18 years or older as a county or state senate district’s eligible population, whether or not they are registered to vote or have a party affiliation. Those who are not registered, or who have registered but declined to affiliate with a political party, are nonetheless important voices in our democracy. When we examine turnout among just those affiliated with a political party, and therefore allowed to vote in the June primary, we see the stark gaps by race and ethnicity persist.
We have not accounted for citizens of voting age who are disenfranchised due to a felony conviction, as we were not able to access these data at the county nor state senate district level, nor could we access precise estimates of disenfranchisement by racial and ethnic group in New Mexico. In 2016, the Sentencing Project estimated 1.53 percent of all New Mexicans were disenfranchised due to a felony conviction. When we calculated turnout for each county, accounting for 1.53 percent of residents being formally disenfranchised, we found the overall turnout rate increased by about 1 percentage point in the jurisdictions we analyzed.