Image
According to census data collected from 2017 to 2021, there are more than 500 different languages spoken in the U.S. and approximately 67 million people who speak a language other than English at home. This linguistic diversity demands policy solutions that enable all Americans—no matter the language they speak—to have a say in who represents them and their communities. Without robust language access in voting, we cannot have a truly inclusive and representative democracy.
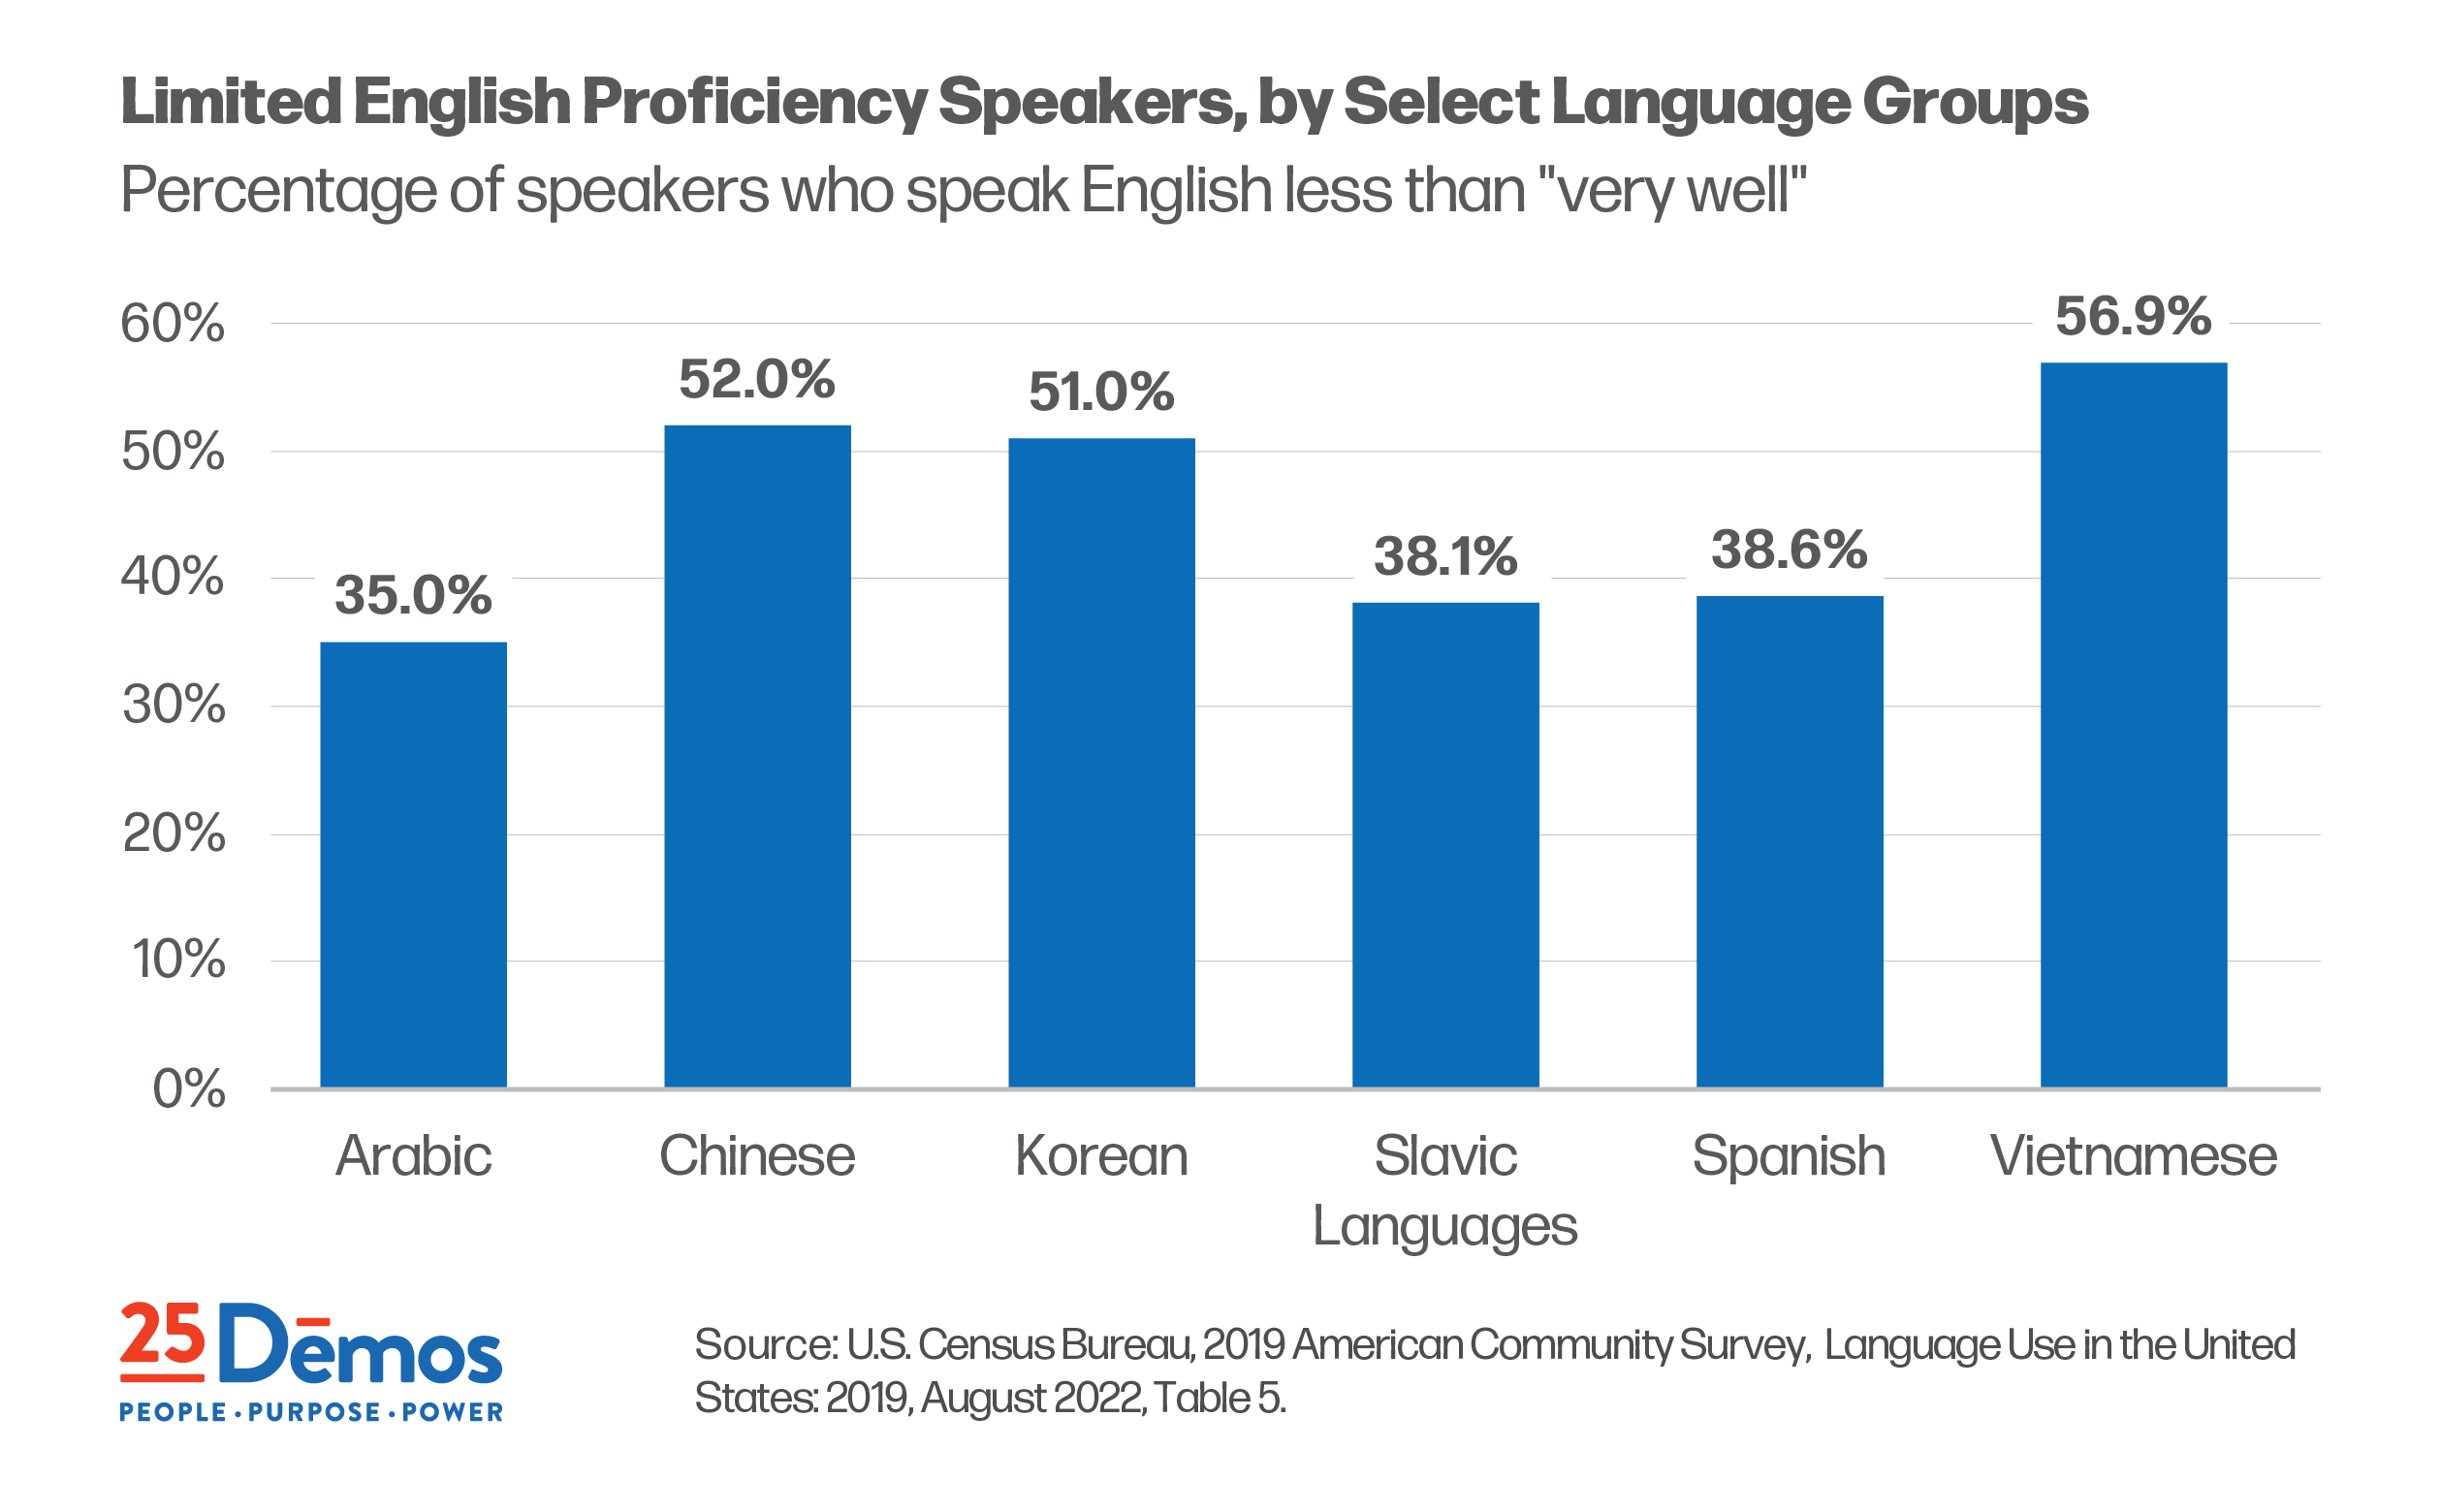
Nearly four out of every ten non-English language speakers are classified as limited English proficient (LEP),1 which is equal to roughly 26 million people, or 7.6% of the U.S. population.
The rates of limited English proficiency are even higher among some of the largest language groups.
While immigration has fueled much of the recent growth in LEP populations, large numbers of LEP individuals in the U.S. are in fact U.S.-born.
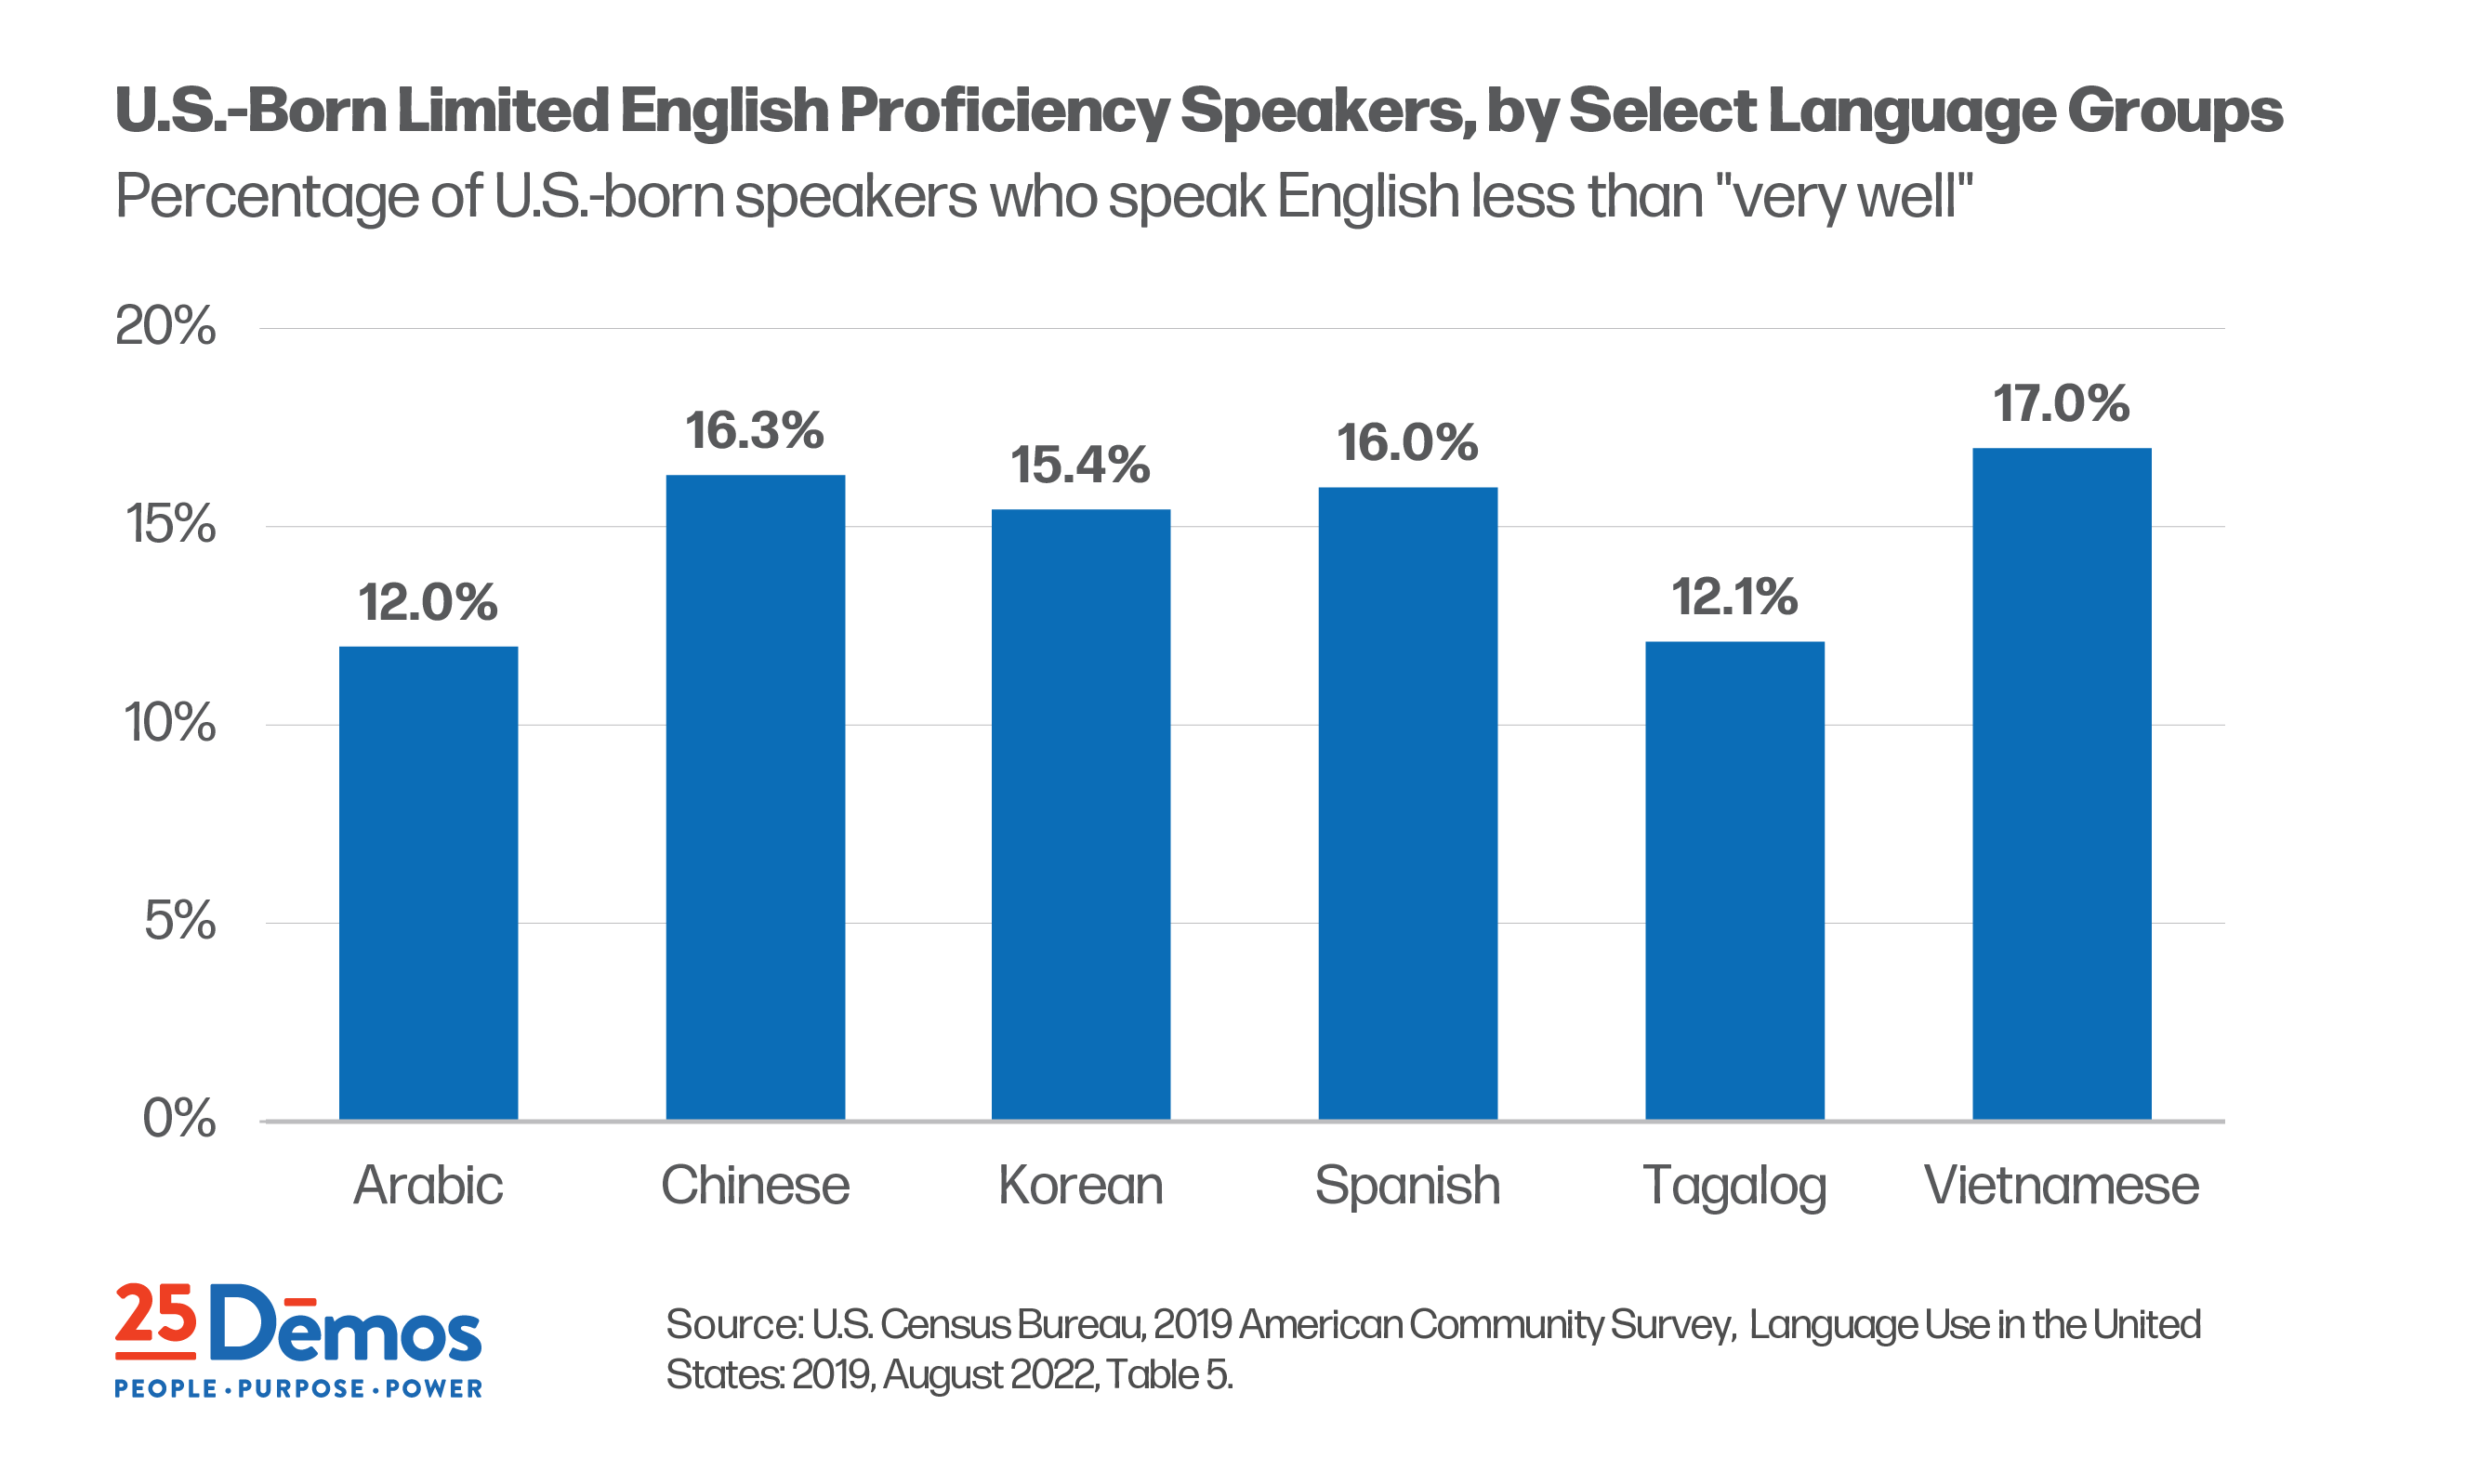
Although there can be many reasons for limited English proficiency—having been educated outside the U.S. in a non-English language is typical—the large numbers of U.S.-born individuals who are also LEP makes clear that deficiencies and inequities in the American educational system are significant factors as well.
LEP individuals can face significant obstacles in gaining fluency in English.
The federal government has recognized that English language acquisition can be especially challenging, particularly for older individuals. For example, federal law creates special exceptions for older immigrants who seek American citizenship through naturalization; if they are age-eligible and have resided in the U.S. for a sufficient number of years, applicants can have their citizenship tests conducted in their native language with the aid of an interpreter.2
Survey research on political behavior suggests that LEP status contributes to gaps in electoral participation, including voter registration and voting.
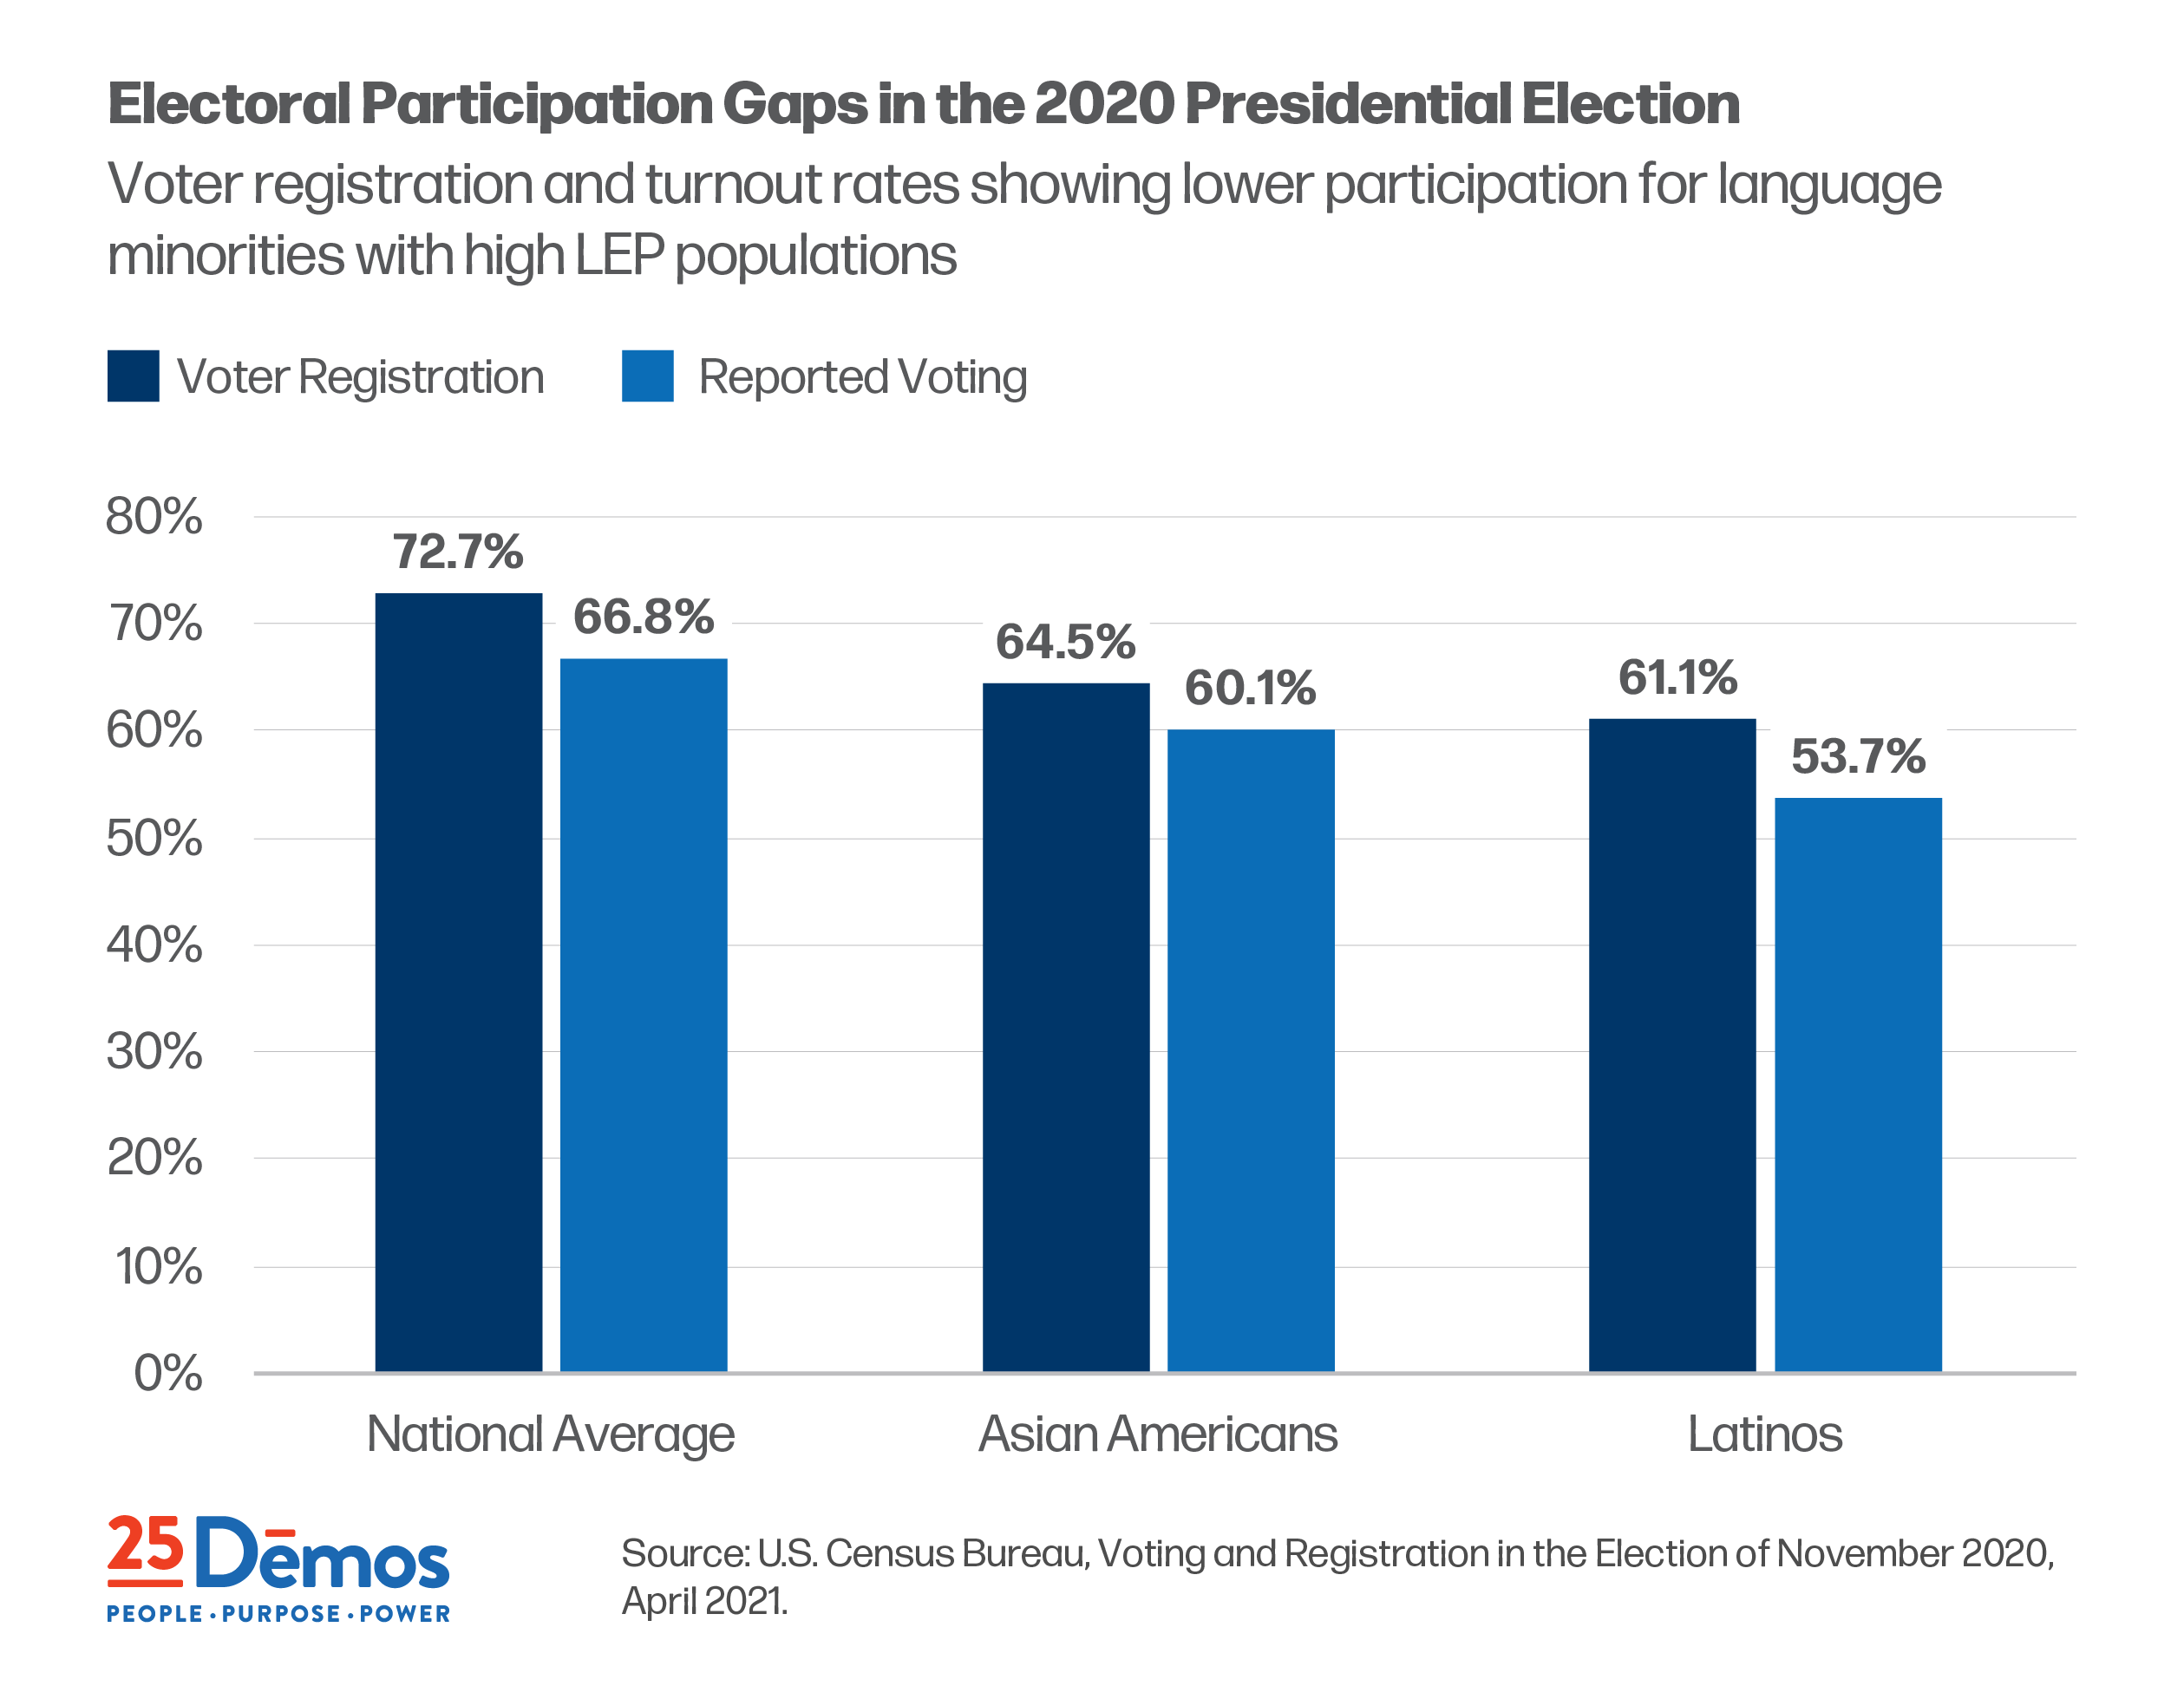
Although turnout gaps cannot be attributed solely to limited English proficiency, differences of 10 percent or more have persisted over several election cycles, and, given the high percentages of LEPs in the Asian American and Latino populations, there is at least a strong hypothesis that gaps in English-language ability are among the root problems.
Moreover, research shows that these gaps can be closed by increasing access through language assistance policies. For example, between 1996 and 2004, Asian Americans’ turnout rate rose from 58% to 71% after language access coverage for minorities increased under the 1992 amendments to Section 203. The Latino voter registration rate nearly doubled between 1974 (34.9%) and 2004 (57.9%). And reports from 2006 showed that in various jurisdictions, American Indian turnout rose by 50% to 150% due to the availability of language assistance.


