The Demographic Divides In Voter Turnout
In my latest at Salon I explore a new working paper by political scientists Stephen Ansolabehere and Brian Schaffner, the most comprehensive examination of voters and nonvoters that has ever been performed. As I note my piece, studies of non-voters have been difficult because of small samples and because people often misrepresent whether they voted. By validating survey data (comparing what an individual says about voting to their actual voter file) and analyzing a massive database of voter files, the authors are able to give the clearest picture of turnout that has ever been documented. Their findings are rather stunning: they suggest that turnout may well be even more stratified by income, race and gender than previously suspected.
Some key lessons:
-
Very Few Americans Vote Regularly
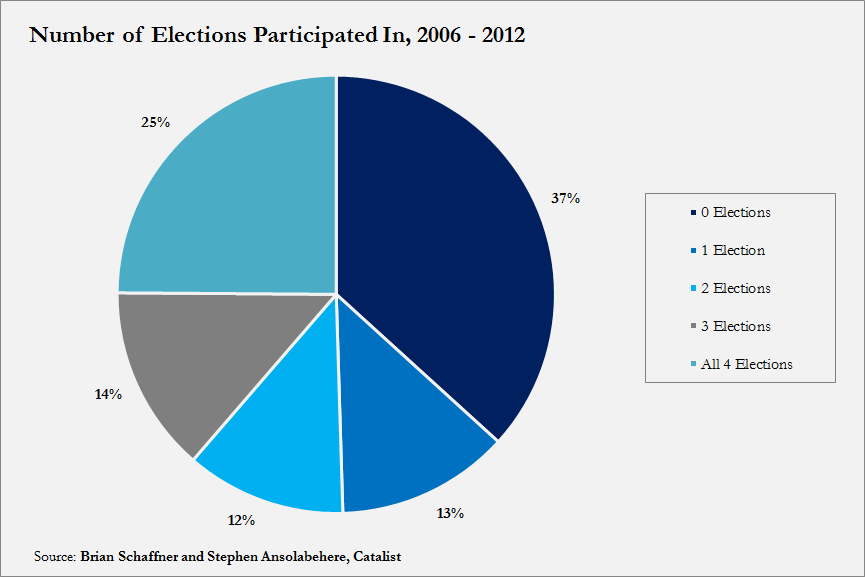
By using Catalist (see a brief methodology note at the end for a full discussion of the data sources) Ansolabehere and Schaffner are able to examine more than 2 million individual’s voting records across four elections, 2006 and 2012. What they find is that very few Americans vote regularly, in fact, only 25% of Americans voted in all four elections. A whopping 37% voted in none of the elections. The other 39% of the population participated with varying frequency: 13% voted in only one election (generally Presidential), 12% in two, and 14% voted in three (most missed a single midterm). By using the data from 2010 and 2012, the authors divide Americans into four categories: core voters (voted in both), midterm only voters, presidential only voters and nonvoters), which leads to the next insight.
2. "Core Voters" Are Different
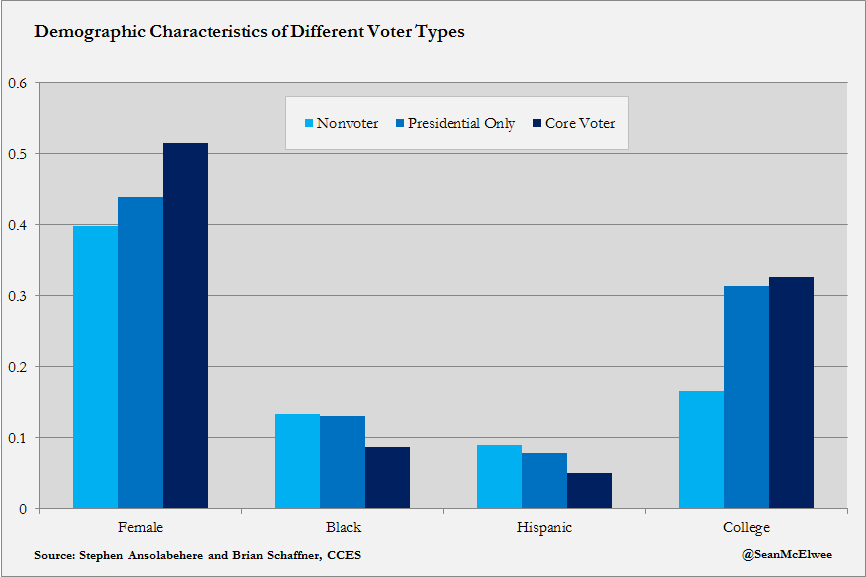
Using CCES, the authors can determine how core voters are different. They discover first that core voters are older: age for a non-voters is 48, for a Presidential only voter 44, and for a core voter 53. They also find that voters core voters have a higher income, which is in line with other research. Political scientists Lynn Vavreck, Anthony Fowler and Ryan Enos find that a one standard deviation increase in propensity to vote was associated with a $6,000 increase in income. They also find that African-Americans and Hispanics make up a larger portion of non-voters than core voters. Indeed, CCES data actually suggest that Black turnout was lower than White turnout in 2012 (contrary to the Census Bureau). Core voters are also far more likely to be college-educated and female than nonvoters. Overreporting may be part of the problem: by validating their data, Ansolabehere and Schaffner find that a stunning 63% of those who did not actually vote in 2010 reported that they did vote on CCES.
3. "Core Voters" Are More Conservative
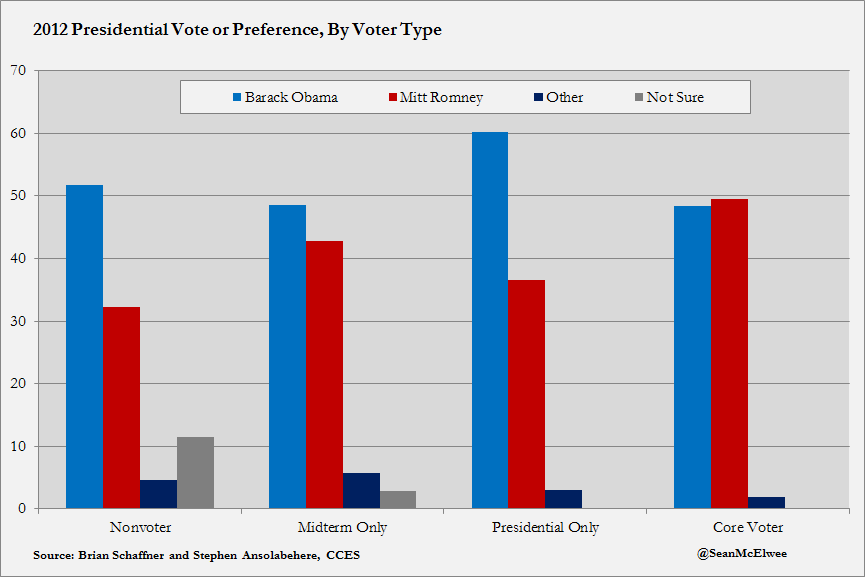
In my Demos report Why Voting Matters, I used American National Election Studies data (and a large academic literature) to show that voters are more conservative than nonvoters. In the study cited above (using CCES), propensity to vote correlates with more conservative views on a number of key policy issues (including minimum wages, gay marriage, taxes and federal housing assistance). Although Schaffner and Ansolabehere don’t examine data that is as granular, they have the advantage of a far larger sample. Their research suggests that core voters are more conservative than nonvoters and Presidential only election voters. This leads to more conservative voting patterns. In 2012, nonvoters preferred Obama 52% to 32%, while core voters preferred Romney 49% to 48%. In 2010, nonvoters preferred Democrats 34% to 31%, while core voters preferred Republicans 50% to 46% (those who only vote in Presidential elections preferred Democrats 43% to 37%).
Conclusion:
This new study adds much to our understanding of turnout. A small core of the electorate, those who turnout frequently to both midterm and Presidential elections (and likely off-cycle and primary elections) have an overwhelming influence over policy. They are richer, more educated and whiter than the general population. They also have policy views that are more conservative, particularly on economic issues, than average Americans. Policies that increase turnout would serve to make the electorate more representative of average Americans.
For more information, read my report Why Voting Matters or the working paper by Brian Schaffner and Stephen Ansolabehere, “Beyond the Core and Periphery: A New Look at Voter Participation Across Elections.”
Data Note (From Salon): Schaffner and Ansolabehere use two sources: Catalist and the Cooperative Congressional Election Study Panel (CCES). Catalist is a firm that purchases voter files and combines them with other relevant factors to aid political campaigns. Schaffner and Ansolabehere use a sample of nearly 3 million voter files from Catalist that cover the 2006, 2008, 2010 and 2012 elections. CCES us a 19,000 respondent survey performed in both 2010 and 2012. By using Catalist, Schaffner and Anslohabere were able to validate turnout in CCES, meaning that they check a respondent’s voter file to ensure they voted.