Introduction
The freedom to vote is America’s most important political right outside of the original Bill of Rights, and it is also the most hard-won right. In the early years of our republic, only white landowners could vote. Slowly, the franchise was expanded in the states to incorporate white male laborers, and women gained full or partial suffrage in most states before winning the 19th Amendment to the US Constitution in 1920, which federalized full and equal voting rights for women. In the hardest voting rights struggle, Black Americans, whose right to vote was recognized in the 15th Amendment to the US Constitution, continued to face official and unofficial restrictions and suppression in Southern states and cities until the Voting Rights Act of 1965 established strong federal protections for the freedom to vote by banning or limiting many of the discriminatory election policies and practices of the Jim Crow South.
In Southern states and elsewhere, eligible voters often face restrictive policies such as strict registration deadlines, photo identification requirements, and racially-motivated redistricting.
The Voting Rights Act—combined with subsequent legislation such as the National Voter Registration Act, which requires state agencies to provide opportunities for voter registration—has helped us make significant progress in boosting voting by Black Americans and other historically marginalized groups. At the same time, the overall voting rate fell to historic lows in this period, and, today, some American citizens are still without voting rights while many more face new restrictions or unnecessary challenges in exercising their right to vote. Millions of incarcerated persons, who are disproportionately people of color, cannot vote while serving their time, and millions more face limits on voting even when they are released. So too, enfranchised Americans’ freedom to vote continues to be restricted by policies and practices that circumvent or violate the spirit of the Voting Rights Act, which was itself severely curtailed in the Supreme Court’s alarming Shelby decision in 2013. In Southern states and elsewhere, eligible voters often face restrictive policies such as strict registration deadlines, photo identification requirements, and racially-motivated redistricting. Many of these same states are also antagonistic toward making it easier to vote, by limiting early voting and other easier-access alternatives to the traditional voting booth. Reflecting an ongoing legacy of institutional racism in our election systems, this new generation of election policies and rules are targeted at certain groups and disproportionately affect people of color, people who are poor, and young people.
One important consequence of this legacy and continuing evolution of voting restrictions is unequal voter turnout in elections, with white Americans, and particularly affluent white Americans, out-participating people of color, low-income people, and young people by significant-to-wide margins. As a result, large numbers of lesser-advantaged Americans are left out of the democratic process: in 2012, 26 million eligible voters of color did not vote, and, among eligible voters earning less than $50,000, 47 million did not vote. In 2014, 44 million eligible voters of color did not vote, and 66 million eligible voters earning less than $50,000 did not vote.
These voter “turnout gaps” or voting inequalities are well-known among experts who study American democracy, but, in the following explainer, we argue that such voting inequality is underestimated in its social impact and in the larger policy debates about the direction of our country. More specifically, while it is obvious to many why the turnout gaps matter for democracy, it is less obvious why closing the turnout gaps and creating a more fully inclusive democracy matters for the policy decisions and social outcomes that should be the fruit of our democracy.
We aim to help clarify one important reason why this is so by examining how the turnout gaps reflect not only differences in power and privilege but also striking differences in policy views and ideology. At the core of this problem, we see that people in the under-voting groups tend to be more or substantially more in favor of progressive economic policies and government intervention in the economy compared to more affluent voters and particularly more affluent white voters. While money in politics is increasingly a focal point for explaining why the US policy landscape leans so heavily to the right compared to those of other wealthy democracies, the data we look at here suggest that our country’s cumulative voter turnout gaps—historic and contemporary—are also an important factor in the growing misalignment of public policy with the concerns and needs of working-class and low-income people, particularly in communities of color.
Unequal Turnout
In the 2012 presidential election, 62 percent of Americans turned out to vote. In the 2014 midterm, 42 percent of Americans voted. Though midterm turnout is generally lower than turnout in general elections, 2014 represents a dip from turnout in the last midterm election, when 46 percent of Americans showed up at the polls. In fact, 2014 represents the lowest aggregate turnout rate the Census Bureau has recorded since it began collecting voting data in 1978. Even starker, however, are the significantly lower turnout rates among lower-income Americans and people of color compared to richer Americans and whites as a whole.
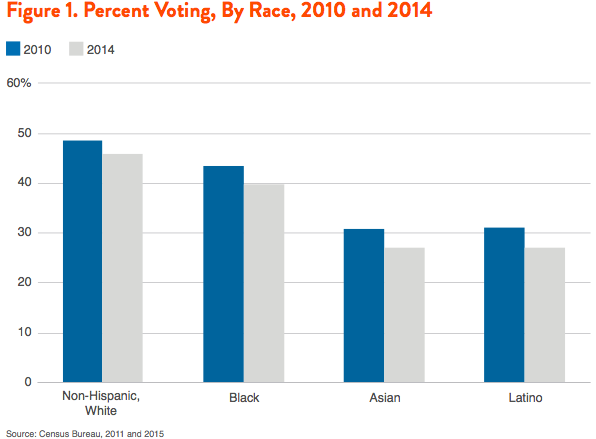
In 2014, turnout among non-Hispanic whites was 46 percent, compared with 40 percent among Blacks, 27 percent among Asians and 27 percent among Latinos (see Figure 1). Between the 2010 and 2014 midterm, white turnout dropped by 6 percent. Black turnout dropped by 9 percent, and Asian and Latino turnout by 12 percent and 14 percent, respectively. The gap between midterm and Presidential turnout is disproportionally on people of color. While non-Hispanic white turnout dropped by 29 percent between 2012 and 2014, it dropped by 40 percent among Blacks, and 43 percent and 44 percent for Asians and Latinos, respectively.
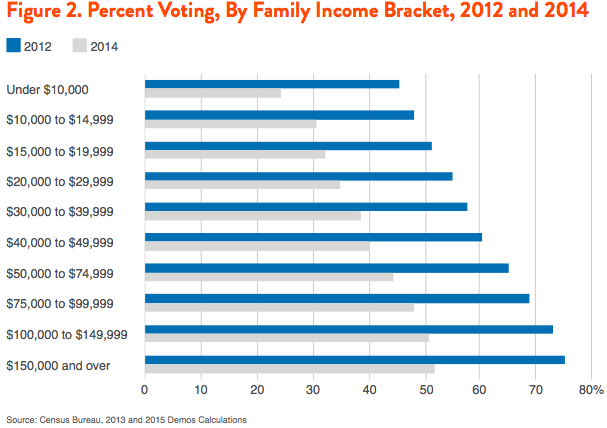
Similarly, turnout dropped by 47 percent among the lowest income bracket, but only 31 percent among the highest income bracket between 2012 and 2014 (see Figure 2). While 52 percent of those earning above $150,000 voted, only 1 in 4 of those earning less than $10,000 did. Class gaps are magnified by age gaps. Among 18-24 year olds earning less than $30,000 turnout was 12 percent in 2014, but among those earning more than $150,000 and older than 65, the turnout rate was more than five times higher, at 65 percent.
The data on turnout gaps do not tell an entirely bleak story. The Voting Rights Act and the NVRA and other voter registration policies have helped to boost turnout by Black Americans significantly, most notably in the last two presidential elections. In 2012, Census data showed that Black voter turnout was higher than white turnout, with white turnout at 64 percent and Black turnout at 66 percent. In 2014, however, Black turnout was 5 points lower than white turnout. Moreover, Black-white turnout gaps also vary significantly by state. In 2012, Black turnout was 8 points lower than white turnout in Massachusetts, but it was 11 points higher in Mississippi. In 2014, Black turnout in Massachusetts was 27 points lower than white turnout and 17 points lower in California. Latino turnout rates varied dramatically by state in 2012, from 18 percent in Alabama to 50 percent in Florida, compared to 58 percent and 66 percent white turnout, respectively. In 2014, only 30 percent of Black voters turned out in California.
It should also be noted that Census data overstate Black and Latino turnout, and the turnout gaps that we see in some states could be as much as twice as large. Further, we do not know very much about what is happening at the municipal level. The data is limited, but at least one study suggests that Black Americans turnout in municipal elections at a rate 8 points lower than whites, with Latinos 39 points lower and Asians 36 points lower.
Turnout Gaps and Opinion Gaps
Our democracy has far too many missing voices, particularly among those who are already less advantaged due to racial and class barriers in our society. Such voting inequalities depress overall participation in our elections, but if we look at public opinion data that can be broken down between voters and nonvoters, it is clear that the turnout gaps are also very much about the content of our politics.
Simply put, by excluding so many eligible voters, our election systems do a very poor job of giving voice to the full diversity of viewpoints in our electorate, including sharp viewpoint differences in key areas of public policy. Indeed, the viewpoints of lower-voting populations are almost entirely ignored in elections and policymaking, in no small part because they are missing at the polls. Thus, clearly and urgently, we need to close the voting gaps to ensure greater balance in electoral and policy outcomes, so that all Americans, not just affluent white Americans, may enjoy the fruits of democracy.
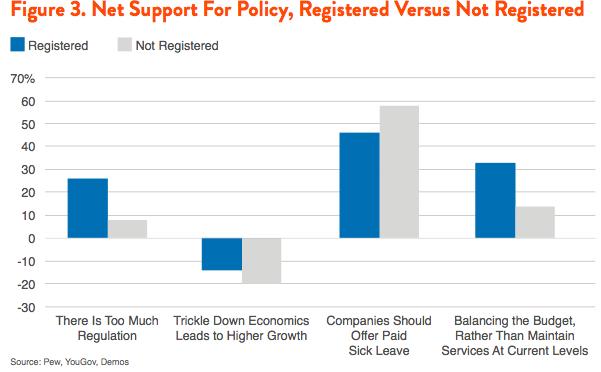
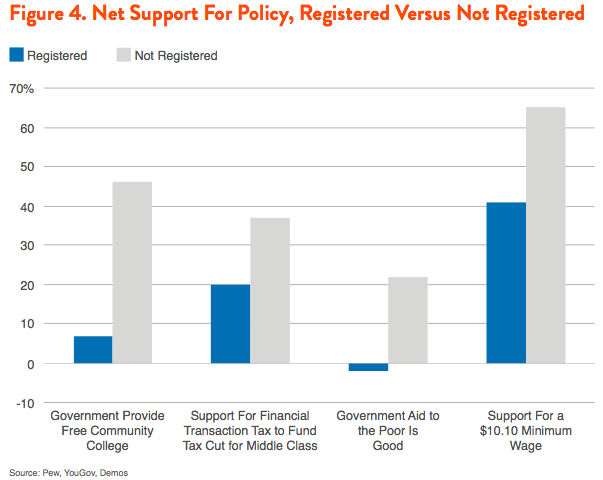
In the analysis that follows, we examine public opinion differences between voters and nonvoters, which help to illuminate the political and social impact of voter turnout inequalities. Because pollsters do not regularly ask about previous voting behavior, we use voter registration status as a proxy for distinguishing voters and nonvoters, as do many other studies. On every issue for which Demos was able to obtain data, non-registered people were more progressive than registered people, meaning (for our purposes here) more supportive of policies that help lower-income Americans and those with less opportunity due to institutional and interpersonal racism. Figures 3 and 4 show net support for progressive priorities, which is the percent of people opposed subtracted from the percentage in support (those who were “not sure” were excluded). A positive number indicates that more people support than oppose the policy, while a negative number indicates that more people oppose than support the policy. Sometimes these gaps were dramatic, and in many cases enough to shift public opinion from a minority to a majority in support. For instance, in a YouGov poll, a proposal for government provision of free community college for all had net support of 46 points among non-registered individuals (63 percent in favor, 17 percent opposed ), but only 7 points among registered individuals (43 percent in favor and 36 percent opposed). On net, 37% of non-registered Americans expressed support for a financial transactions tax to pay for a tax cut for the middle class (54 percent in favor and 17 percent opposed), compared to 20 percent of registered Americans (46 percent in favor and 26 percent opposed). These numbers are even more impressive given that non-registered Americans are more likely than registered Americans to say “not sure” on many policies.
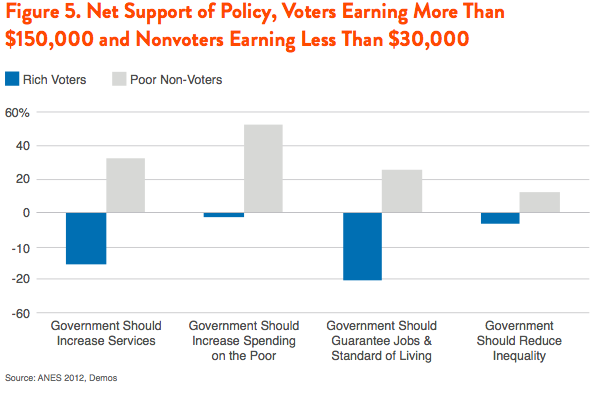
Using the American National Election Study data from the 2012 election, we directly compared voters to nonvoters. On different aspects of government’s role in the economy, the voting gaps harbor deep class and racial divides of opinion. Here, again, Demos calculated net support for each policy. Figure 5 shows that affluent voters (those earning more than $150,000) are far more likely to oppose government policies to help the middle class than low-income non-voters (those earning less than $30,000). Here we see something dramatic: on every policy, a majority of affluent voters oppose the progressive option, while a majority of low-income nonvoters support it. On net, affluent voters oppose higher services by 31 points (55% against, 24% in favor, the rest say keep services the same) compared with net support for increasing services of 31 points among low-income nonvoters (50% in favor, 19% against). Low-income nonvoters are significantly more likely to support increasing aid to the poor (59 percent in favor, 7 percent against) and a strong role for government in guaranteeing jobs and living standards (51 percent in favor compared to 26 percent of nonvoters against). High-income voters oppose both more aid to the poor (22 percent in favor, 25 percent against) and overwhelmingly rejected a job guarantee (21 percent in favor and 62 percent against).
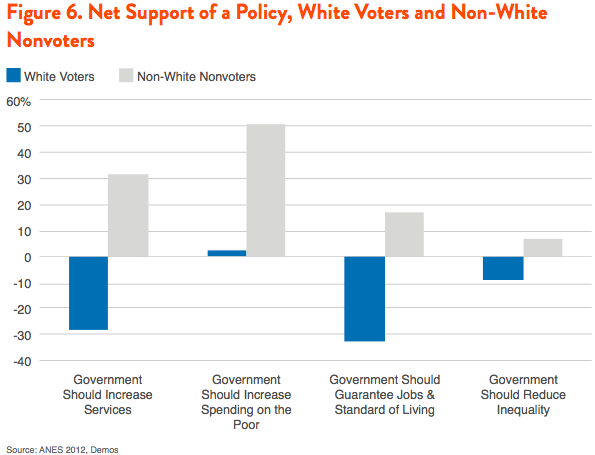
Figure 6, comparing the preferences of white voters and non-white nonvoters, reveals similar patterns, with three of the four issues showing diametric opposition, and one issue (federal spending on the poor) showing a very large gap in net support.
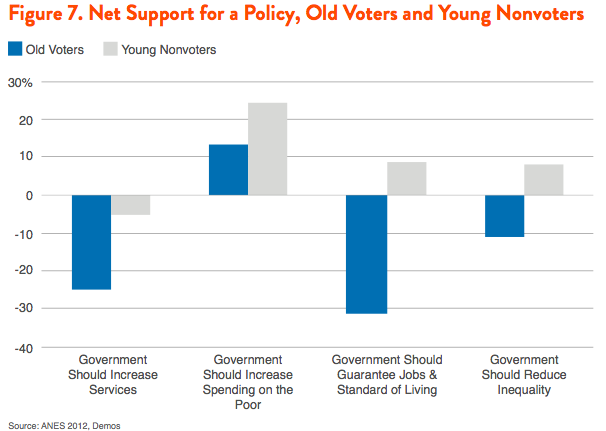
Figure 7, comparing old voters (over 65+) to young nonvoters (18-34), also reveals preference gaps, albeit somewhat smaller gaps. But still, on three of the four issues, a majority of young nonvoters who had an opinion on the issue favored the more progressive option, while the same is true of old voters on only one issue (government spending for the poor).
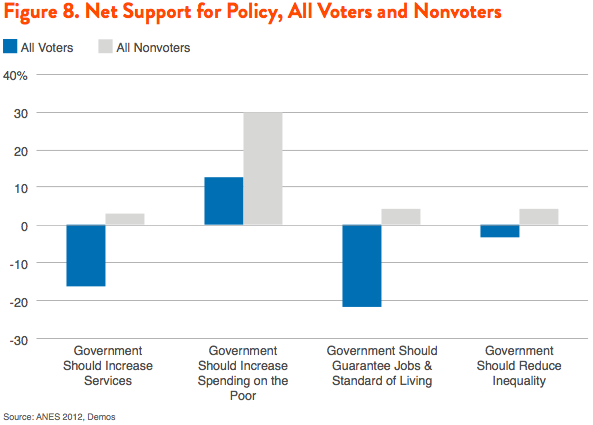
Just looking at voters and nonvoters generally, regardless of other demographic characteristics (see Figure 8), reveals a similar if somewhat less polarized picture: nonvoters support boosting services, while voters oppose it; both nonvoters and voters support boosting spending on the poor, but nonvoter support is far stronger; and nonvoters support the idea that government should guarantee jobs and living standards as well as take actions to reduce inequality, while voters oppose these ideas. All of this suggests that voters are not, at least on issues related to redistribution, a carbon copy of the electorate. Rather, what we see is that white affluent voters, who have the highest voter turnout rate, tend to oppose many policies that a majority of Americans, including nonvoters and non-affluent voters, either support or do not oppose, which suggests that such policies could be much more winnable if nonvoters voted.
Thus, closing the turnout gaps is not only important (at least in some parts of the country) for achieving proportionate representation in elected bodies, but also essential for ensuring that the views of all eligible voters are reflected in the election process. This could have significant implications for public policy, a subject we turn to in the next section.
Voter Turnout and Policy
In America today, public policy is deeply biased towards affluent white people, as numerous scholars have discovered. In light of the income and race differences, and the differing views, of voters and nonvoters, it seems logical and likely that voter turnout differences are a significant part of the problem of white-affluent bias in public policy. While it is difficult to entirely disentangle how much of this policy bias can be explained by differences in turnout, in fact there is strong evidence to suggest that more inclusive voting could help to shift public policy in a more inclusive and widely beneficial direction, particularly for working class and poor Americans and communities of color.
Historical Evidence
The first way to test the implications of voter turnout for public policy is to examine the major expansions of the franchise that occurred in the past. Summarizing the experience of Britain, France, Germany and Sweden, Daron Acemoglu and James Robinson write, “there is a close correspondence between the decline in inequality and the extension of the franchise.” A study of 12 Western European countries over the period of 1830 to 1938 finds that “the gradual lifting of socio-economic restrictions on the voting franchise contributed to growth in government spending,” a finding supported by other studies on the subject. A study of Latin American countries from 1970 and 2008 finds that the adoption of free elections boosted spending on education, health, social security and welfare, and other research on Latin America supports this thesis. Research on the elimination of poll taxes in the United States finds that the resulting higher turnout among poorer Americans was a driver of more government spending on welfare. In his seminal work, Growing Public, Peter Lindert finds that “Fullness of political voice seems crucial to the shift toward more egalitarian fiscal systems.”
Other research strongly suggests that the expansion of suffrage to women led to an increase in government spending. One study suggests that women’s suffrage “coincided with immediate increases in state government expenditures and revenue and more liberal legislative voting patterns for federal representatives.” Another finds that women’s suffrage, by boosting government spending on health, reduced child mortality by 8-15 percent, preventing 20,000 child deaths annually.
In a pioneering 2012 study, Elizabeth Cascio and Ebonya Washington find that the abolition of literacy tests for voter registration shifted the distribution of government funds to areas with larger Black populations. Other research suggests that the mobilization of Black voters led to a dramatic shift in the voting patterns of Southern Democrats.
International Evidence
International differences in turnout affect policy; here, again, higher turnout and lower class bias in voting are associated with more generous social welfare policies. There is also growing evidence, for example, that our history of comparatively low and unequal voter turnout has been a key constraint on welfare state growth and development in the United States. As Lane Kenworthy and Jonas Pontusson write, “low turnout offers a potentially compelling explanation why the American welfare state has been so much less responsive to rising market inequality than other welfare states.” A study of 85 democracies finds that higher voter turnout leads to “larger government expenditure, higher total revenues, more generous welfare state spending.” A study that focuses on 18 democracies between the years of 1960 to 1982 concluded that turnout boosts welfare spending, even after controlling for political and environmental factors. Compulsory voting in Switzerland increases electoral support for progressive referendums by up to 20 percentage points, according to another study.
Other models look at voter turnout and inequality. One study of 78 countries finds that if voter turnout increased from 40 percent to 80 percent, on average it would reduce the Gini Coefficient (a frequently used measure of income inequality) in these countries by .04, which is equal to the entire effect of taxes in the United States. In a study comparing the relative impact of redistribution on different factors (strength of liberal parties, union density, etc.) Vincent Mahler finds that voter turnout is among the strongest: “on average, a 1 percent increase in electoral turnout is associated with a reduction of about three quarters of a Gini point in overall inequality.” Although there has been less research on class bias in turnout internationally, mainly due to data limitations, the research that we have suggests that high-income bias of turnout reduces redistribution.
State-Level Evidence
Political scientists Kim Hill and Jan Leighley find in two studies that states with a more pronounced class bias of turnout tend to have lower rates of social welfare spending. They find that low turnout among poor households, rather than high turnout among the rich, drive this phenomenon, and this finding has been supported by other studies.
Political scientist William Franko has examined how class bias in voter turnout affects how often legislators introduce and act on social welfare and affordable housing legislation. He finds that a two standard deviation increase (moving from a state in which the rich are 25 percent more likely to vote than the poor to one in which they are 39 percent more likely to vote) in the class bias of the electorate leads to a 17 percent reduction of bills related to social welfare and a 22 percent reduction of bills related to housing. The converse also holds true: decreasing the class bias of voter turnout (rich people being more likely to vote than poor people) will lead to more legislative proposals related to these issues. Franko finds that reducing high-income bias in voter turnout leads to more spending on healthcare for children, higher minimum wages and more regulation of predatory lending. More broadly, another study finds that the class bias in turnout has an impact on how public opinion is or is not translated into public policy by state legislatures. Specifically, when class bias is low, the liberal opinions of the public translate into liberal policy. But when class bias is high, liberal public opinion has no effect on policy. Other recent research shows that states with higher turnout inequality have higher income inequality.
Voter turnout is also correlated with levels of government funding. In a 2003 study, Paul Martin finds that counties with higher turnout receive more funding from the federal government, and, more recently, he and Michele P. Claibourn find that “districts that vote at lower rates have less impact on their representatives’ policy positions.” In this light, widespread felon disenfranchisement, which significantly depresses voter turnout in many cities and counties, is particularly troubling. Even in states with more liberal felon re-enfranchisement policies, the criminal justice system can still reduce democracy. Vesla Weaver and Amy Lerman show that interaction with the criminal justice system dramatically reduces voter participation, even after controlling for other relevant factors like race and income.
Conclusions on Inclusive Turnout and Public Policy
The research on democracy and policy suggests three broad lessons. First, those who vote have more representation than those who do not. Second, those who do not vote tend to have views that are more economically progressive than those who do vote. And third, voting plays a significant role in the distribution of government resources as well as the size of government and who benefits from public policies.
Increasing and equalizing voter turnout is not a panacea for reducing inequality and achieving racial equity in public policy; it is one important factor among others, including the role of money in politics. But, as Robert Franzese argues, where turnout is low and unequal, politicians who already cater to big donors have an even stronger incentive to do so. He concludes that whether or not democracies respond to rising inequality is conditioned by the political participation of poorer people in the electorate. After the wealth of a country, voter participation and income inequality are the most important determinants of tax and transfer progressivity. As President Obama has argued, “It would be transformative if everybody voted. That would counteract money more than anything.” He is correct.
Building Blocks for Inclusive Voting
It’s clear that who votes, and who doesn’t, affects public policy. In order to have a truly vibrant democracy, the United States needs to take steps to ensure inclusive voting. These steps include both reducing barriers to voting, affirmative steps to mobilize potential voters and implementing stronger protections of the right to vote.
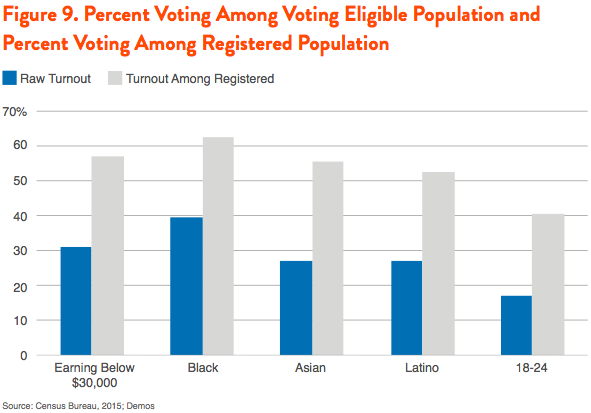
Make Registration Easier with Same Day Registration and Robust Compliance with the National Voter Registration Act
One of the key barriers to voting in the United States is registration. While, internationally the US has comparatively high turnout as a share of the registered population, it lags far behind in terms of “raw turnout,” or turnout as a share of voting age population. As Figure 9 shows, turnout is far higher for people of color and low income people who are registered. Political scientists have shown that the requirement to register dramatically reduces voter turnout. This effect primarily hurts poorer and younger Americans and people of color, particularly Latinos and Asian-Americans. One study finds that “states with restrictive voter registration laws are much more likely to be biased toward upper-class turnout.”
Same-Day Registration (SDR) allows voters to register on the same day they vote, rather than being required to register weeks in advance. So far, SDR has passed in California, Colorado, Connecticut, District of Columbia, Hawaii, Idaho, Illinois, Iowa, Maine, Minnesota, Montana, New Hampshire, Vermont, Wisconsin, and Wyoming. The National Voter Registration Act, signed into law in 1993, enables and encourages registration by requiring all Departments of Motor Vehicles, public assistance agencies, and other state government offices to offer opportunities for voter registration to people when they interact with these agencies (the part of the law relating to DMVs is now commonly called the “Motor Voter” provision). However, many states are performing poorly in their compliance efforts, both at public assistance agencies and at DMVs. A recent Demos analysis suggests that if all low-performing states brought their Motor Voter compliance to the 75th percentile, an 18 million additional voter registration applications would be submitted in a two-year period.
Elections expert Tova Wang finds that SDR and agency registration can boost turnout, particularly among the young, low-income people, and people of color. Other recent research suggests that policies like SDR and agency registration, lead to lower class bias in turnout. In addition, SDR and agency registration tend to amplify the effectiveness of get out the vote operations (GOTV) to further boost turnout. A recent study finds that a district with high levels of campaign spending and party GOTV efforts and SDR has turnout 11 points higher than a district with high levels of campaign spending and GOTV but not SDR. Christopher Mann, professor of political science and Director of LSU’s Academy of Applied Politics as well as advisor to dozens of voter mobilization efforts, tells me that it is “unequivocally” true that “SDR makes more low-income people targets for GOTV.” These reforms have been directly tied to progressive policy: “Less costly voter registration— through motor-voter rules, or through day-of-polling registration—is generally associated with higher taxes, higher spending, and larger family assistance and workers’ compensation payments.”
Move Registration Systems Toward Automatic Voter Registration
A key flaw in the US election systems is that the burden of registration rests on citizens rather than on government. Research suggests that millions of people who want to vote are unable to because of registration deadlines. Data from the Cooperative Congressional Election Study suggests that nearly 10 million people did not vote in 2000 because of administrative problems. Automatic Voter Registration (AVR) would hold the government responsible for registering eligible citizens, thereby ensuring that no one who wants to vote is turned away at the polls. With AVR systems, state governments would collaborate with DMVs, public assistance agencies, and other agencies to gather and integrate the data necessary for building complete and accurate registration rolls. Ideally, registration would be an automatic, “opt-out” process, meaning that only those who actively choose not to register will be left off the voter rolls. The opt-out approach, studies suggest, would lead to higher rates of registration. For example, in Oregon, the first and only state to adopt an opt-out AVR system, 300,000 voters will be added to the rolls, increasing the registered population by 12 percent. While it is hard to precisely predict, due to likely variations by state, moving toward AVR-type registration systems in the states undoubtedly will boost voter registration and voter turnout overall, perhaps dramatically so.
Strengthen, Don’t Weaken, the Voting Rights Act
The three reforms above would target registration, a key barrier to voting. However, in the wake of the Supreme Court’s alarming Shelby decision of 2013, which threw out the preclearance formula of the Voting Rights Act, states have begun to pass an increasing number of racially biased voter ID laws. Preclearance mandated that states with a history of voting rights violations were required to seek approval from the Justice Department prior to changing voting laws. Without it, states have raced to pass laws making it more difficult to vote. In North Carolina, H.B. 589 eliminated same-day registration, reduced the early voting period, established a strict voter ID bill, and eliminated pre-registration for youth. To prevent racist voting restrictions, Congress should pass the Voting Rights Advancement Act which would require any state with multiple voting rights violations in the preceding 25 years to be subject to a pre-clearance requirement.
Conclusion
Political scientist E.E. Schattschneider once noted, “The flaw in the pluralist heaven is that the heavenly chorus sings with a strong upper-class accent.” This is nowhere more evident than in our political system, starting with voter turnout inequalities by income and race as well as education and age. While many commentators maintain that voters hold preferences similar to nonvoters, new data suggests this isn’t true, particularly when the views of white affluent voters—with the highest turnout—are compared to the views of low-income voters, who have much lower turnout. In this scenario of un-inclusive elections with large voting inequalities by race and income, instead of leveling the playing field of representation, on a principle of one person/one vote, our democracy mainly serves a single dominant class of affluent white voters.
While America has made significant progress in protecting and expanding voting, now five decades after passage of the Voting Rights Act, tens of millions of eligible voters still do not vote and far too many face explicit or implicit barriers that prevent them from participating in our elections. To be a truly representative democracy, the United States must strive for universal, fully inclusive voting. If we achieve this goal, our elected bodies will better reflect the full diversity of Americans, including the viewpoints of millions of Americans who do not currently have an equal voice in our democracy, which all people deserve. So, too, our diverse communities will be better served by the resulting policy outcomes that are so consequential in everyday life.