GDP measures economic growth, but is it an accurate measure of progress?
While GDP has been steadily increasing, indicating a growing economy, other metrics of progress show a very different picture. Demos’ report, Beyond GDP, makes the case for why GDP is an incomplete measure and explains in depth what is missing from GDP that prevents it from measuring progress. Demos is also releasing a set of infographics that charts important social measures against GDP growth. One chart shows how inequality is rising even as GDP is rising, which shows that fewer people are benefitting from the economic growth.
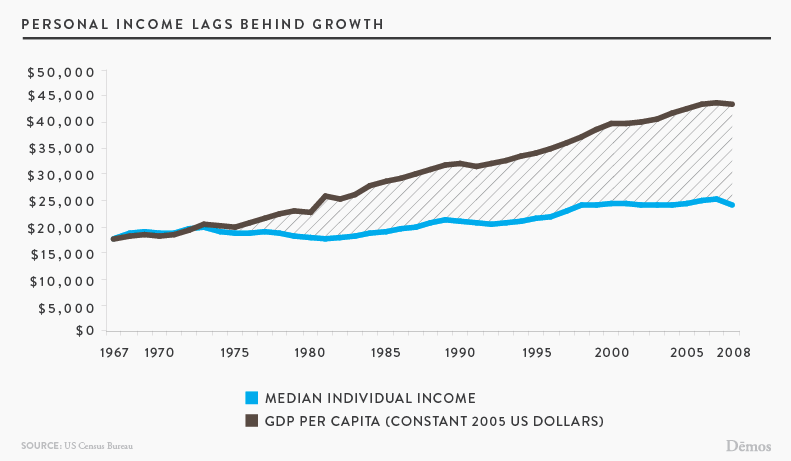
Personal Income Lags Behind Growth
Over the last 30 years, personal income lagged far behind GDP growth, and the gap between them grew steadily. GDP per capita—the amount of income potentially available for every person—more than doubled, while actual income gains were much smaller.
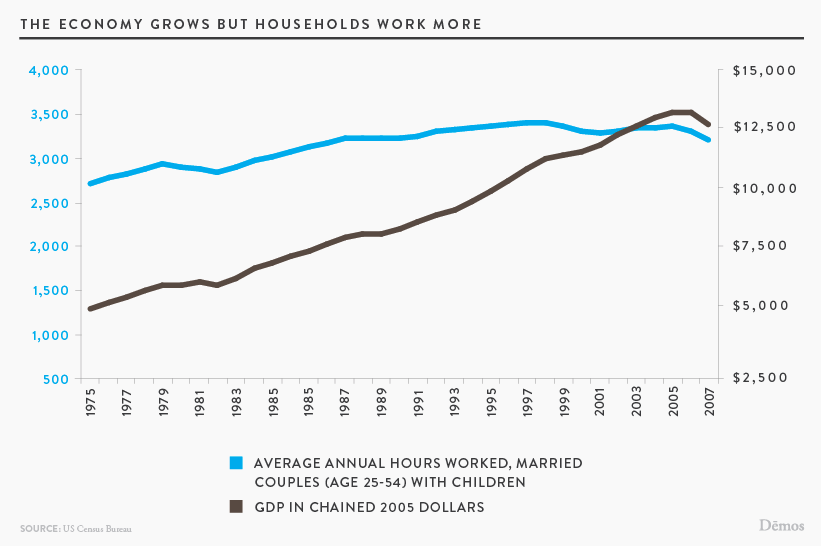
The Economy Grows but Households Work More
Family income has grown modestly in recent decades, but mainly due to working more, not higher wages—an average of roughly 700 more annual work hours per household in 2000 compared to 1975, and still roughly 500 more in 2009, even with the financial crisis and downturn of that period. This contrasts sharply with the previous pattern from the late nineteenth century through the mid-twentieth century, as growth and productivity gains were channeled into steadily reducing working hours.
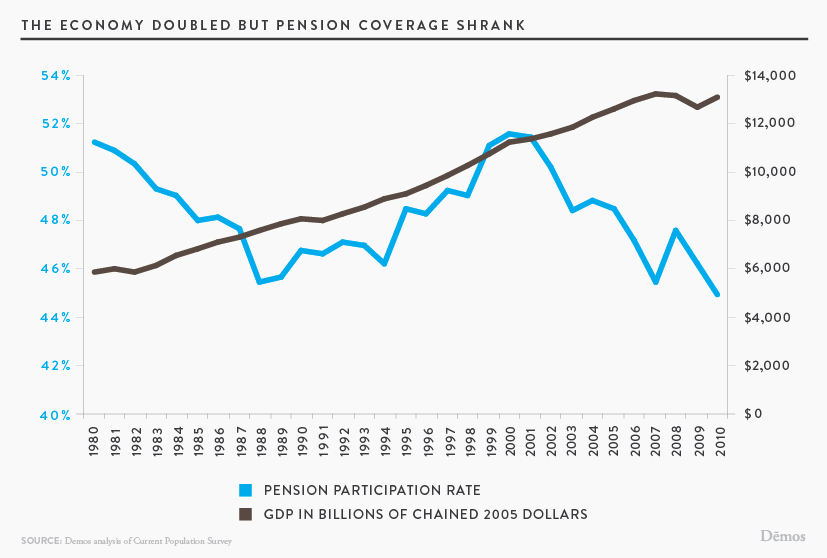
The Economy Doubled but Pension Coverage Shrank
Across the last thirty years of steady GDP growth, essentially half of the working age population had no pension coverage beyond Social Security. After a steep decline in the 2000s, the pension coverage rate was approximately 45 percent in 2010, the lowest level since 1988 and 6 percent lower than in 1980.
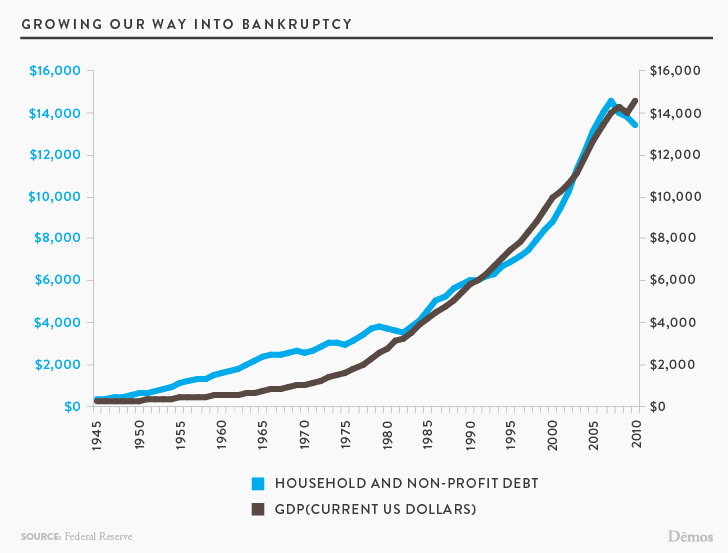
Growing Our Way into Bankruptcy
Growth financed by rising debt, not middle class earnings (which have been relatively flat), may be the defining trend of the economy that ran aground in 2008.
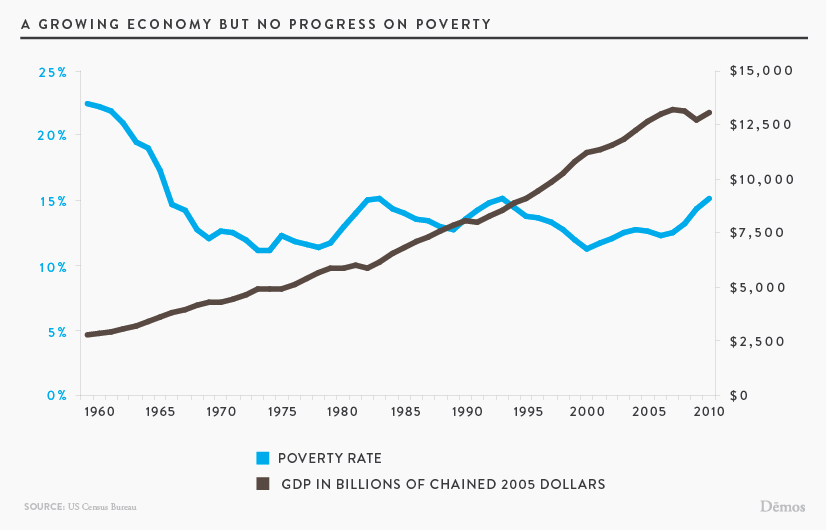
A Growing Economy but No Progress on Poverty
After steep declines in the 1960s, we’ve made little progress in reducing poverty. Today roughly 15 percent of Americans live below the poverty line, the same as in 1968.
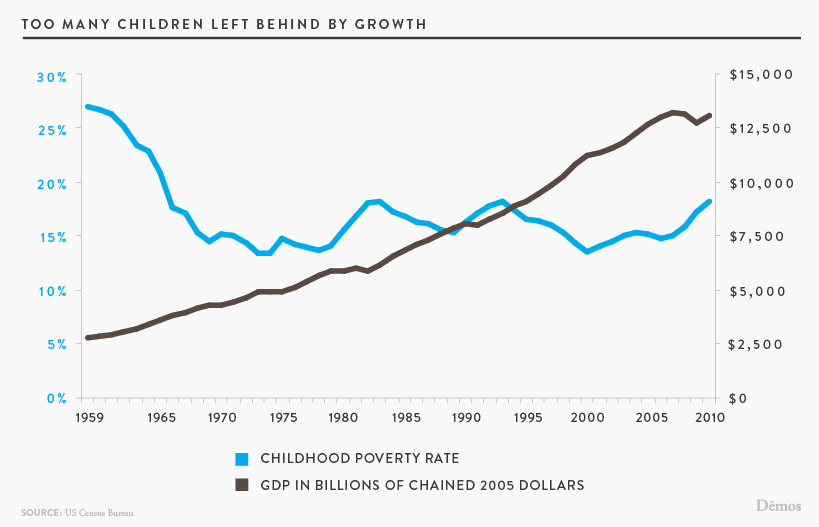
Too Many Children Left Behind by Growth
The child poverty rate today is actually 8 points higher than in 1969.
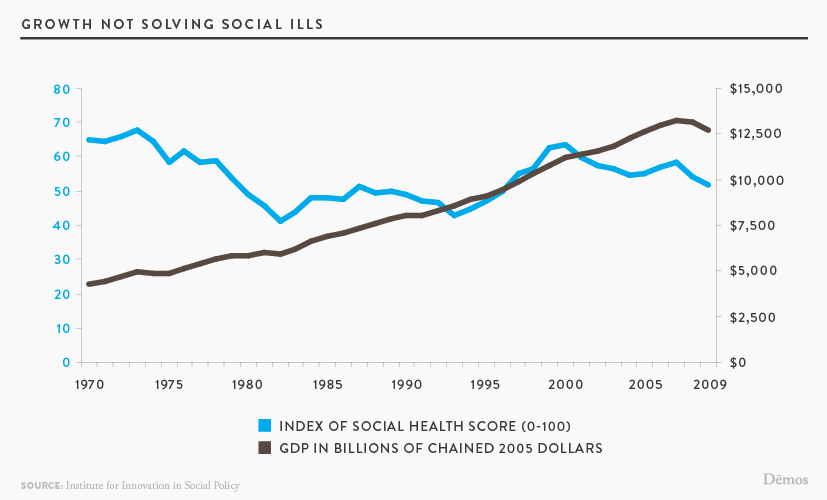
Growth not Solving Social Ills
The Index of Social Health (developed by the Institute for Innovation in Social Policy at Vassar College) calculates a composite rate of social health based on more than fifteen trends, including infant mortality, child abuse, child poverty, teenage suicide, high school dropout rates, homicides, food insecurity, affordable housing, weekly wages, and income inequality. After a serious decline of roughly 25 points from the mid-1970s through the early 1980s, U.S. social health showed some improvement by the late 1990s, but by 2009 still stood roughly 16 points lower than in 1974. Clearly we need more than growth to promote social progress, and other evidence suggests that, in fact, the kind of highly-unequal growth we’ve had may actually be a driver of social decline in some key areas such as health and education.
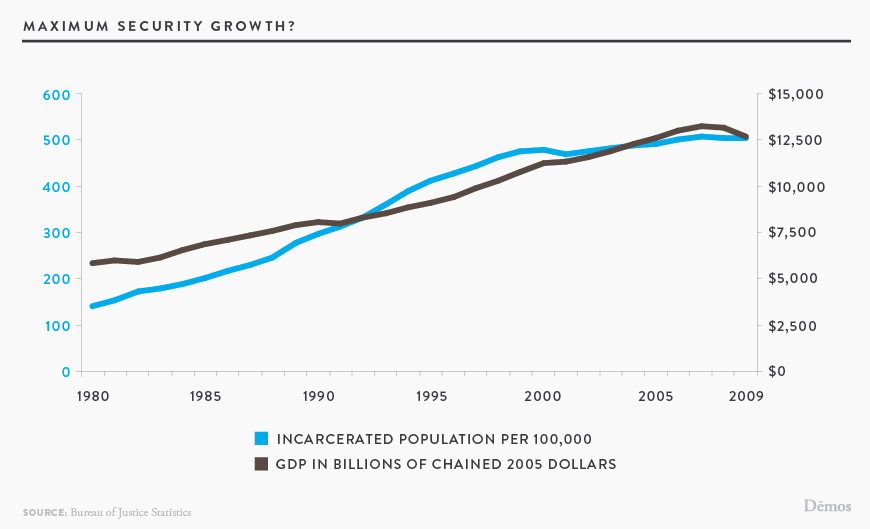
Maximum Security Growth?
Some things did grow faster than the economy. While GDP doubled, the incarceration rate tripled.
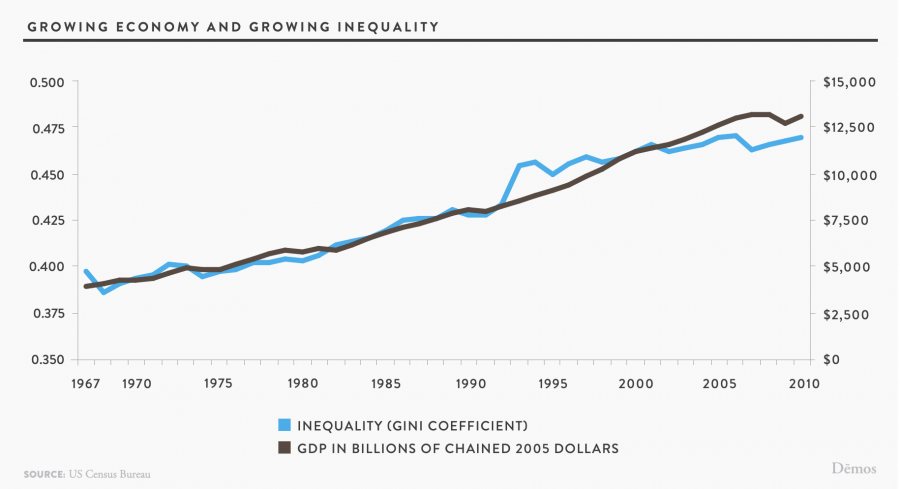
Growing Economy and Growing Inequality
The economy may be growing but the benefits are going to fewer people. We’ve had a growth that divides our country instead of uniting us, with negative consequences increasingly evident in other social trends.
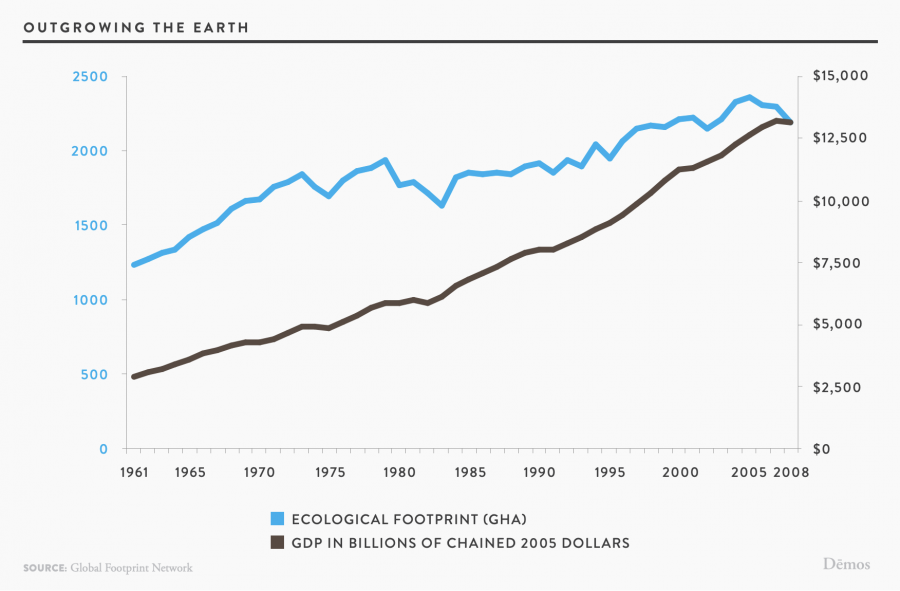
Outgrowing the Earth
One of the fatal flaws of GDP is that it does not recognize environmental costs of economic activity, and these costs are often left for society to pay while some costs are passed down to future generations. The United States’ “ecological footprint”—its consumption of resources and burdening of natural waste absorption capacities—is nearly double the average rate found in other advanced countries. From an environmental perspective, U.S. living standards are dangerously inefficient and grossly out of balance with average human needs as reflected in other advanced societies.
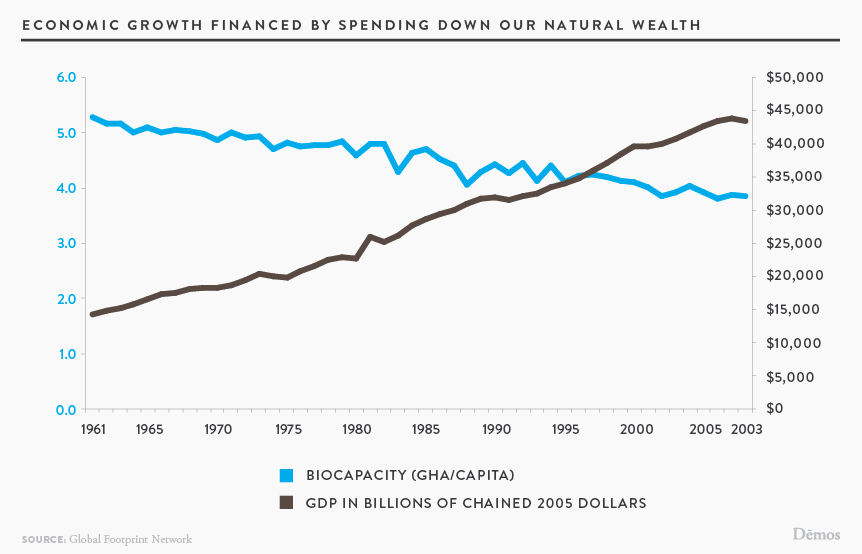
Economic Growth Financed by Spending Down our Natural Wealth
Year by year with rising growth, our biocapacity—the availability of resources and waste absorption capacity in a given area—has steadily declined. The environmental equivalent of financing current consumption with our retirement savings, we are spending down our natural wealth at a rate that threatens future well-being, even near-future well-being.
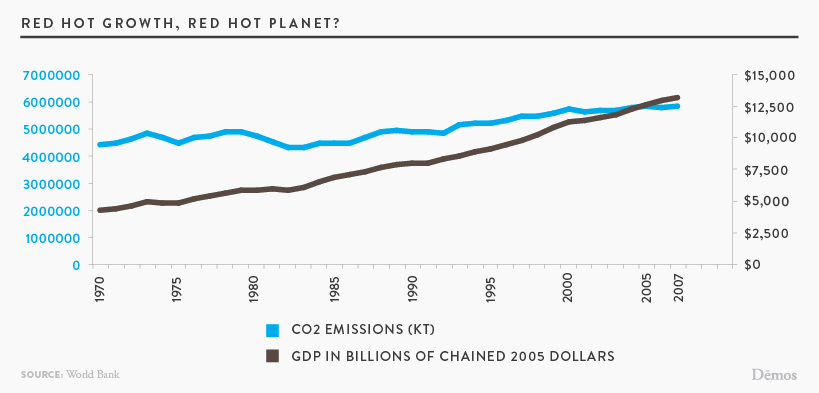
Red Hot Growth, Red Hot Planet?
Our heat-trapping carbon emissions are out of control, rising steadily with economic growth.
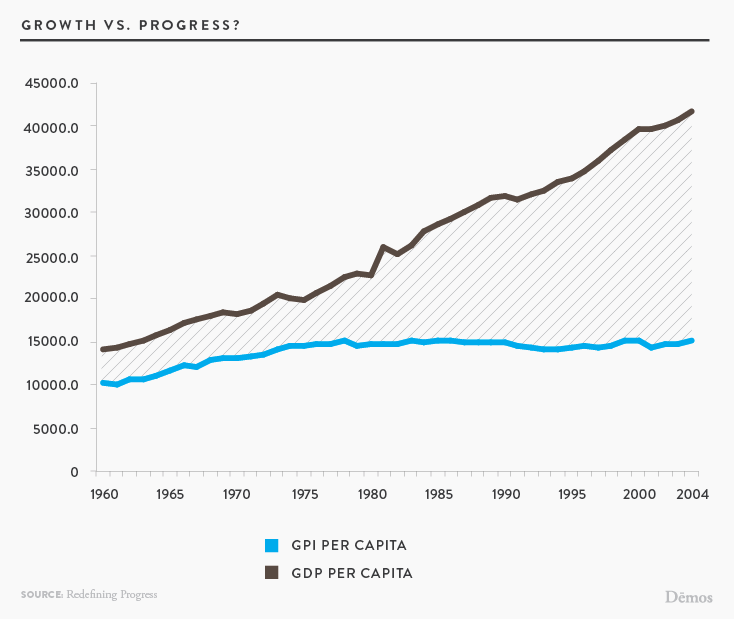
Growth vs. Progress?
If GDP leaves so much out, how can we really measure our progress? In fact experts have developed many types of alternative indicators that bring us closer to reality. One is the Genuine Progress Indicator, or GPI, which starts with GDP but adjusts the level growth for as many as 26 factors of household, social, and environmental change. Over the last 50 years, a large and growing gap has emerged between GDP and GPI. Basically, we have expanded our economy without improving our overall well-being as a nation. It’s also striking that the flattening GPI trend since the 1970s probably matches how most people feel about their lives—not much progress, and for many a real struggle to get by.