This report was produced in collaboration with Brian Schaffner, Professor of Political Science at University of Massachusetts Amherst and Jesse Rhodes, Associate Professor of Political Science at University of Massachusetts Amherst.
Policymakers should be responsive to the public, not to big donors. Yet an increasingly large body of evidence shows that the rich and the donor class have a disproportionate influence on policy.1 This influential donor class is not representative of the United States’ vibrant diversity.2 Donors are wealthier and older than average Americans, and they are more likely to be white and male than the general population. This dynamic plays out in troubling ways at the national as well as the local level.
In Washington D.C.’s 2014 mayoral election, successful candidate Muriel Bowser raised $2,115,335 in donations, 69 of it percent from large donors (those who gave more than $1,000). Her general election competitor, David Catania, pulled in $845,881, of which 59 percent came from large donors. The incumbent mayor, Vincent Gray, raised $774, 996, and 71 percent of it came from large donors. In total, donors giving more than $1,000 accounted for 67 percent of all money raised by the three candidates in 2014. Small donors giving $50 or less accounted for less than 2 percent.
The fact that big donors—overwhelmingly white, male and high-income—hold such outsized influence in a city that is extremely diverse both demographically and economically is deeply problematic.3 The 2014 election was defined by campaign finance, both in terms of the serious scandals dogging the incumbent mayor, and the immense amounts of fundraising.4 The Washington Post reported that the level of “post-primary mayoral fundraising” was “unusual.”5 The solution is to for the city to implement The Citizens Fair Elections Program Amendment Act of 2015, which would institute a public financing system to give every D.C. resident a say in their democracy.
Key Findings
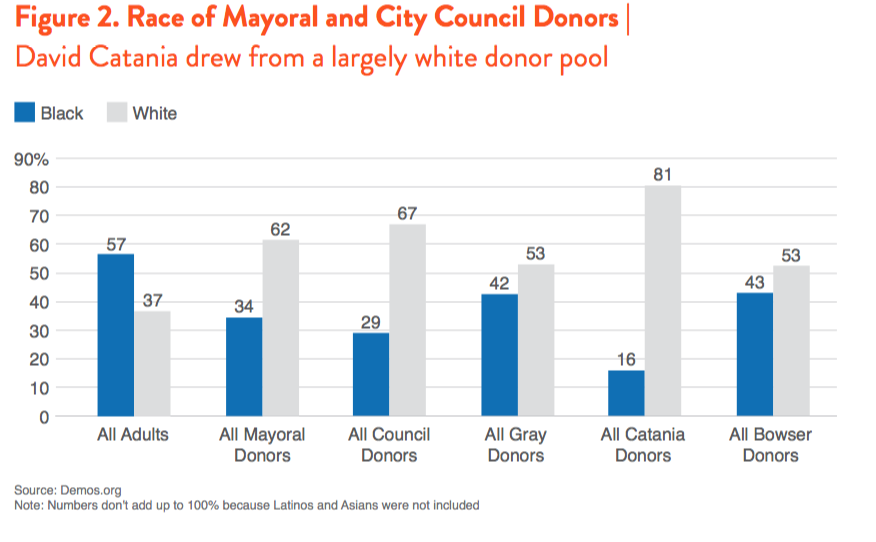
- The donor class doesn’t represent the diversity of Washington D.C.’s population. While 37 percent of D.C.’s population is white, 62 percent of mayoral donors and 67 percent of City Council donors are white.
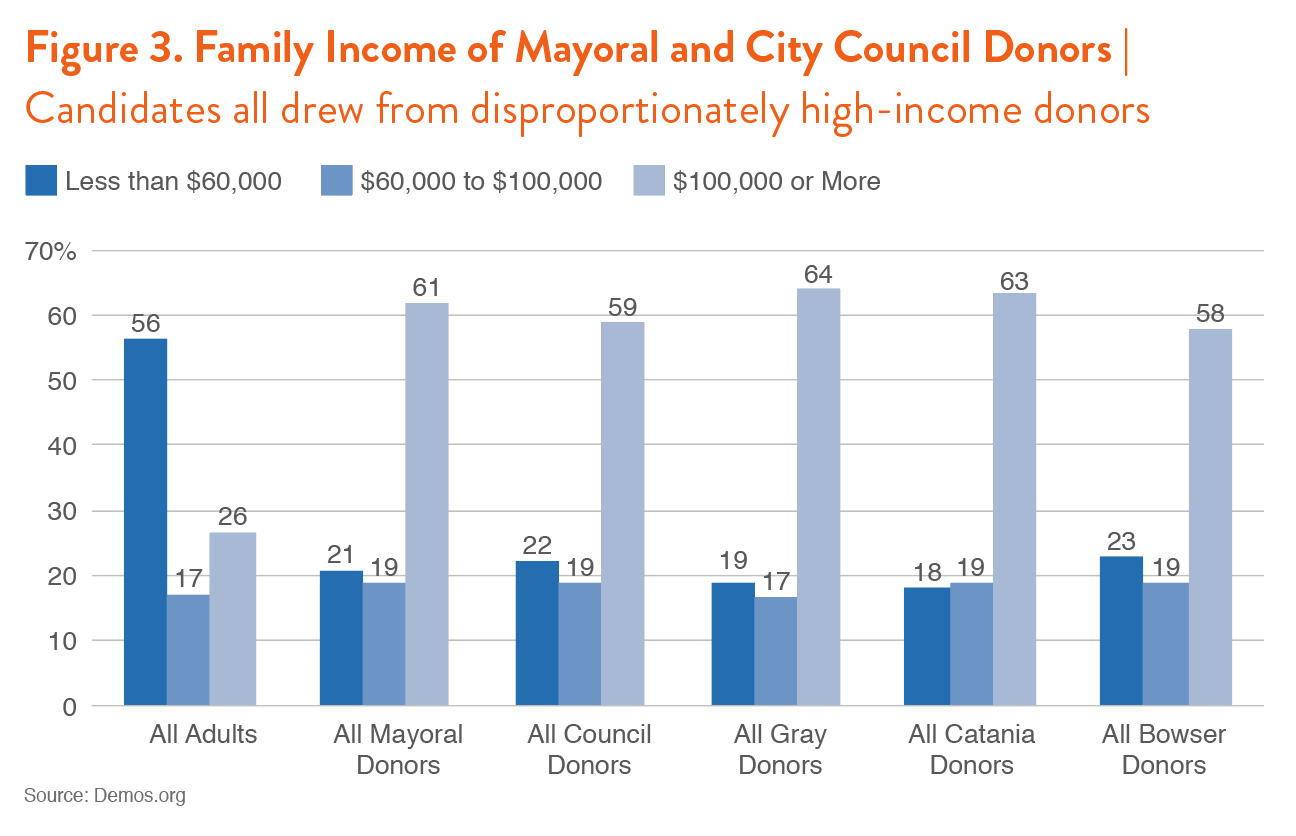
- The rich are disproportionately represented in the donor class. Only a quarter of D.C.’s adult population makes more than $100,000, but 59 percent of council donors and 61 percent of mayoral donors do.
- The pool of donors who make small donations is more representative than the pool of those who make large donations. Women make up about half of those giving less than $50 to mayoral and council races, but only 31 percent of those giving more than $1,000. People of color make up 47 percent of mayoral donors giving less than $25, but 31 percent of those giving more than $1,000.
- The small donor pool contains more income diversity as well. Those making $100,000 or more comprise 44 percent of donors giving $25 or less to mayoral candidates, but 72 percent of those giving $1,000 or more.
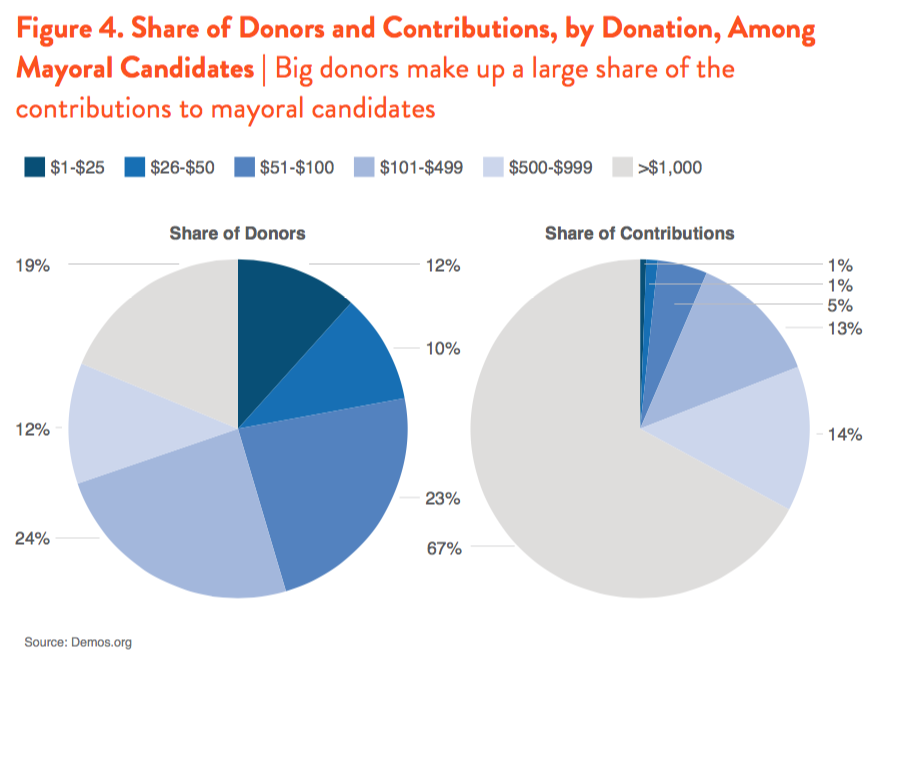
- Mayoral candidates relied heavily on big donors, raising less than 7 percent of their total funds from donors giving less than $100, and 67 percent from donors giving more than $1,000.
- A system of public financing would increase the diversity of D.C.’s donor class, leading to more responsive policymaking.
The Rise of Big Money Campaigns
Campaign finance figured heavily in the 2014 mayoral campaign, most notably a five-year probe of incumbent Mayor Vincent Gray’s campaign finances during his 2010 campaign.6 Shortly before the 2014 campaign began, U.S. Attorney Rob Manchen accused Gray of running a “shadow campaign” with Jeffrey Thompson, a businessman and major political donor.7 Muriel Bowser (who challenged Gray in the Democratic primary) and David Catania (who ran against Bowser for Mayor) were two of the three City Council members who called for Gray’s resignation (Mary Cheh was the third).8 Thompson later pleaded guilty to channeling millions of dollars in illegal contributions to candidates, including Gray.9 Six of the people related to Gray’s 2010 campaign pleaded guilty to campaign funding crimes; however, prosecutors did not bring charges against Gray.10
The other 2014 mayoral candidates had their own brushes with campaign finance controversy. In 2015, Bowser formed FreshPAC, which aimed to raise $1,000,000 to support her agenda and elect allies to the City Council. (The PAC took advantage of a campaign finance loophole that eliminated the cap on contributions in non-election years).11 FreshPAC primarily raised money from large money donors, and took in many $10,000 donations, only possible because of the campaign finance loophole.12 The PAC was shut down after facing intense scrutiny, and plans to refund its donations back to the contributors.13 Before shuttering, the PAC raised eyebrows when healthcare executives and powerful contractors began pouring money their money in.14 Mayor Bowser’s business trip to China with major donors (including FreshPAC contributors) led to criticism from Councilwoman Cheh.15 One investigation found that 11 of the largest donors to FreshPAC had received more than $70 million in city contracts.16 The largest donor, First Veitch Street Corporation, had ties to Fort Myer Construction, which received nearly $42 million in city contracts.17
David Catania spent 17 years as the at-large member of the Council (meaning he was elected by the whole city, rather than a ward) before running against Bowser. He had a brush with campaign finance criticism after receiving $1,000 donations from Kaygold LLC and Livsar Enterprises LLC, front organizations tied to Jack Abramoff, a lobbyist who spent four years in prison as a result of his role at the center of a wide-ranging corruption scandal.18 Mitchell Wade, who was involved in a scheme to bribe a government official for defense contracts, gave generously to Catania in 2002.19 This raised some concerns, though there was no further reporting on the subject. Catania was criticized for working a second job (with a salary of $240,000 a year20) at M.C. Dean, a major government contractor, while he was a Council member.21
Although the demographics of the D.C. Attorney General race were not studied for this report, there are important dynamics worth noting. White-collar defense lawyer Karl Racine raised the bulk of his money through a $25,000 donation to himself, a $200,000 loan to himself, and donations from colleagues at Venable LLC, a law firm where he was a managing partner.22 Another candidate, Edward “Smitty” Smith, worked as a lawyer for the federal government (in the Commerce Department and Federal Communications Commission) after several years at the law firm Hogan & Hartson.23 He had a broader donor pool, raising $150,000 from 527 donations.24 Racine faced criticism after his campaign finance reports included a large numbers of donors who failed to list an occupation or place of business.25 Racine’s campaign cited a “botched fundraising database transfer” for the error.26 Paul Zukerberg and Lorie Masters, two other Attorney General candidates, also garnered more than 100 donations and won an appreciable share of the votes.27 Racine won the election with 36 percent of the vote and has pressed for campaign finance reform.28
D.C.’s City Council has also come under campaign finance scrutiny. An investigative report by journalist Patrick Madden at WAMU 88.5 explored more than 1,000 city contracts worth $10 billion and 100,000 donations to investigate the dynamics of “pay to play,” in which businesses give campaign contributions to help them secure government contracts.29 The report finds 300 businesses, all of which had received Council-approved contracts, donated $5 million between 2005 and 2014. Half of the donations came within a year of the contract being approved. In total, one-fifth of all Councilmember contributions came from firms that have sought contracts with the city. The report finds that contractors face strong pressure to make contributions when their contracts are up for Council approval.30 One contractor tells of meeting with Bowser (then a Councilmember) about a contract to cut city grass. He reports that his lawyer advised him to donate to Bowser’s campaign, but he refused to do so. His contract was not renewed.31 Councilmember Vincent Orange was criticized for intervening in the contracting process on behalf of World Wide Parking, which had bundled almost $20,000 for him.32 Former Councilmember Michael A. Brown pleaded guilty to corruption charges after “accepting payments from undercover agents he thought were businessmen seeking D.C. government contracting preferences.”33 Former Councilmembers Kwame Brown and Harry Thomas have all pleaded guilty to corruption charges.34
Campaign finance clearly plays a large role in campaigns in D.C. And it’s apparent that big donors are vying for influence. In many cases, they get it. Policy in D.C. often favors the interests of the powerful donor class, rather than the general public.
Studying The Donor Class
If policymakers are indeed more responsive to the donor class, and particularly big donors, it’s worth investigating the composition of this donor class. Using a new method developed in coordination with political scientists at the University of Massachusetts Amherst, Demos is able to explore the demographics of donors (see appendix for methodology). To examine the donor class for the D.C. mayoral campaign, Demos examined the three major mayoral candidates:
- Vincent Gray, the incumbent mayor who unsuccessfully sought the Democratic nomination and garnered 32.6 percent of the primary vote.35
- David Catania, an independent candidate who was the lead challenger to Bowser, and won 34.6 percent of the general election vote.36
- Muriel Bowser, the Democratic candidate who won the election with 43.4 percent of the vote in the Democratic primary and 54.5 percent of the vote in the general election.37
Demos examined donations given in the period between December 1st, 2012 and November 30th, 2014 for all three mayoral candidates.38 To analyze donors to City Council races, we examined donations given between December 1, 2012 and November 30, 2014 for candidates elected in the 2014 cycle. Those candidates were Charles Allen, Anita Bonds, Mary Cheh, Kenyan McDuffie, Phil Mendelson, Brianne Nadeau and Elissa Silverman. We also examined donations from the period of December 1, 2014 through March 10, 2016 for candidates who are up for re-election in 2016. Those candidates are Yvette Alexander, Jack Evans, David Grosso, LaRuby May, Vincent Orange, and Brandon Todd.39
The Demographics Of Mayoral and City Council Donors
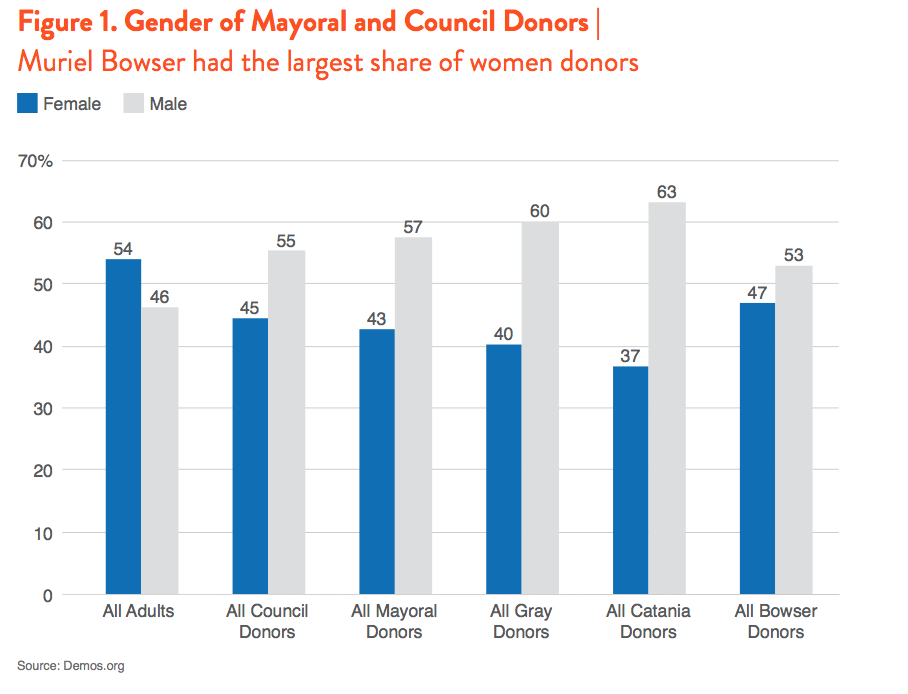
Between candidates, there were some important differences in the demographic composition of their donors (see Figure 1). Muriel Bowser had a more gender diverse donor pool than the other candidates (though it was still majority male). About half of all donors during the period studied gave to Bowser, but she pulled in a slightly smaller share of male donors (48 percent) and a higher share of female donors (57 percent).
David Catania, who ran as an independent, had a whiter donor class than the other two candidates. Whites made up twice as large a share of his donors as they do in the general population. However, all the candidates had donor classes that were whiter than the D.C. population. Whites make up 37 percent of the D.C. population, but 62 percent of mayoral donors. Nearly a third of donors in the sample gave to Catania, but a disproportionate share of white donors (42 percent) gave to him (44 percent gave to Bowser). Though African-Americans make up more than half of the adult population of D.C., according to Catalist,40 they make up a third of mayoral donors and an even smaller share of Council donors (see Figure 2).
All of the mayoral candidates had donors that were disproportionately high-income. Only a quarter of D.C. residents have incomes over $100,000, but 59 percent of donors to City Council candidates and 64 percent of mayoral donors did (see Figure 3). There are also age divides: about half of the D.C. population was older than 45, compared with nearly four-fifths of donors. Gray’s donors were older than other candidates’ donors, and only 13 percent were under the age of 45.
The dataset also includes an estimate of an individual’s ideology on a scale between 0 (most conservative) and 100 (most liberal).41 While the vast majority of D.C. residents are moderate (between 40 and 60), only a quarter of donors were. In fact, donors appear to be more polarized than the general population. Only 31 percent of residents were liberal, but more than 64 percent of donors were, and they were equally distributed among the candidates. The conservative donors were also slightly more conservative than the general public.
The Dominance of Big Donors
All of the mayoral candidates relied heavily on big donors. Donors giving more than $1,000 accounted for 19 percent of mayoral donors, while donors giving less than $25 accounted for 12 percent of donors. However, because of the size of their financial contributions, large donors account for a dramatically larger share of total money received by candidates. In total, two-thirds of the $3.74 million in donations to mayoral candidates that Demos examined came from donors giving more than $1,000. Less than 1 percent came from donors giving between $1 and $25 dollars, and less than 7 percent from donors giving less than $100. Catania raised the largest share from small donors (10 percent), while Gray raised the least (4 percent). Bowser raised 6 percent from donors giving less than $100, but her total from big donors ($1.5 million) dwarfed the total fundraising of both other candidates (see Figure 4). Contemporaneous reporting suggests that Bowser had 118 donors giving the legal maximum of $2,000.42
The Small Donor Pool Is More Diverse
Given the overwhelming influence of the big donor pool, it’s worth investigating how large donors differ, both from the D.C. population in general, and from the small donor pool. Within the donor classes, there is substantial variation between the small and large donor pools, with the small donor pool more closely resembling the D.C. population. The sections below examine both City Council and mayoral donors and compare the donor demographics across the small, mid-sized and large donor pools.
Gender
Among the small donor pool, women and men were nearly equally represented. However, 69 percent of the largest donors (those giving more than $1,000) were men (see Figure 5).

Race
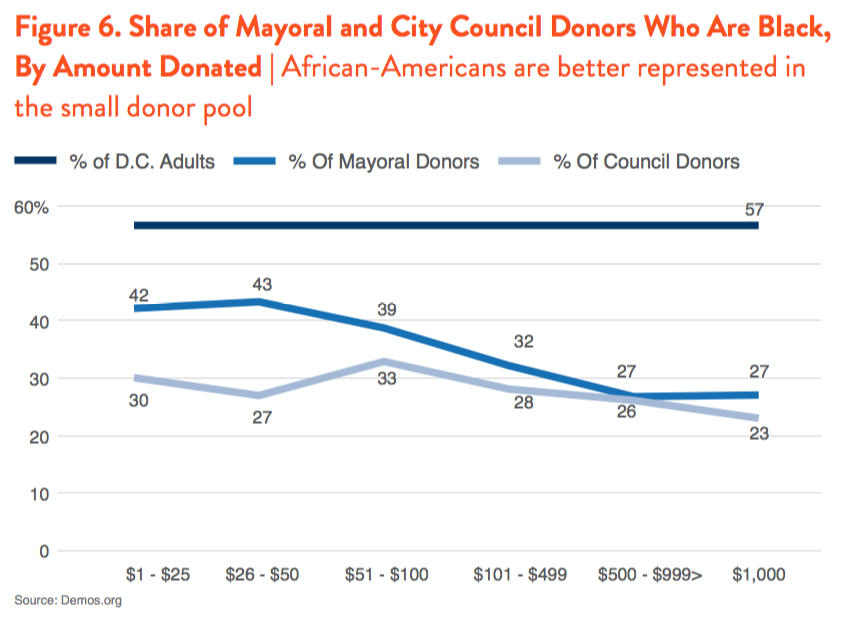
The donors who gave small contributions, in both the mayoral and City Council races, are more racially diverse than the large donors, who are disproportionately white. The mayoral donor pool had more African-American donors than the Council donor pool. Among mayoral donors, 43 percent who gave less than $50 were black, but only 27 percent of donors who gave more than $500 were (see Figure 6). Of the donors who gave less than $50 to mayoral candidates, 47 percent were people of color. Asians and Hispanics combined make up 6 percent of D.C.’s population, but 4 percent of mayoral and Council donors.
White residents are overrepresented in the donor class, comprising in the large donor pool nearly double their share of the general population. The small donor pool is more representative, but still whiter than the general population. The mayoral donor pool is more racially diverse than the Council donor pool (see Figure 7).

Income
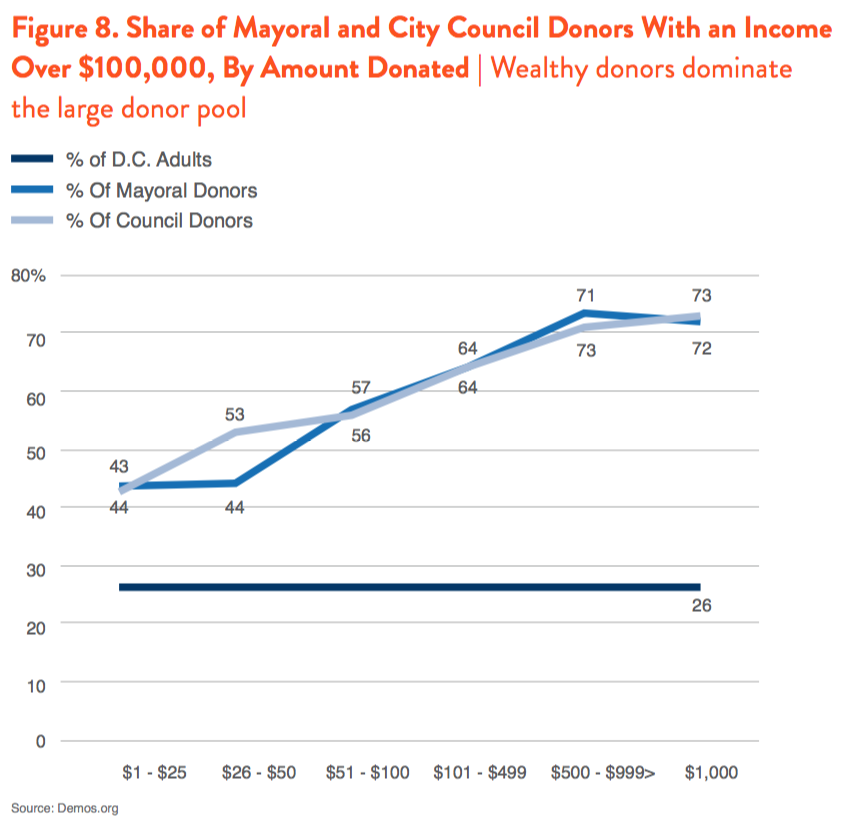
Donors were also overwhelmingly high-income, particularly the biggest donors. This is unsurprising, given that $1,000 is a significant amount of money for a family earning less than $30,000 (about a third of D.C. residents). Even a family earning $60,000 would have difficulty justifying a $1,000 contribution, especially after paying rent in D.C. (the median rent for a one-bedroom apartment is $2,000 a month).43 Though only one-quarter of D.C. residents have an income above $100,000, about 60 percent of donors do (see Figure 8). The small donor pool is more class diverse, with a third of small donors ($1-$25) having an income below $60,000, compared to just 12 percent of the largest donors (over $1,000). The richest residents are slightly overrepresented in the small donor pool, and vastly overrepresented in the large donor pool, making up nearly three times their share of the general population.
Age
There are also age disparities in contributions. People 18-29 make up 13 percent of D.C.’s population, but only 2 percent of donors. Those older than 45 make up a bit more than half of the population, but 78 percent of mayoral donors and 67 percent of Council donors. Those over 45 made up 83 percent of donors who gave more than $1,000 to mayoral candidates, and 79 percent of those who gave more than $1,000 to Council candidates.
Party and Ideology
Though donors as a whole were more likely to be registered as Democrats, the largest donors were slightly more likely to be registered as Republican than the small donors and the general population. The largest donors were also slightly less likely than the general population to be registered as Democrats.
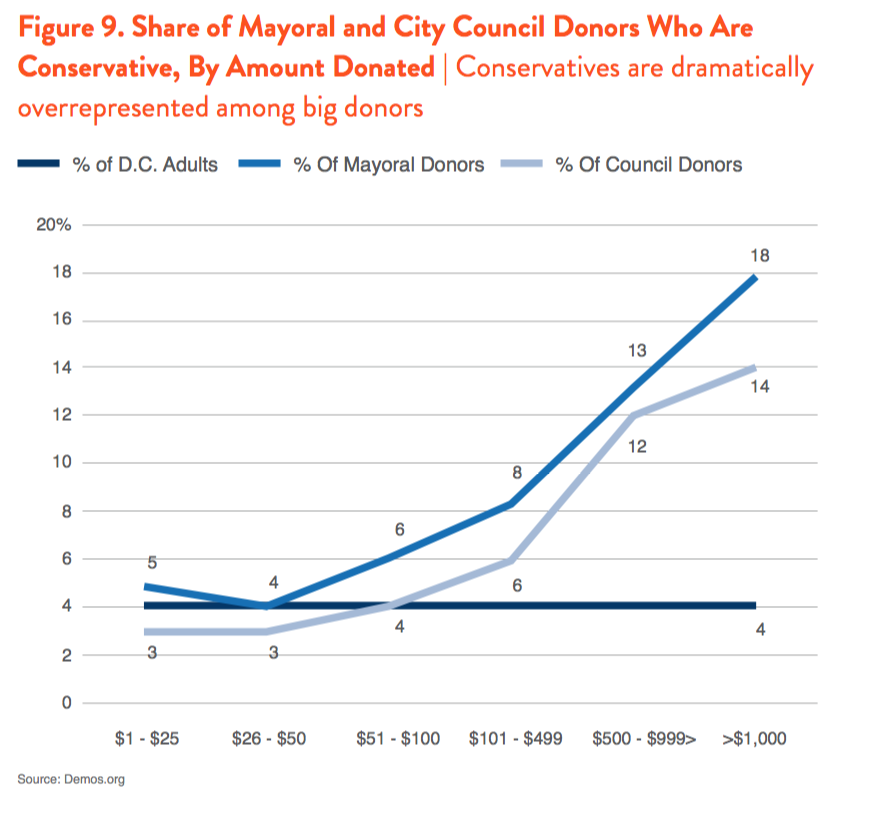
As discussed above, donors are far less likely to be categorized as moderate than the general public. They are slightly more likely to be categorized as conservative and far more likely to be liberal. The biggest donors also tend to come from the more conservative or more liberal end of the spectrum, rather than the moderate middle that represents the majority of D.C. residents (see Figure 9).
Major Donors Distort Policy in D.C.
There is a good deal of evidence that many of D.C.’s recent policy decisions have been pursued to please the donor class. For instance, D.C. recently announced the construction of a practice facility for the Washington Wizards basketball team in Ward 8, the poorest part of the city. Wards include essentially equal shares of the population, but donors from Ward 8 account for only 2 percent of the money that mayoral candidates raised in D.C.44 The average household income in Ward 8 is $44,076, compared with an average of $115,016 for the rest of the city. The result is a stunning 47 percent child poverty rate in Ward 8.45 Ward 8 also has the highest unemployment rate in the country with a similarly sized labor force.46 Instead of using public money to reduce poverty, the city will fund the Wizard’s practice stadium, to the tune of $55 million.47 A bit more than half of the funding will come from Events D.C., a quasi-public organization which is funded by hotel taxes and overseen by a 12-member board appointed by the mayor. Another $23 million will come directly from the District government’s coffers.48 The owner of the Wizards, Ted Leonsis, will pay only $5 million of the construction costs, and another $10 million in philanthropy to aid the surrounding community.49 The stadium is projected to create only 300 permanent jobs (for a cost of $183,333 per job).
The D.C. Council also unanimously voted to grant the Advisory Board Company, a consulting firm, up to $60 million in tax breaks in order to prevent the company from moving to Virginia, on the condition that the company create 1,000 jobs for D.C. residents.50 An analysis by the D.C. Fiscal Policy Institute finds that it’s likely these jobs would have gone to D.C. residents anyway, and the city failed to ensure that the jobs would be well paid.51 Further, the deal fails to include any provisions requiring that the jobs remain permanent. An attempt to add a requirement that the company pay a living wage to subcontractors and building staff failed to pass the Council 10-3.52 The $60 million dollar abatement is equivalent to the yearly Temporary Assistance to Needy Families (TANF) benefit for 11,520 families of three.53
On the other hand, Bowser has also pressed for policies that would benefit the working class, like her recent call for a $15 dollar minimum wage, which the D.C. Council approved on June 7, 2016.54 The most recent $13.4 billion budget has some important positive aspects. It includes large outlays to end homelessness: $660 million over 30 years.55 This follows her last budget, which included a plan to end homelessness by building more homeless shelters and funding services that connect individuals with jobs and counseling. The last budget also included a 35 percent increase in spending on affordable housing.56 However, rather than using growing revenues to address chronic poverty and unemployment, the city has decided to implement a series of tax cuts, large shares of which go to high earners.57 The FY 2016 budget raised the estate tax threshold (meaning fewer estates will be taxed), and included a tax cut for those earning between $350,000 and $1,000,000.58
How Public Financing Could Reduce the Impact of Moneyed Interests
There is evidence that public financing can reduce the influence of the donor class. A study by political scientists Peter Francia and Paul Herrnson shows that candidates who are publicly financed spend less time raising money than privately funded counterparts.59 In his book, Subsidizing Democracy, Michael Miller finds that publicly financed candidates spend more time interacting with the general public. A Demos study of public financing in Connecticut finds that public financing can bring about numerous benefits. Based on extensive interviews with legislators who used public financing, Demos finds, “In the short time since public financing has been in place, Connecticut has seen an increase in diversity in the legislature, a more substantive legislative process, and more freedom from big donor and special interests.”60 One study by a group of scholars spearheaded by Wesley Joe of the Campaign Finance Institute finds, “Large donors are more likely than small donors to give in the interest of advancing their own narrow economic concerns, as distinct from a more general concern about the economy.”61
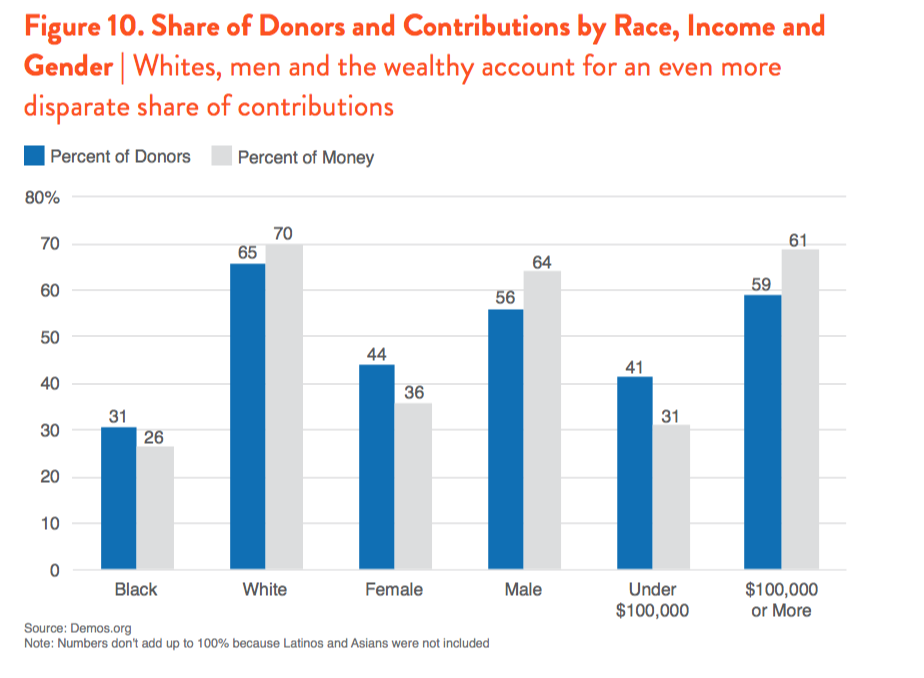
Small donor public financing would help ameliorate the race, gender and income disparities in the donor pool. Because whites, men and the wealthy are disproportionately at the top of the donor pool, their dollars make up the vast share of money going to political campaigns. For instance, because whites are disproportionately represented among large donors, they made up 65 percent of the D.C. donor pool, but their contributions made up 70 percent of donations. Similarly, those making more than $100,000 made up 59 percent of donors, but 69 percent of the contributed money. Women make up 44 percent of donors, but account for only 36 percent of contributions (see Figure 10). Policies that would empower smaller donors would increase the voices of the more diverse small donor pool and thus reduce the influence of big money.
The Case for Public Financing
To minimize the power of big donors and empower the more diverse small donor pool, D.C. should consider implementing a public financing system. Such a system would both increase the influence of small donors and enable councilmembers to spend more time listening and responding to the needs of their constituents, rather than big dollar donors. A study of New York City’s public financing system finds, “When public matching funds are allocated to donors, the small donors were responsible for 61% of the candidates’ funds. In contrast, nonparticipating candidates got 19% of their money from small donors and 53% from donors who gave $1,000 or more.”62 In 2013, 92 percent of candidates participated in New York City’s public financing system.63
D.C. Should Implement The Citizens Fair Elections Program Amendment Act of 2015
Councilmembers Charles Allen, David Grosso, Phil Mendelson (council president), and Brianne Nadeau introduced the “Citizens Fair Elections Program Amendment Act of 2015.” The bill has also been co-sponsored by Councilmembers Mary Cheh and Elissa Silverman, and builds on a 2013 proposal by Councilmembers Grosso and Kenyan McDuffie.
The bill proposes a small-donor matching and grant program. Qualifying contributions of $100 or less would be matched 5:1. Only D.C. residents who are legally able to contribute to political candidates would have their contributions matched. This is an important requirement, as our analysis suggests that 32 percent of donors live outside the city. However, these donors have an outsized impact, both because they give large donations and because a full 45 percent of the money contributed came from donors outside of D.C.
To qualify for the program, candidates must receive the following contributions/dollars combinations:

After reaching the qualification requirements and certified as publicly financed, candidates would receive a grant equal to 20 percent of the amount spent by the average winner of the previous 2 election cycles for that office. Candidates participating in the system are prohibited from receiving donations over $100, which would force them to reach out to a more diverse population of donors. In 2014, 67 percent of money raised for the mayoral race was raised in increments greater than $1,000, which illustrates the importance of expanding the pool of small donors.
Another requirement for participating candidates is that they must participate in one public debate during the primary and two debates during the general election. The bill also creates a new “Citizens Fair Election Oversight Office” within the Board of Ethics and Government Accountability, taking away the authority of the Office of Campaign Finance currently under the D.C. Board of Elections.
Conclusion
D.C. has done much in recent years to benefit low-income people, students and workers. However, there is still far more to be done, and the city still spends large amounts of money to the benefit of wealthy interests. This stems from the reality that the D.C. donor class is richer, whiter and more male than the general population, and has outsized influence on public policies and decision making. These biases are most pronounced at the highest giving levels, further distorting the donor pool. The solution is for D.C. to implement a robust public financing system that would encourage politicians to collect contributions from the more diverse small donor pool. Such a system would also encourage politicians to cultivate a wider variety of donors—and expose them to a wider variety of voices and perspectives—by preventing them from drawing large amounts from big donors.
Appendix:
To perform the analysis in this report, Demos partnered with Brian Schaffner and Jesse Rhodes of the University of Massachusetts Amherst.
UMass used data from Washington, D.C.’s Office of Campaign Finance disclosure site in order to find information on contributions made to current D.C. City Councilmembers and to mayoral candidates during the 2014 election cycle. For Councilmembers elected in 2014 and for mayoral candidates, they used contributions from the 2014 election cycle. For Councilmembers who are up for re-election in 2016, they used to-date contributions for the 2016 cycle. This includes contributions made through March 10, 2016.
The records were then matched into Catalist to extract demographic information on the donors. Because Washington, D.C. data includes complete street address information for individual contributors, they were successful in achieving a very high match rate into Catalist. The list below indicates the percentage of donors successfully matched into Catalist:
Full D.C. Council: 91.6 percent
Mayoral Candidate Gray: 92.9 percent
Mayoral Candidate Catania: 92.9 percent
Mayoral Candidate Bowser: 89.6 percent
In the tables for this release, the demographic information of donors is compared to that of all Washington, D.C. adults.