This is the first article in the “Financial Pipeline Series,” which will examine the underlying validity of the assertion that regulation of the financial markets reduces their efficiency. These articles point out that the value of the financial markets to the real economy is often mis-measured. The efficiency of the market in intermediating flows between capital investors and capital users (like manufacturing and service businesses, individuals and governments) is the proper measure. Unregulated markets are found to be chronically inefficient using this standard because the financial sector systematically extracts value from the process. This costs the economy enormous amounts each year. In addition, the inefficiencies create stresses on the system that make systemic crises inevitable. Only prudent regulation that moderates trading behavior can reduce these inefficiencies.
Introduction
The predominant belief of policy-makers, pundits and academics is that unconstrained financial markets are naturally efficient. This is consistent with a view that has prevailed for decades: perfectly efficient markets can be achieved if only information is equally distributed and natural human greed is allowed to run free to eliminate price anomalies so that market prices are continuously forced toward fundamentally sound values.1 The deregulation of financial markets over the last 35 years is a real-world experiment that tests this theory.
In this world-view, the financial crisis of 2008 resulted from bad behaviors that can be fixed with greater transparency, structural improvements and prohibition of a few particularly dangerous activities. Regulation should limit trading activity as little as possible while still protecting against catastrophe. Financial sector reform, embodied in the Dodd-Frank Act of 2010 and implementing regulations, is focused on mitigating the risk of catastrophic loss, as occurred in the crisis, and on market transparency. To address the “too-big-to-fail” risk, additional large institutions are required to maintain larger capital reserves and procedures for winding up a large failed institution are established. Requirements to mitigate losses in connection with defaults by derivatives counterparties are put in place, as are limited rules to promote transparency in individual transactions so that free market forces can assure fair pricing. And, most helpfully, certain risky behavior by federally insured banks is prohibited (the “Volcker Rule”).
The Dodd-Frank Act requirements are, as a whole, a great improvement over the current situation. However, the potential that the modern trading markets, even when operating without major defaults or non-transparent execution of transactions, exact a cost on the economy while benefitting financial institutions has not been meaningfully addressed. This is probably because the very concept runs counter to the conventional wisdom. In reality, regulation can improve the functioning of the market as well as protecting against catastrophic defaults and misleading pricing.
This and subsequent articles will demonstrate that the concept of efficient unregulated trading markets is fundamentally flawed. At its core, it is based on an incorrect measure of efficiency which leads analysts to look in the wrong places when measuring “frictions” embedded in market structures and behaviors. Efficiency is almost uniformly measured by referencing the cost of individual transactions. But the principal social value of financial markets is not to assure the lowest transaction costs for market participants. Rather, it is to facilitate the efficient deployment of funds held by investors (and entities that pool these funds) to productive uses. In other words, markets are efficient if the cost to the entity putting capital to work productively is as close as possible to the price demanded by the entity that seeks a return on its investment. All of the difference between the two is attributable to the plumbing that connects capital sources to capital uses, known as “intermediation.” The “economic rents2” extracted by intermediaries must be as low as possible to compensate them for performing the essential intermediation service if the system is to work efficiently.
Almost universally, this concept is lost in the discussion of financial markets. Efficiency is expressed in terms of the cost of a securities or derivatives transaction. This measures how well the markets work for traders. But it is only one element of the cost of intermediation between capital sources and uses. For reasons ranging from ideology to analytic sloth, the possibility that a market with low transaction costs can also be one in which intermediation costs are inefficiently high is ignored in public debate and academic analysis.
Properly measured, the financial markets have become less efficient in the era of deregulation even though advances in information technology and quantitative analysis should have caused the opposite result under the common understanding of the markets. It is evident that massive sums are extracted from the capital intermediation process causing the financial sector share of the economy to grow at the expense of the productive manufacturing and service sectors and public finance. This trend must be reversed if the US economy is to prosper and compete successfully in the world markets.
Several factors contribute to this result:
- Contrary to commonly held beliefs, advances in information technology and quantitative analysis have actually created asymmetries in information among trading market participants.3 While up-to-date information related to fundamental value (corporate financial reports, crop yields, government policies, etc.) is widely known today, these advances have been used by the more sophisticated and better-funded market participants to detect, analyze and often influence activities by other market participants, and, then, to exploit advantages derived from this market (i.e., non-fundamental) information. In addition, for the same reasons, complex instruments - primarily derivatives - are better understood by the financial institutions that market them than by their customers. As a result, the financial institutions charge far more value from the sale of these instruments than their customers realize. These two types of information advantages (and others) are systematically usedto increase economic rents extracted from the intermediation process.
- The abandonment of the Glass-Steagall Act (giving rise to multifunctional “universal” banks) as well as the elimination of several large banks during the financial crisis, led to dramatic consolidation in the financial service industry. The financial sector is now dominated by a small number of large banks that enjoy tremendous market power. Because of powerful shared interests in the structure and process of the markets, these banks act as an oligopoly. Concentrated market power allows the oligopoly to use its information advantages and massive capital to extract value from the intermediation process on a large scale. Dominant financial institutions systematically create market distortions (sometimes long-duration asset bubbles, but also price distortions for durations that exist only briefly) and then exploit those distortions.
- The growth of pooled investment vehicles, from pension funds to hedge funds to money market mutual funds and others, has changed the process of capital intermediation. Much of the money that historically funded bank deposits has migrated to those vehicles. The bank lending model for intermediation (depository banks moving funds held as customer savings into capital investments) has been largely replaced by a trading market intermediation model. In most cases, managers of pooled funds are judged by comparing transaction results with overall short–term market results rather than by long-term results. The driving goal is to “beat the market” rather than to produce long-term results. Since long-term results are not emphasized, efficient intermediation between capital sources and uses is less valued by investors.4 This obscures inefficiencies from both the investors and consumers of capital who could discipline the system to increase efficiency if performance were measured by giving greater consideration to long-term growth of value. It enables the extraction of value from the capital intermediation process by financial institutions.
The consequences of extraction of value from capital intermediation by the dominant financial institutions reach far beyond unfairness among market participants. It exacts wide-ranging costs that severely burden the economy. These burdens are listed below and discussed in detail in this and subsequent articles in the series.
- The costs of capital to productive consumers - in particular businesses and governments - are higher than they otherwise would be.
- The costs of producing consumer goods are therefore increased. Consumer consumption is burdened by these costs.
- Productive projects, such as manufacturing facilities and needed infrastructure, must overcome higher hurdles than they would if capital intermediation were more efficient. Therefore, the economy has less productive capacity than it otherwise would have.
- Fewer jobs are created as the productive potential and consumption capacity of the economy are diminished.
- The effectiveness of monetary policy in countering recessions is reduced. The Fed pumps money into the economy, but much of it is diverted to the financial sector before it can be deployed to productive uses.
- The beneficial self-correcting effect of supply and demand on operating decisions of companies is impeded. The use of derivatives, in particular, alters the incentives to expand or reduce production in response to price consequences of supply and demand relationships.
- The excessive diversion of wealth to the financial sector, together with the drag on availability of employment, increases income and wealth disparities in the economy.
In recent years, the financial sector share of aggregate GDP has been in the range of 8.3%, an increase from the historic level of 4.1%. By inferring that the historical increase in financial sector share of GDP is attributable to the value diverted from capital intermediation, the excessive wealth transfer to the financial sector is in the range of $635 billion per year. In terms of capital investment loss, one would apply a multiplier to the annual wealth transfer figure since recovery of the annual cost to the capital intermediation system would enable greater upfront investment by businesses and governments.
These market inefficiencies also increase the likelihood that financial crises, like the 2008 financial crisis, will recur. Exploitation of market distortions is the root cause of the most recent financial crisis. Market participants with enormous market power are incentivized to take excessive risks to reap short-term gain, often by generating asset or debt bubbles. Financial crises can be triggered by bursting price bubbles. If these root causes are not addressed by regulatory reforms, future financial crises are inevitable. After all, the banks themselves could have restrained their behavior prior to the crisis even if regulations did not. The lure of immediate profits from the exercise of market power was simply too strong to allow rational prudence to prevail.
Reform that focuses on the specific proximate causes of the financial crisis rather than its underlying causes will perpetuate a financial system in which wealth will continue to be extracted from the capital intermediation system so as to burden the economy and make it more likely that financial crises will recur.
Underpinning of the Great Deregulation Experiment
Commencing with Reagan’s election in 1980, the financial markets in the United States were totally transformed by three major developments - advances in quantitative measurement of dynamic market price movements and information technology, concentration of market power into a few large financial institutions and deregulation.
Fischer Black and Myron Scholes published their groundbreaking work on valuing options to purchase or sell assets (the “Black-Scholes Model”) just before the Reagan era began. The concept was further developed by Robert Merton. The model allowed participants in traded markets to value future price volatility, i.e., the range and frequency of upward and downward movements in prices, based on historic price behavior. Using this technique, the value of the dynamic marketplace itself, apart from the fundamental value of financial assets, could now be measured. This was a precondition to the changes of the last three decades, and was essential to the rapid emergence of the $60 trillion per year derivatives market, a market that did not even exist until the 1990’s.5
Advances in information technology allowed near-real time valuation of dynamic price movements using quantitative analytics like the Black-Scholes Model and deployment of capital at high speeds to exploit this capability. Previously, trading took place most often by telephone and was driven primarily by broad-based information relevant to macro-economic data and information relevant to the fundamental value of specific securities and commodities. Trading floors are now dominated by arrays of screens at every trader’s desk, most tied directly to trading venues enabling instantaneous execution of trades. Trading was transformed into an electronic business of massive volumes and complex strategies intended to profit from dynamic price movement rather than simple investment in assets based on their fundamental value.
But, critically important, the regulatory framework that had defined the markets since the New Deal was utterly dismantled to remove all impediments to the new trading business.
Commercial banking (taking deposits and making loans) had been separated from investment banking (in part, the business of trading in which the bank was put at risk, known as “proprietary” trading) since the adoption of the Glass-Steagall Act in 1933. Banks that took in deposits and made loans were prohibited from trading securities and commodities. Throughout the 1980’s and 1990’s, regulators repeatedly undermined the separation of commercial and investment banking. The law was finally repealed in 1999 by the Graham-Leach-Bliley Act. All banks could now trade for their own account and the race was on to accumulate vast stockpiles of financial assets to increase the market power generated by marrying-up trading with the huge resources of depository banks. It was now the era of the so-called “universal bank” that could both take deposits and make loans and trade the financial markets.
As repeal of Glass Steagall approached, investment banking began a period of dramatic consolidation. For example, Lehman Brothers did not achieve too-big-to-fail status (as it is now painfully clear it had) through internal growth. Its DNA included venerable firms such as Kuhn Loeb, Shearson, Hammill & Co. and EF Hutton. It was even owned by American Express for a time. The commercial banks got into the consolidation frenzy, as Citicorp acquired Salomon and Smith Barney and Credit Suisse acquired First Boston and Donaldson, Lufkin and Jenrette. Finally, during the crisis, Bear Stearns was scooped up by JP Morgan Chase (which earlier had acquired Hambrecht & Quist) and Bank of America absorbed Merrill Lynch, both with the direct involvement of the government. Morgan Stanley and Goldman Sachs converted to banks to steady themselves in the turmoil. Investment banks ceased to exist as a separate category of institutions.
During these 35 years, commercial banking consolidated as well. Consider the banks that were absorbed into JP Morgan: Chase Manhattan, Chemical, Manufacturers Hannover, First Chicago, National Bank of Detroit and BankOne.
The consolidation was widespread, resulting in a system of mega-banks, an oligopoly with vast market power.6 While there is no available comprehensive study of oligopoly behavior in the trading markets, subsequent articles will describe specific trading activities that are consistent with this behavior. And one need only consider the reports of the investigation into the manipulation of the London Inter-bank Offered Rate (“LIBOR”) as an example of this behavior.7
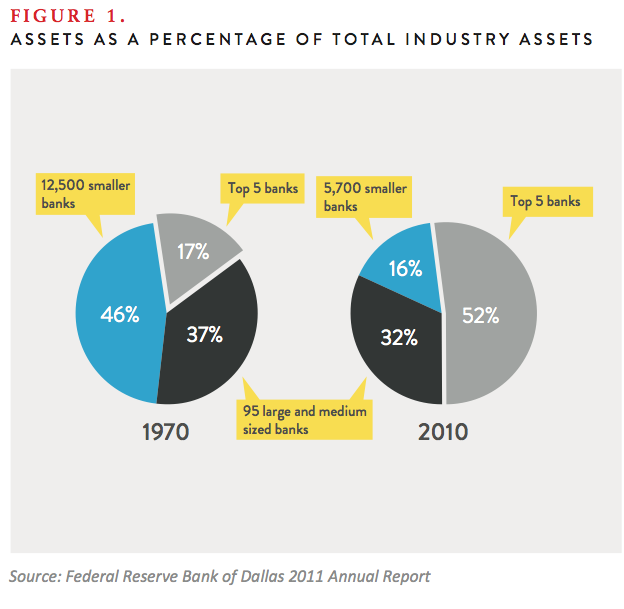
A recent research piece by the Dallas Fed provides a window on this process.8 The study observes that in 1970 the top 5 banks in terms of assets held 17% of aggregate bank assets. By 2010, the top 5 banks held 52% of aggregate assets, as shown in the following chart extracted from the report (See Figure 1).
In parallel, the newly created derivatives market was exempted from all meaningful regulation in the Commodity Futures Modernization Act of 2000. Derivatives, dubbed by Warren Buffet as “financial instruments of mass destruction,” were to be regulated by no agency and a massive and risky market came into being out of nowhere. The universal banks were handed an opportunity to dominate another trading market, one perfectly designed for their information and quantitative advantages. Currently, the four largest banks control 94% of the bank derivatives business in the US.9
In 2008, the system developed in this unregulated environment came within a hair’s breadth of complete and cataclysmic failure. Another Great Depression was avoided only because of government intervention at levels far beyond the TARP program.10 The Federal government put trillions of dollars at risk to support the international trading system (on top of TARP, which propped up weak bank balance sheets). Andrew Haldane, Bank of England Executive Director for Financial Stability, has estimated the ultimate, multi-year cost to the worldwide economy to be between $60 and $200 trillion.11 By comparison, worldwide GDP for the 12 months ending May 2011 was $65 trillion.12 To state the obvious, even if Haldane’s figure is off by a bit, the consequences have been grave.
The general run on the financial system that precipitated the financial crisis was not simply the fault of greedy bankers. The governmental representatives of the public’s interests were also culpable. The bankers got themselves into trouble, but the government created the environment that allowed it to happen.
As we shall see, deregulated markets are not the efficient machines that were envisioned thirty-five years ago. They bristle with inefficiencies that multiplied and grew in the absence of rules. These inefficiencies were exploited by the oligopolistic universal mega-banks wielding unprecedented market power. This created stresses on a financial system designed to facilitate massive, complex and uncontrolled (even by bank management) short-term trading rather than prudent safety and soundness. Bank balance sheets were damaged terribly when the home price bubble burst, but the structural failure of the system that interconnects the universal mega-banks is what threatened
total collapse.
Deregulation made financial crisis inevitable. The mortgage-backed securities meltdown was merely the triggering event.
Theoretical Foundation of the Great Experiment
Efficient Market Hypothesis
Why was deregulation thought to be a good idea? This experiment was founded on a theory: the “Efficient Market Hypothesis,”13 whose most famous devotee is Alan Greenspan. The hypothesis is based on the assumption that information in the modern world is widely and evenly distributed. If all market participants have equal information, inefficiencies and mispricing of assets and risks are best eliminated by removing constraints on self-interested transactions in the financial markets.14 Since all participants are equally motivated by greed, high transaction volume will quickly erase any price anomaly or inefficiency. Individual greed will be cancelled out by universal greed. Unrestrained volume should usher in an era of moderation and growth based on perfect price formation in the unconstrained markets.
Under the Efficient Market Hypothesis, no regulation is the best regulation. This is completely simpatico with the conservative ideology of the Reagan administration and its successors. Inevitably, it became the foundation of policy on financial regulation.
A corollary to the Efficient Market Hypothesis is the “Representative Agent Model.”15 If price anomalies and inefficiencies are instantaneously eradicated, individual motivations and quirks of market structures are irrelevant. The marketplace can be viewed as monolithic for purposes of analysis. Academic and other experts adopted this model and systematically deemphasized factors other than the common interest in optimizing market value. Having adopted the Representative Agent Model, academic research ignored the potential for a system dominated by the exploitation of distortions often created by individual agents.
History has not been kind to the Efficient Market Hypothesis. As Mr. Greenspan famously observed, the events of the financial crisis could not have existed under such a market cosmology.16 For example, the soon-to-be-toxic mortgage bonds that ignited the 2008 crisis were structured to reflect the value of residential real estate. It is now known for certain that many major players in the market foresaw the onrushing tsunami. The mortgage-backed bond prices should have reflected accurately the risk that residential real estate values might drop.
Instead the market was riddled with mis-information and conflicts of interest.17 Market participants did not act to preserve the integrity of the market as predicted by the hypothesis. They acted to maximize short-term profits (and their bonuses) until the music finally stopped, precipitating bankruptcy or bailout. Contrary to the Representative Agent Model, the pursuit of narrow interests determined outcomes. Market participants were not monolithic at all. Their actual behavior resembled the lifeboat evacuation of the Titanic, with similar inefficient consequences.
The conventional view is that the Efficient Market Hypothesis has been discredited. Despite the clear flaws in the theory, however, belief systems die hard. The Efficient Market Hypothesis still informs policy and academic analysis. Influential individuals cling to decades-old shibboleths and those who benefit from the theory continue to pitch their arguments using its terms.
Alternative Theoretical Approaches
The conceptual model that better fits with the events of the recent past is that of newly revered economist Hyman Minsky: “[O]nce we admit that institutions are man-made and at least in part the product of conscious decision, we must also face the effects of institutional arrangements on social results.”18 He cites proof “that almost all systems which are multidimensional, nonlinear, and time dependent are endogenously unstable.”19 In Minsky’s view, periods of market stability are destabilizing and markets are inescapably incoherent. Markets are not predictably efficient. They are similar to a fluid system influenced by multiple forces that are difficult to either predict or measure. For Minsky, the truth is closer to chaos theory than to the Efficient Market Hypothesis. A price can be formed in a market, but contemplation of its perfection is a
futile task.
Today’s markets are far more consistent with Minsky’s theories. While some information is broadly shared by market participants (the essential assumption of the Efficient Market Hypothesis), the ever-increasing speed and capacity of information technology assures that the more powerful market participants will always enjoy an information advantage. Especially in modern, high-speed markets, it is the perception of facts that is the driving force. Perceptions can be altered. Altered perceptions of current circumstances, even for small periods of time, can introduce tremendous distortions. For example, many high frequency traders (“HFTs”)20 transact electronically using algorithms designed to detect highly motivated buyers or sellers (called “whales”) and then create the perception that the market price is running away from the whale. The whale is effectively driven into a trap by the perception created by the high frequency trader in which the transaction price experienced by the whale is dictated by the HFT, not the broad market. (HFT is analyzed in detail in a subsequent article in this series.)
The “Great Deregulation Experiment” of the last 35 years allows us to examine what actually happens in the financial markets when all constraints are lifted in order to test these competing theories.
Performance of the Deregulated Markets
The core assertion of opponents of financial reform is that the public would be better off preserving the soaring profits of largely unconstrained financial markets. However, the premise that good-old days of the Great Deregulation Experiment were really “good” is far from evident.
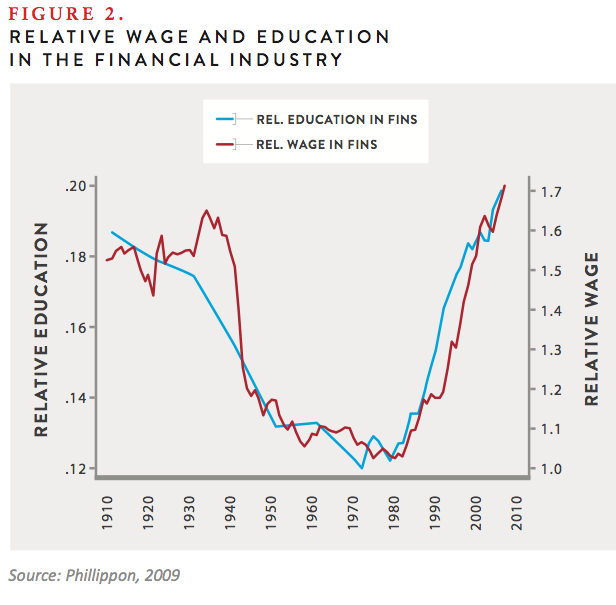
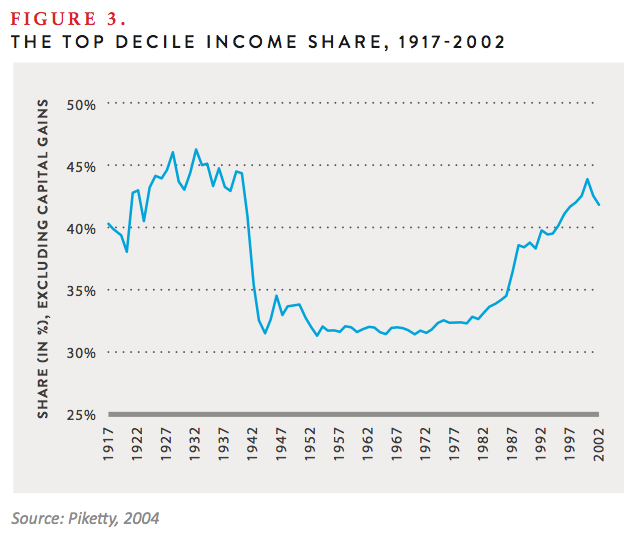
There is no doubt that financial sector profits soared during the Great Deregulation Experiment, along with executive bonuses (See Figure 2). In fact, compensation levels returned to pre- Great Depression heights as a direct result of deregulation.21 But the rest of the economy was not working very well by comparison. Income inequality spiraled out of control22 (See Figure 3). Wealth inequality, fueled by stagnating wages for most of the public and skyrocketing incomes of a small minority, became a fact of life. The similarity between income disparity and financial sector compensation as depicted in Figures 2 and 3 is inescapably clear. This raises several questions. Is income disparity causally related to compensation levels in the financial sector? Is the level of income in the financial sector a precursor of financial crises as incentives to take dangerous risks rises? Intuitively, the answer to both appears to be “yes.” The relationships may well be a fruitful subject for
further research.
Fundamental and ominous changes to the business cycle also emerged over the last 35 years, as recession-driven unemployment proved increasingly resistant to the medicine of corporate profits and GDP growth. In the last three recessions (1990-91, 2001 and 2007-2009), unemployment has persisted for periods following the resumption of economic growth that have been much longer than in prior recessions. Between the Second World War and 1990, employment rates recovered fully within eight months of the trough of each recession. In the 1990/91 recession, the recovery period was 23 months, and in 2001 the period was 38 months. The employment recovery period for the recent recession, assuming recovery occurs, is unknown but far longer.23 In short, the effect of a recession on employment has gotten progressively worse.24
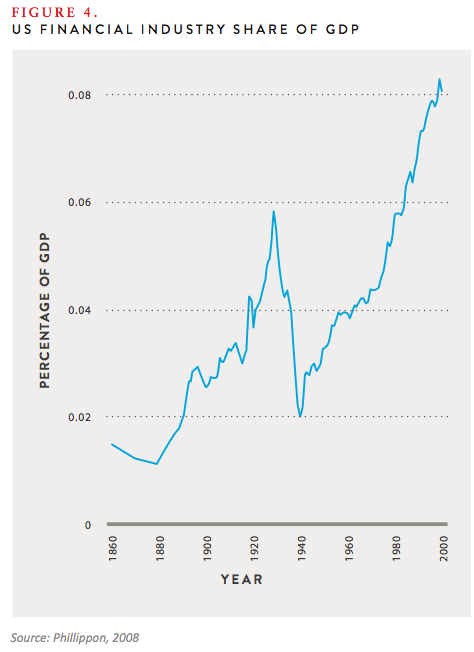
During this period, the financial sector share of the economy has increased to unprecedented levels, growing from 3.8% to 8.2% of the GDP,25 while the manufacturing and services sectors have become relatively smaller (See Figure 4).
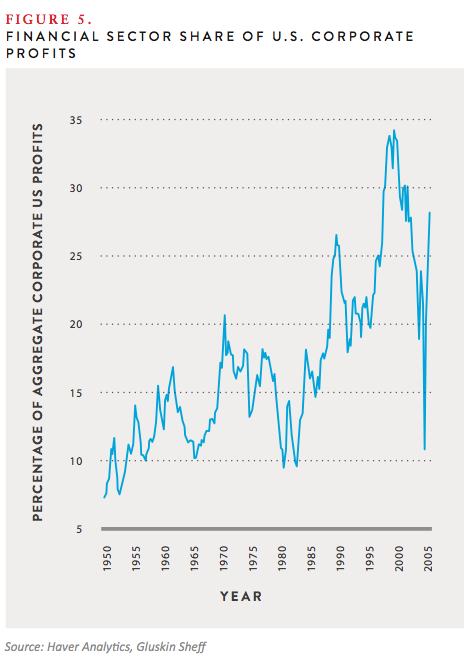
Perhaps more telling is the financial sector share of profits in the entire economy. The chart below, prepared by Yardeni Research, tracks 60 years of data on financial sector profits, illustrating that profit share has ranged from 8 to 34% (See Figure 5).26 In the period following the financial crisis, financial sector share of profits returned to the greater-than-the-30% level.27
This growth of the financial sector was not because of increased demand for financial services, which only grew by 4% in the last decade.28 It is also clear that this cannot be explained as an outgrowth of the value of exporting financial services by US institutions.29 The explanation lies in the structure of the domestic financial system.
The relative growth of the financial sector is not necessarily a problem if the services provided by the sector provide commensurate value to the overall economy. But if it does not cause the whole pie to grow, value is simply reallocated to the beneficial owners of financial firms. This drains resources that could be put to uses that would increase the productivity of the overall economy and the public’s wealth. It has been demonstrated that the connection between financial sector growth and the growth of the productive manufacturing and service sectors is at best tenuous.30 It might benefit the owners of financial firms (and bonus recipients), but to the extent that it only transfers wealth, it does not benefit the broad economy. The only way to assess this is to value the performance of the financial sector in executing its most basic task: providing efficient intermediation between sources of capital investment and productive consumers of capital investment.
Social Value of the Financial Sector
Aside from insurance (risk transfer) and payment systems, the essential service of the financial sector is capital intermediation.31 Sources of capital (funds that need to be “put to work,” such as savings and pension funds) must be matched up with users of capital who are financing productive activities. The matching systems must be efficient in terms of fundamental capital cost and the cost of intermediation. The price paid for intermediation must be rationally related to the service provided. In terms used by economists, the economic rent extracted for capital intermediation must be optimally small.
Intermediation can be effectively provided by traditional commercial banking or by traded markets.32
Commercial banks loan from available capital and, most importantly, from funds held as individual and corporate customer deposits. In this business, the mismatches between sources of capital and its uses are covered by the capital reserves of the banks. These mismatches include the following:
- Credit differentials in the form of loan defaults – If a bank loses money on a loan, it still has to make good on obligations incurred to fund the loan, either deposits by customers when they withdraw their funds or borrowings from other banks when they must be repaid; and
- Term mismatches – If a bank makes a long-term loan (such as 20-year, fixed rate mortgages) from money received as a demand deposit, it has to be able to honor a demand for withdrawal from a deposit account even though the loan has not been repaid. The same principle applies to long-term loans funded by short-term inter-bank borrowing that must be repaid (if not rolled over), even if the loan proceeds are still tied up in a loan.
Banks raise capital to cover mismatches: capital absorbs losses from defaults but also liquidity losses from (a) cash demands from deposit withdrawals and (b) reduced access to short-term bank borrowings. As an outgrowth of the two financial crises of the 20th century, this business model was reinforced by creation of the Federal Reserve System (in response to the 1907 Panic) and FDIC insurance (in response to the Great Depression). FDIC insurance reduced the risk that panicked depositors would make a run on the banks. And the Fed was empowered to provide short-term funding that could replace short-term inter-bank financing if needed because of an inter-bank bank run. Thus the risk of liquidity defaults based on bank runs by depositors and/or lending banks was mitigated.
Alternatively, the traded markets can provide intermediation: capital suppliers invest in securities (often pooling resources, for example in mutual funds); capital consumers issue securities to procure funding; and both contract with banks for derivatives. Financial institutions intermediate the process. They provide the trading capital needed to make sure that “supply and demand” of securities (ultimately provided by capital suppliers and consumers, respectively) is in equilibrium in terms of timing. Derivatives, in theory, mitigate the risk of mismatches between capital sources and uses (based on durations, creditworthiness and
currency differentials).
For devotees of the Efficient Market Hypothesis, the capital market is the preferred venue for intermediation. Superficially, it is the perfect environment for the use of information technology and sophisticated algorithmic trading strategies that should squeeze out even miniscule pricing inefficiencies. As an intermediation tool, capital markets are like a super computer compared with the “abacus” of the commercial bank model, or so the Efficient Market Hypothesis would suggest.
The evolution of the financial system during the period of deregulation has reflected this preference, with commercial bank intermediation declining and capital markets intermediation increasing. The bank share of all financial assets fell from 50% in the 1950’s to below 25% in the 1990’s.33 The pace of this shift increased with the growth of money market funds, pension funds and mutual funds (providing direct investment that replaced bank lending) and securitization of consumer debt over the last thirty-five years.34 Banks hold fewer loans. They are held by investors, mostly pools of funds that have displaced bank deposit accounts as the recipients of savings.
This time period is characterized by far greater ability to deploy vast sums of cash to exploit tiny market anomalies, identified in “real time,” using technology informed by sophisticated analytics. Conventional views of the markets, represented by the Efficient Market Hypothesis, would predict that the price received by providers of capital and the price received by consumers of capital must have narrowed proportionately. In other words, the cost of intermediation paid by the economy as a whole should have plummeted as ever more powerful efficiencies were deployed.
But the Great Deregulation Experiment revealed that this did not occur.
Findings from the Great Experiment
In recent months, volumes have been filled with complaints that proposed regulation of banks, dealers and other major participants in the financial markets under the Dodd-Frank Act of 2010 imposes undue burdens. The financial sector is resistant to change and it relies on the argument that increased costs from burdensome regulation will harm the economy. Implicit in the structure of industry’s reasoning, is that the pre-Dodd-Frank deregulated market was optimally efficient, consistent with the Efficient Market Hypothesis.
However, a growing body of academic study disagrees. It supports the proposition that high levels of unregulated trading activity actually impair financial markets efficiency in performing its core social purpose—efficiently deploying available capital to productive business, government and personal uses. In effect, many academics have gathered the data from the Great Deregulation Experiment and evaluated it. When read as a whole, the results appear to disprove the theory underlying the experiment.
A groundbreaking study of intermediation costs by Thomas Philippon of New York University’s Stern School of Management reaches dramatic conclusions.35 Professor Philippon used the neoclassical growth model (which focuses primarily on productivity, capital accumulation and technological advances) to examine financial intermediation in the United States over a 140-year period. He constructed an index that measures the unit cost of financial intermediation. His work indicates that the finance industry has become less efficient in providing intermediation services over time. He summarizes his findings as follows:
[T]he finance cost index has been trending upward, especially since the 1970s. This is counter-intuitive. If anything, the technological development of the past 40 years (IT in particular) should have disproportionately increased efficiency in the finance industry. How is it possible for today’s finance industry not to be significantly more efficient than the finance industry of John Pierpont Morgan? I conclude from [the historic trends] that there is a puzzle…
Finance has obviously benefited from the IT revolution and this has certainly lowered the cost of retail finance. Yet, even accounting for all the financial assets created in the US, the cost of intermediation appears to have increased. So why is the non-financial sector transferring so much income to the financial sector? Mechanically, the reason is an enormous increase in trading.
The study indicates that the cost of intermediation between the suppliers of capital and the productive consumers of capital has increased notwithstanding technology advances, sophisticated quantitative analysis, massive trading volume increases and diversity in securities and derivatives markets. This is illustrated by Table 12 from his study, reproduced below (See Figure 6).
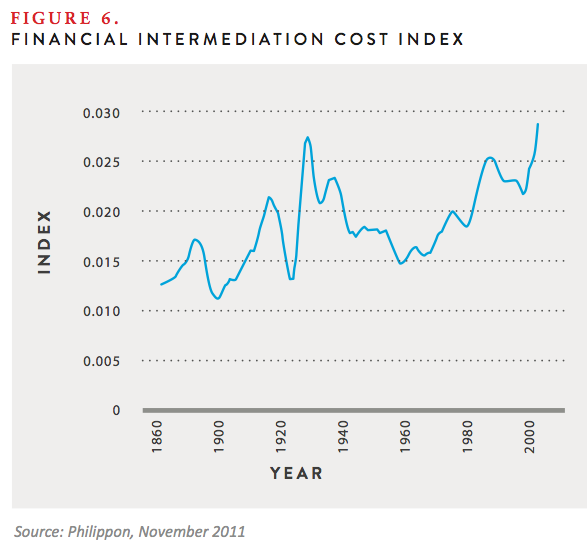
Figure 6 shows that the only time over 140-year period that the Financial Intermediation Cost Index was comparable to the period of deregulation was the Great Depression. High costs of intermediation make sense in the Great Depression when intermediation virtually ceased to exist – there was even a “bank holiday” for a period. But in the deregulation period, banks were profitable. Reasoning under the tenets of the Efficient Market Hypothesis, the professor correctly concludes that this is absolutely counter-intuitive. But from the perspective of an observer of trading behavior and market evolution, his results make perfect sense.
A cogent explanation, well beyond Professor Philippon’s reference to “an enormous increase in trading,” is critically important. The increase in the cost of intermediation as illustrated by Figure 6 is a threat to US productivity on several levels.
First of all, the productive manufacturing and service sectors have been increasingly short-changed. An increasing share of the available capital is being devoted to trading activity that extracts value from the financial markets rather than facilitating investment in productive assets and businesses. This is a burden on the growth of the manufacturing and service sectors since the costs of raising capital have increased beyond levels that are necessary. Goods and services are more expensive and productive activities are foregone because their costs cannot be justified. Employment opportunities are restricted and consumption is burdened.
And, in down cycles, money pumped into the system increasingly fuels value-extracting trading rather than recovery from high unemployment in the typical business cycle. Fed policy during a recession is designed to make cheap funds available so that productive assets will be acquired or put back into service and jobs will be created anew. To the extent Fed policy is frustrated by non-productive diversions from capital flows to the financial sector, the power of monetary policy to fight recessions is diminished. This explanation appears to fit the actual experience of recent recessions characterized by increasingly long periods of employment recovery.
Professor Philippon’s work, in the context of recent history, leads to a new way of thinking about the financial markets. Contrary to the Efficient Market Hypothesis, increased volume of trading activity is not a universal good. There is no doubt that a portion of trading volume by purely financial market participants facilitates the efficient intermediation of capital transfers between suppliers and productive users. But this is a superficial observation, at best. Incremental trading volume (assuming that it is not based on manipulative trading tactics) can decrease individual transaction costs. The cost of an individual trade is measured by the profit a counterparty can earn by immediately reversing the transaction in the market. A bank might buy a share of stock from a seller knowing that there is a readily available sale price that is higher. The seller is using the bank as an access point to the market and accepts the price it receives, which is lower than the going purchase price in the market, because the bank provides access. The bank’s fee for this service, and the cost to the seller, is the bank’s available resale price. The bank is providing “liquidity” for a “fee.” The greater the volume of liquidity providers that are available to a market participant wishing to transact, the lower is the fee as liquidity providers compete for the business.
But this function of greater liquidity – i.e., reduction of transaction costs - only achieves a socially beneficial purpose to the extent the financing cost to capital consumers is very close to the price needed to induce suppliers to part with their funds. In other words, society benefits only if the value of reduced costs of individual transactions resulting from trading activity by liquidity providers more than offsets other costs imposed on the capital raising system by that trading activity. Socially beneficial trading activity bridges the gap between the specific needs of capital consumers and capital suppliers in terms of timing and the supply and demand mismatches, all for a “fee” that is determined competitively and efficiently, taking into consideration all costs and benefits. This type of intermediation constitutes socially valuable “liquidity,” in the jargon of the markets.
By definition, incremental trading activity that does not meet this test is not socially beneficial.
Valuation of the Financial Market Structure: A New Approach
If asked to describe the role of a financial market structure, a trading professional will virtually always say that it is to facilitate “liquidity” so that transactions can be accomplished efficiently and at a low cost. This makes sense because the compensation of traders and fund managers is related to transaction costs.
Properly used, efficient “liquidity” for a given transaction refers to market conditions needed so that initiation of the transaction will not, by itself, alter the best available transaction price. If, for example, a large number of willing buyers are active in a market, a seller is more likely to receive the highest going price for a sale he or she posts to the marketplace seeking a bid. In this circumstance, the buying interest in the market is so large that the transaction is unlikely to exceed the level of willing buyers at the best available price. There is depth in the buying interest at the best going price that is sufficient to absorb the sale.
It is generally assumed that a large number of transactions taking place in a market means that transaction liquidity will be high and the seller is more likely to receive the price most recently bid to other sellers when his or her posted offer to sell is matched with a buyer. This assumes that high volume “information” traders, those whose strategy is enter and exit the market quickly to take advantage of information advantages, are consistently willing to transact at the going market prices, i.e., to provide liquidity. But the reality is that most of this volume is traded by computers driven by algorithms that can switch the activity to liquidity consumption instantaneously. As will be discussed in a later article, this occurs frequently each day and is tremendously disruptive. Therefore, volume is a poor indicator
of liquidity.
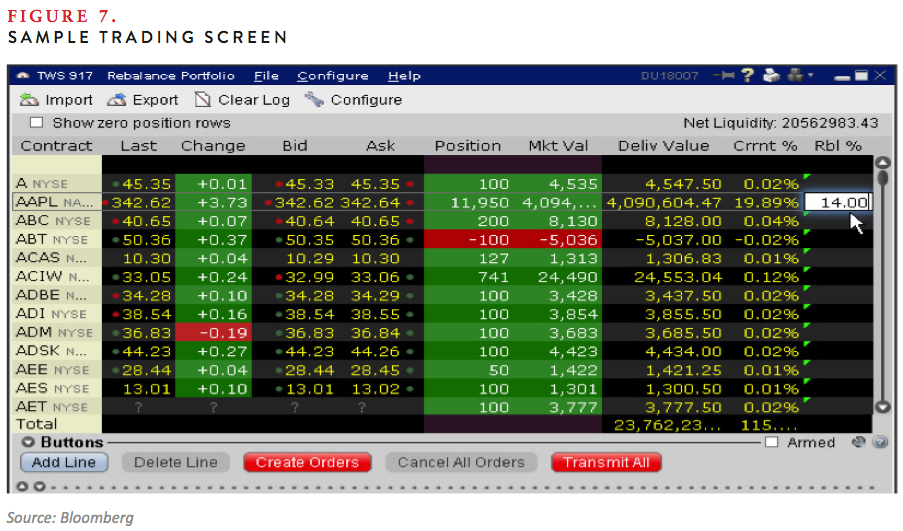
A bid/ask spread describes the price range between actual recent transaction proposals, both to buy and to sell, in a marketplace (See Figure 7). There is reasonable certainty that some amount of securities can be sold at the bid price and that some amount can be purchased at the ask price, assuming that quantities do not exceed posted bid or ask quantity limits. Narrow bid/ask spreads indicate that transaction costs will be low. But, for the quoted bid/ask spread to be a reliable indication of transaction cost, there must be sufficient depth at the bid price and the ask price to absorb proposed transactions. In a subsequent article, we will explore trading activity designed to subvert current bid/ask spreads rendering them unreliable, causing high volume but unreliable liquidity. This is a characteristic of computer-driven high-frequency trading using aggressive tactics.
Bid/ask spreads are thought to be narrower in highly liquid markets, meaning that transaction costs are low. Competition is greater. And resale/repurchase is more reliably accomplished if the trader wishes to do so at a subsequent time, which has a significant value independent of fundamental value considerations and a component of the price paid or received at the execution of the transaction.
Recent studies have undertaken to describe the effect of changing liquidity levels on bid/ask spreads, but this is an extremely complex relationship.36 It is certain that the relationship between volume and bid/ask spreads is far from linear. It is also clear that factors specific to the security or derivative being traded (for example, the credit quality of individual corporate bonds) have a substantial effect on the relationship. However, all of this measures the instantaneous price effect of liquidity on individual transactions by examining quoted bid/ask spreads. The term “Transaction Liquidity” will refer to the trading volume that narrows the spread between the bid and ask prices, thereby reducing transaction costs.37
When, as described above, a trading professional says that a market structure performs well if it facilitates liquidity to enable trading, he or she is referring to Transaction Liquidity.
There is another way to think about liquidity. It focuses on the amount and type of market activity that assures that the spread between the price received by capital suppliers and the cost paid by capital raisers is as low as possible. It is different from Transaction Liquidity, which drives but a single component of the cost of capital intermediation. This broader liquidity describes how well a trading market is executing its intermediation (contrasted with its individual trade facilitation) function. As used in this and subsequent articles, the term “Capital Liquidity” refers to the trading activity that increases the overall efficiency of intermediation.
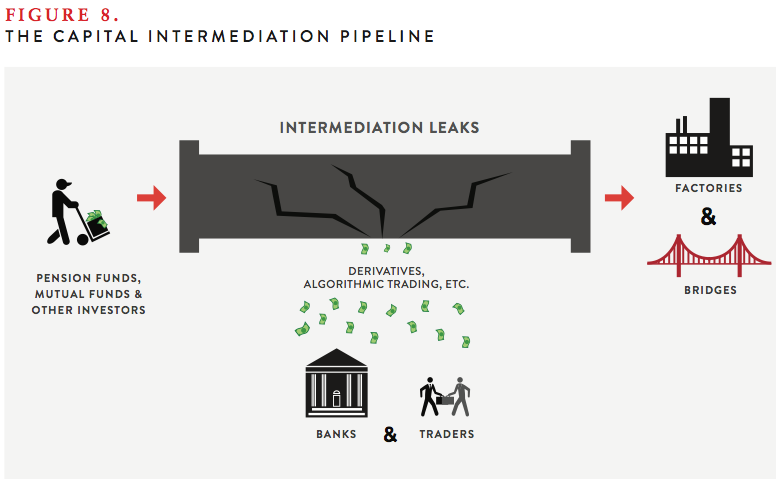
During any observation period, the price paid by capital consumers (e.g., companies financing the basic needs of their businesses) should be greater than the price received by capital investors (e.g., institutional investors). Traders must be compensated for intermediation, after all. If this spread (i.e., the economic rent extracted for capital intermediation) is as low as it can be, the amount of Capital Liquidity is optimal and intermediation is efficient. The Philippon 11/2011 study tells us that Capital Liquidity is not optimal in the current market (See Figure 8). If it were, the cost of intermediation would be going down as operational efficiencies increase.
It is theoretically possible that market activity could be below levels needed for optimal Capital Liquidity. In this case, intermediation costs would be high because of low supply of intermediation capacity. That is what occurred in the Great Depression. The enormous volumes of transactions in recent years and narrowing bid/ask spreads suggest that this is rarely, if ever, the case today. It stands to reason that if intermediation is inefficient, it must be because trading volume is greater than or different from the volume needed to achieve optimal Capital Liquidity. The trading volume that causes Capital Liquidity to be suboptimal is dysfunctional from a Capital Liquidity perspective.
The Philippon 11/2011 study suggests explicitly that volume representing Trading Liquidity exceeds optimal Capital Liquidity and that this excess exacts a cost on the intermediation process that is greater than the value of the narrowing of transaction bid/ask spreads. In other words, the excess trading volume reduces individual transaction cost at a market-determined price, but increases the overall cost of the intermediation process. As we shall see in subsequent articles, types of trading activity, as well as sheer volume, can also cause Capital Liquidity to be sub-optimal.
In fact, assuming (a) that the Philippon 11/2011 accurately measures intermediation costs, (b) that trading volumes exceed levels needed for optimal Capital Liquidity and (c) that IT advances and sophisticated quantitative analysis have lowered bid/ask spreads, this conclusion is almost inescapable. Since the cost of individual transactions has dropped, something relating to the number and type of transactions is the only conceivable cause of increased intermediation cost.
This dysfunctional volume (in terms of Capital Liquidity) constitutes intermediation that, on balance, extracts more value from the capital allocation process than the value it provides to suppliers and consumers of capital.38 It may reduce the cost of individual transactions by narrowing bid/ask spreads (although this is not necessarily true, as the discussion of the “Flash Crash” in a subsequent article illustrates). However, this dysfunctional trading volume also represents leaks in the plumbing that transports capital from investors to productive businesses and individuals (See Figure 8).
Because the cost of capital intermediation has increased dramatically in the last three decades despite IT and analytical advances, deregulation seems to have increased the number of leaks. The leaks are caused by financial institutions tapping into the pipeline to siphon off economic rent. Specific types of transactions and the ways they are used to tap into the intermediation pipeline are discussed in subsequent articles. If regulation plugs these leaks, it is not burdensome but beneficial, at least as measured by benefit to the public.
There is one essential element of the market-based intermediation system that deserves special attention. In the commercial bank intermediation model, the capital of the banks is a reserve against mismatches, such as fixed rate loans being funded with floating rate deposits. In the trading market-based model, derivatives theoretically serve this purpose, reconciling mismatches. Derivatives are therefore used as a replacement for capital reserves against losses that are a consequence of mismatches. A subsequent article will discuss in detail the problems raised by using derivatives in this way. In general, the cost of derivatives can be exceedingly high and are often unknown to the companies that use them. Even worse, new studies indicate that in many cases the cost is unknowable. As we shall see, derivatives are substitutes for capital reserves and, in aggregate, constitute a major leak in the plumbing. As a substitute for capital, they can be seen as the equivalent of the securities issued to fund capital reserves. These securities would be a part of the traded market if funded reserves were used instead of derivatives. For our purposes, derivatives trading is the same as trading that represents dysfunctional volume.
The Costs of the Leaks
The rise of certain types of trading volume in securities and derivatives, both designed to extract value from the intermediation process, constitutes a transfer of wealth to the financial sector, away from the other business sectors of the economy. It is like a tax that transfers wealth for no productive purpose. And this tax is very large. We might assume that the GDP share of the financial sector is 50% higher than it would be if no extraction occurred, as indicated by the available data. This would return the financial sector share GDP to levels experienced before the Great Deregulation Experiment began (See Figure 3). In this case, the “tax” is running at $635 billion per year, almost 20% of the Federal budget and 45% of the budget deficit.39
This is admittedly a blunt measure. We know from the Philippon 11/2011 study that the cost extracted by the financial sector from intermediation grew substantially. But, factors other than value extraction could well have caused the financial sector to grow faster than the rest of the economy during the Great Deregulation Experiment. Profits from consumer credit, in particular from credit cards, could have contributed to the phenomenon. However, it is difficult to see how these would change the results materially. Revolving consumer credit, which includes credit card debt is about $855 billion,40 so incremental value extraction is unlikely to alter the basic result. On the other hand, the calculation uses the share of the economy in the pre-1980 period as a baseline for comparison. However, the share should have shrunk since 1980: IT advances must have reduced financial sector operating costs more than virtually any other sector. Until a more precise measure is defined, the cost estimate above is reasonable.
Even worse, deregulation may well be an unsustainable system. To the extent the extraction of value from the intermediation process reduces the potential productivity of other sectors of the economy, the extraction can be seen as an exploitation of a depleting resource. Diversion of value from the flows that fuel productive capacity cannot last indefinitely. This suggests that the United States is evolving in the direction of an extraction economy, diminishing its historic self-renewing characteristics. Instead of extracting a limited natural resource, the United States economy is depleting its productive capacity.
Conclusion
When the financial crisis exploded with its full force in 2008, the US government provided capital to weak banks and its intervention to save the system from calamitous shutdown was massively larger. All financial institutions, even those that did not require direct subsidy, were saved from ruin.
The system that came so close to failure was a product of more than three decades of deregulation. Its failure in 2008 disproved the widely held belief that financial markets would be supremely efficient, self-correcting and self-healing engines of capital allocation if they were allowed to operate with only minimal constraints. But the systemic failure was a manifestation of a financial system in which vast sums were systematically extracted by the financial sector from the rest of the economy without commensurate return of productive value.
Assertions that the markets became more efficient during deregulation, that persist to this day, are largely based on analysis that does not measure the meaningful value of a financial market structure. Markets should be evaluated by the efficiency of capital raising by productive users of capital. The cost of individual transaction (or trades) is relevant to measuring the quality of a market structure, but incomplete. Transaction costs are often (but, as we shall see later, not always) reduced by trading volume, but incremental trading volume can add costs that far exceed further reduced transaction costs.
Evidence strongly suggests that the cost of capital intermediation – the cost of a productive user of capital to secure investment from capital sources – has increased in recent decades, a period in which it should have fallen significantly because of IT and quantitative advances. The only possible cause of this is that incremental transaction volume, enabled by deregulation, has exacted costs on capital raising for the productive economy.
These observations provide profound insights that can be expressed as a new theory of market regulation. In this way of thinking, regulation is essential to the efficient functioning of financial markets, properly measured. This efficiency not only improves performance of the economy as measured by productivity and income parity, but also reduces the risk of financial crisis that is an outgrowth of the distortions and price anomalies in the markets that continuously fuel inefficiencies
ENDNOTES
- Fundamental value refers to the intrinsic value of a stock, bond or derivative based on available information. In the context of a share of stock: “Fundamental analysis entails the use of information in current and past financial statements, in conjunction with industry and macroeconomic data to arrive at a firm’s intrinsic value.” Kothari, S., “Capital Markets Research in Accounting,” Massachusetts Institute of Technology – Sloan School of Management, March 2001 available at http://papers.ssrn.com/sol3/papers.cfm?abstract_id=235798.
- A measure of market power, economic rent is the value in excess of marginal costs extracted by market participants. See, The Economists, “A to Z Terms,” Definition of Rent, available at http://www.economist.com/economics-a-to-z/r#node-21529784.
- This information asymmetry discussed in this article is very different from the fundamental information inefficiencies addressed in a number of studies that examine the differing motivations of market participants. Excellent analysis of such fundamental information inefficiencies can be found in Stout, L., “Inefficient Markets and the New Finance,” May 2005, available at http://papers.ssrn.com/sol3/papers.cfm?abstract_id=729224; and Hirshleifer, D. A., “Investor Psychology and Asset Pricing,” 2001, Journal of Finance, 56:4, 1533-1597 available at http://papers.ssrn.com/sol3/papers.cfm?abstract_id=265132.
- Greenwood, R. and Scharfstein, D., “The Growth of Modern Finance,” July 2012, available at http://papers.ssrn.com/sol3/papers.cfm?abstract_id=2162179.
- Derivatives are contracts that obligate payment of cash based on asset market price movements. The advent of derivatives allowed traders to detach price movement risk from assets and the Black-Scholes Model allowed the resulting instruments to be valued.
- An analysis of the post Glass-Steagall oligopolistic behavior of banks in the debt and equity markets can be found in Guriev, S. and Kvassov, D., “Imperfect Competition on Financial Markets and Capital Structure,” August 2007, available at http://papers.ssrn.com/sol3/papers.cfm?abstract_id=603721.
- Albegotti, R. and Eaglesham, J., “9 More Banks Subpoenaed Over Libor,” Wall Street Journal, October 25, 2012, available at http://online.wsj.com/article/SB10001424052970203897404578079413742864842.html. The breadth of the investigation suggests that many large institutions were aware of the practice and simply joined in to secure their share of the profits, a concerted action by the large universal banks to manipulate a system affecting a broad swath of the public.
- Federal Reserve Bank of Dallas, 2011 Annual Report, Choosing the Road to Prosperity, available at http://www.dallasfed.org/fed/annual/index.cfm.
- Office of the Comptroller of the Currency, “Quarterly Report on Bank Trading and Derivatives Activities – First Quarter 2012,” available at http://occ.gov/topics/capital-markets/financial-markets/trading/derivatives/derivatives-quarterly-report.html.
- Board of Governors of the Federal Reserve System, Office of Inspector General, “The Federal Reserve’s Section 13(3) Lending Facilities to Support Overall Market Liquidity: Function, Status, and Risk Management,” November 2010.
- Paul Hannon, “Economic Hit from Crisis: A very Big Number,” Wall Street Journal, March 30, 2010; text of speech available at www.bankofengland.co.uk/publications/speeches/.../speech433.pdf.
- “In Search of Growth, The Economist, May 25, 2011, available at http://www.economist.com/blogs/dailychart/2011/05/world_gdp.
- Originally articulated by University of Chicago economist Eugene Fama in “Efficient Capital Markets: A review of Theory and Empirical Work,” Journal of Finance, Vol. 25, No. 2, May 1970.
- Burton G. Malkiel, “The Efficient Market Hypothesis and Its Critics,” Princeton University CEPS Working Paper No. 91, April 2003.
- Raghuram Rajan, “Fault Lines,” 2010, Princeton University Press, page 116.
- Bryan Knowlton and Michael Grynbaum, “Greenspan ‘Shocked’ that Markets are Flawed,” New York Times, October 23, 2008 available at http://www.nytimes.com/2008/10/23/business/worldbusiness/23iht-gspan.4.17206624.html.
- United States Senate, Permanent Subcommittee on Investigations, Committee on Homeland Security and Governmental Affairs, Majority and Minority Staff Report, “Wall Street and the Financial Crisis: Anatomy of a Financial Collapse,” April 2011.
- Hyman Minsky, “Stabilizing an Unstable Economy,” McGraw-Hill, 2008, p. 9.
- Id., page 11 footnote 9.
- “HFT refers to fully automated trading strategies with very high trading volume and extremely short holding periods ranging from milliseconds to minutes and possibly hours.” Zhang, F., “High Frequency Trading, Stock Volatility, and Price Discovery,” December 2010, available at http://papers.ssrn.com/sol3/papers.cfm?abstract_id=1691679.
- Philippon, T. and Reshif, A., “Wages and Human Capital in the U.S. Financial Sector: 1909-2006,” December 2008, available at http://www.nber.org/papers/w14644.
- Pikkety, T. and Saez, E, “Income Inequality in the United States, 1913-1998 (Series Updated to 2000)”, September 2001, available at http://papers.ssrn.com/sol3/papers.cfm?abstract_id=282693.
- The period has already exceeded 38 months. National Bureau of Economic Research, “Business Cycle Expansions and Contractions” available at http://www.nber.org/cycles.html.
- Raghuram Rajan, “Fault Lines,” 2010, Princeton University Press, pages 84-89.
- Thomas Philippon, “The Future of the Financial Sector,” New York University, October 2008, available at http://sternfinance.blogspot.com/2008/10/future-of-financial-industry-thomas.html.
- Yardeni Research, Inc., “Products, Productivity, Prosperity,” March 7, 2012.
- http://blogs.reuters.com/felix-salmon/2011/03/30/chart-of-the-day-us-financial-profits/.
- Thomas Philippon, “The Evolution of the Us Financial Industry from 1860 to 2007: Theory and Evidence,” November 2008, available at http://pages.stern.nyu.edu/~tphilipp/papers/finsiz.pdf.
- Id.
- Baumol, W. J., “Macroeconomics of Unbalanced Growth: The Anatomy of the Urban Crisis,” 1967, American Economic Review, 57, 415—426.
- Thomas Philippon, “The Size of the US Finance Industry: A Puzzle,” November 2011.
- Ross Levine, “Bank-Based or Market Based Financial Systems: Which is Better?” William Davidson Institute Working Paper 442, February 2002.
- Minsky, introduction at page xxii.
- Simon Johnson and James Kwak, “Thirteen Bankers,” Pantheon Books, 2012, page 84.
- Thomas Philippon, “Has the U.S. Finance Industry Become Less Efficient?” November 2011. (Hereinafter cited as “Philippon 11/2011”)
- Jens Dick-Nielsen, Peter Feldhutter, and David Lando, “Corporate Bond Liquidity Before and after the Onset of the Subprime Crisis,” May 31, 2011, available at http://papers.ssrn.com/sol3/papers.cfm?abstract_id=1364635.
- Many securities and derivatives trade without market-based bid/ask spreads. However, the counterparty is typically a sophisticated financial institution that prices the instrument, often on a disaggregated basis and often based on modeled bid/ask spreads based on price correlated liquid instruments. Leaving aside the prudency of engaging in such a business, the underlying principles are the same. The bid/ask spread is simply estimated rather than discovered by reference to price quotes.
- Excess volume is different from “excess liquidity” which refers to availability of cheap money, as a result of accommodative monetary policy. See Ruffa, R., and Stracca, L., ”What is Global Excess Liquidity and does it Matter?” November 2006, available at http://ssrn.com/abstract_id=942737. Excess liquidity can induce greater trading volumes, however.
- The number was derived by using the average share of GDP represented by the financial sector during the years from 1960-1970 as the baseline. This baseline is conservative since the cost of capital intermediation should have been reduced by IT and quantitative advances in the last 35 years. The baseline was compared with the current share of GDP represented by the financial sector. The excess of the current share over the baseline share was then applied to total GDP. The result is $635 billion for the most recent annual GDP data.
- Federal Reserve Bank of Philadelphia, “Consumer Credit and Payment Statistics,” November 4, 2012, available at http://www.philadelphiafed.org/consumer-credit-and-payments/statistics/.