In the past several years, the movement for tuition-free, debt-free, or otherwise affordable college has swept the country. As of 2018, 16 states and dozens of cities have launched “Promise Programs,” initiatives that in most cases cover tuition and fees for students, primarily at community colleges.1 These programs are operating within a national debate about the role of the federal government, states, and institutions in guaranteeing that all American citizens have access to affordable, high-quality postsecondary education, regardless of their race or family wealth.
A promise of “free” or “debt-free” college is galvanizing, but it can take many forms and include any number of policy mechanisms. It can be guaranteed for only certain students, certain majors, or certain institutions. It can include only tuition, or it can consider non-tuition costs as well. It can come with an asterisk noting what students must do after they leave school, or it can include requirements that provide subsidy toward only “high-performing students.” At a time in which some state budgets have still not recovered fully from the Great Recession, states may decide to ration these programs in one way or another. Without discussion of which components would make a program more regressive, less inclusive, or less impactful, states run the risk of fulfilling the promise of affordable college for only a small subset of students.
This policy blueprint seeks to inform this exciting debate by bringing new data on the urgency of the student debt crisis, particularly for borrowers of color, while outlining the policy mechanisms that are often considered in Promise Programs and free college proposals, and determining which are most important in creating an equitable guarantee for students. Finally, we share recommendations from a series of focus groups, message testing, and a national poll conducted by Lake Research on the best ways to talk about the issue, and the necessity and benefits of boldness.
Investing in Higher Education Lifts Us All
Americans—across race, gender, economic circumstances, and political affiliation—believe that higher education and working hard can transform lives and put dreams within reach. We take pride in historic investments in our nation’s system of colleges, universities, and trade schools. Indeed, the pathway to basic financial security runs most frequently through some form of postsecondary education. However, the persistence of this belief has not been rewarded by our nation’s political class, which has consistently neglected or disinvested from the very avenues of opportunity that could help everyone get ahead. Instead of public investment to ensure access for all who work hard to pursue it, higher education now comes with a gargantuan price tag and seemingly inevitable debt. As it becomes increasingly necessary to fulfilling one’s dreams, postsecondary education has also grown into an increasingly risky endeavor.
This shift was not inevitable; nor was it wise. Policymakers have repeatedly made choices that run counter to the growing body of research that shows that making public investments in lowering the price of college is one of the most effective ways to get people to enter college and progress successfully through it. Research consistently reveals significant links between lowering prices (either by reducing tuition or increasing grant aid) and greater enrollment2, persistence3, and completion.4 Lower prices can increase the likelihood that a student decides to attend a 4-year college over a 2-year college, and can positively affect academic performance.5 Conversely, rising prices, particularly at non-selective institutions, can reduce the diversity of a campus,6 wiping away decades of progress and preventing colleges from becoming more reflective of state and national demographic shifts.
Imagine a world in which lawmakers at both the state and federal level made decisions aligned with the promise of higher education. They would reckon with the effects of a system predicated on unevenly distributed debt, a system that reinforces the racial disparities we see in nearly every other part of our economy. They would acknowledge the fact that as Latinos comprise a growing portion of the population knocking at the door of higher education, they are also extremely wary of taking on loans.7 Lawmakers would be mindful that older adults with no previous credential—especially the 25 percent of the college population with children of their own8—must work long hours just to make ends meet; tuition may be out of reach and education debt may be a much greater burden with a shorter timeline in which to pay it.
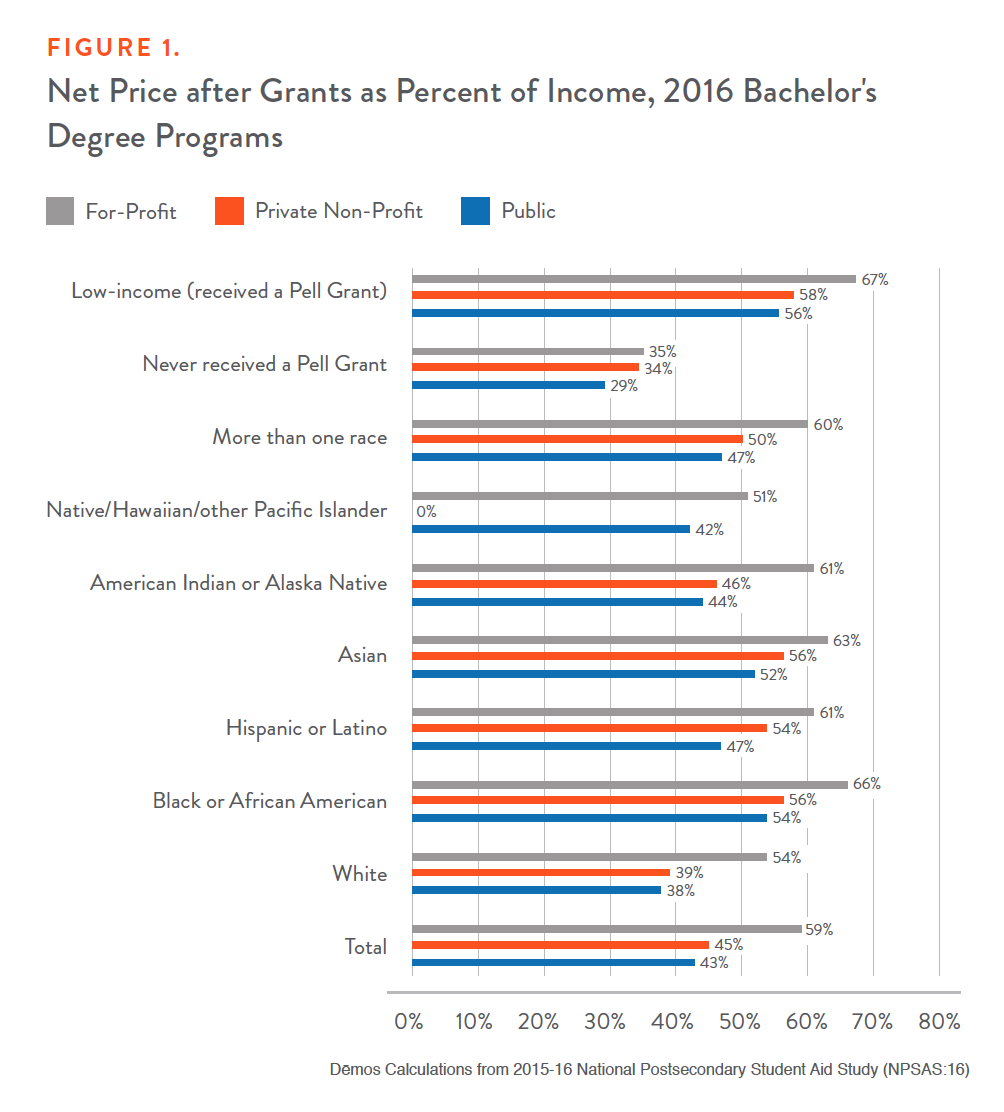
They would find it unacceptable that black families and students from working-class families continue to be more likely to need to borrow for college, regardless of the credential they seek or the type of institution they attend. As Figure 1 shows, new data from the U.S. Department of Education reveal that, even after receiving grant or scholarship aid, both African-American students and working-class students (defined as those receiving a Pell Grant) face college prices at public 4-year institutions that can take up over half a year’s worth of income on average. Wealthier families face prices that only require a little over a quarter of their income for a bachelor’s degree from a public institution.
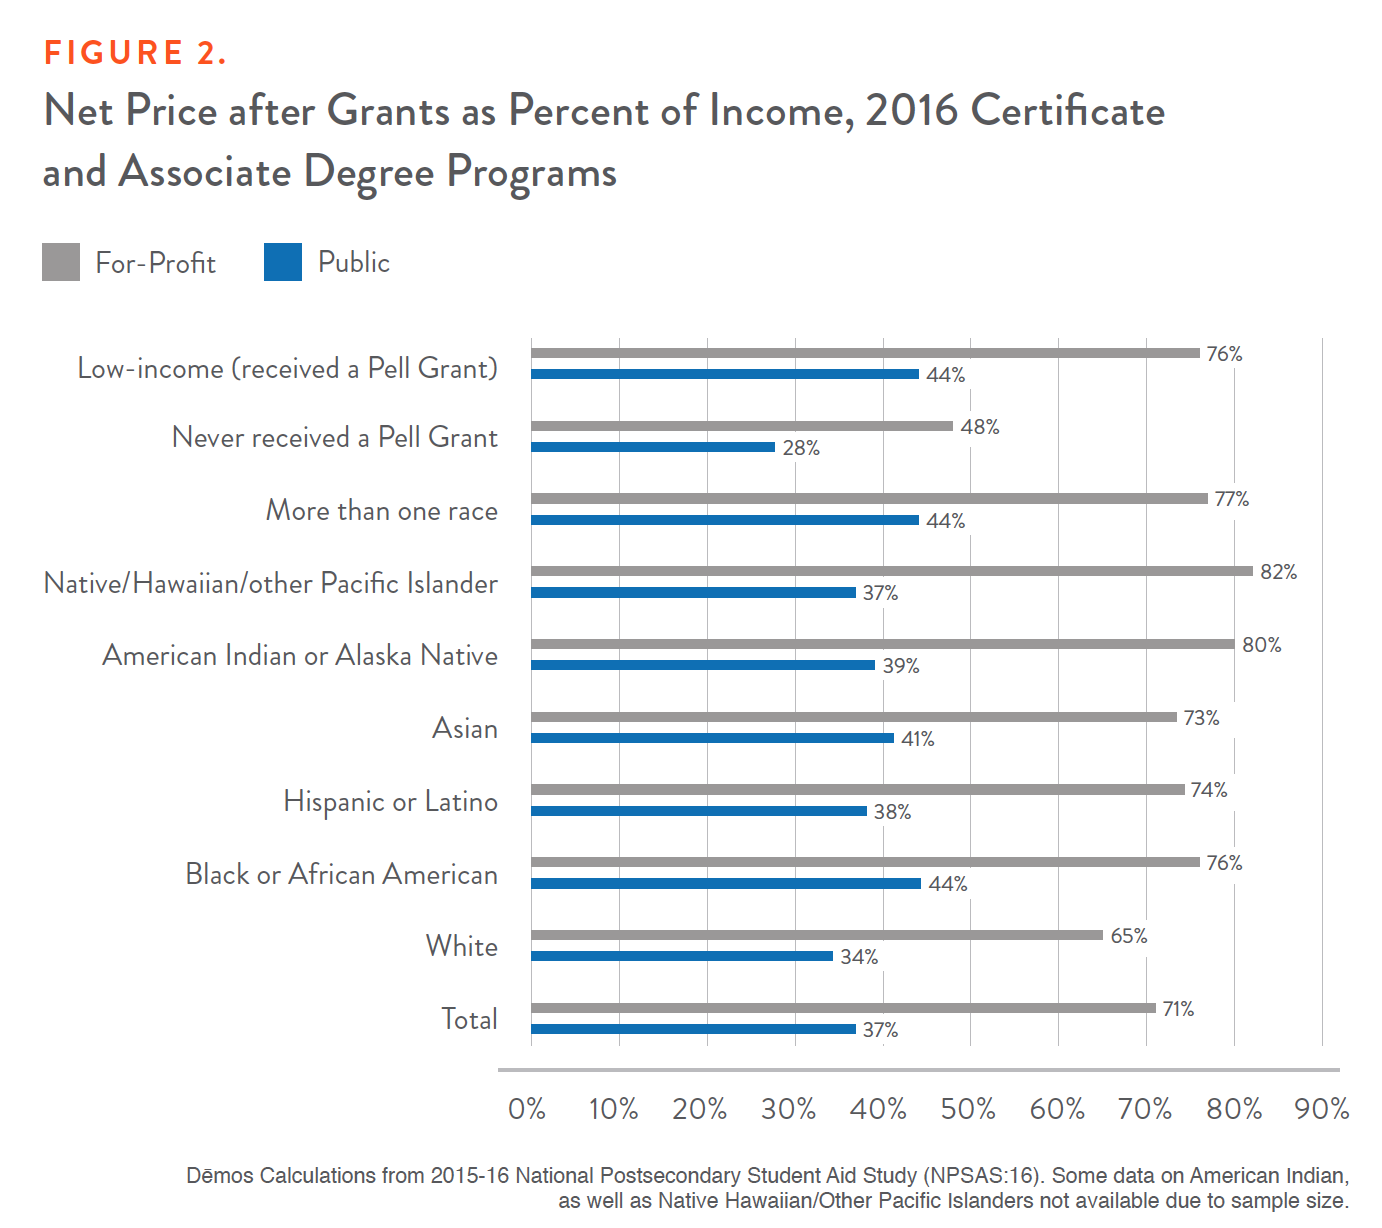
This gap is not restricted to families seeking a bachelor’s degree. A similar disparity can be found in the percentage of annual income that different kinds of families pay for certificates and associate degree programs, as Figure 2 reflects.
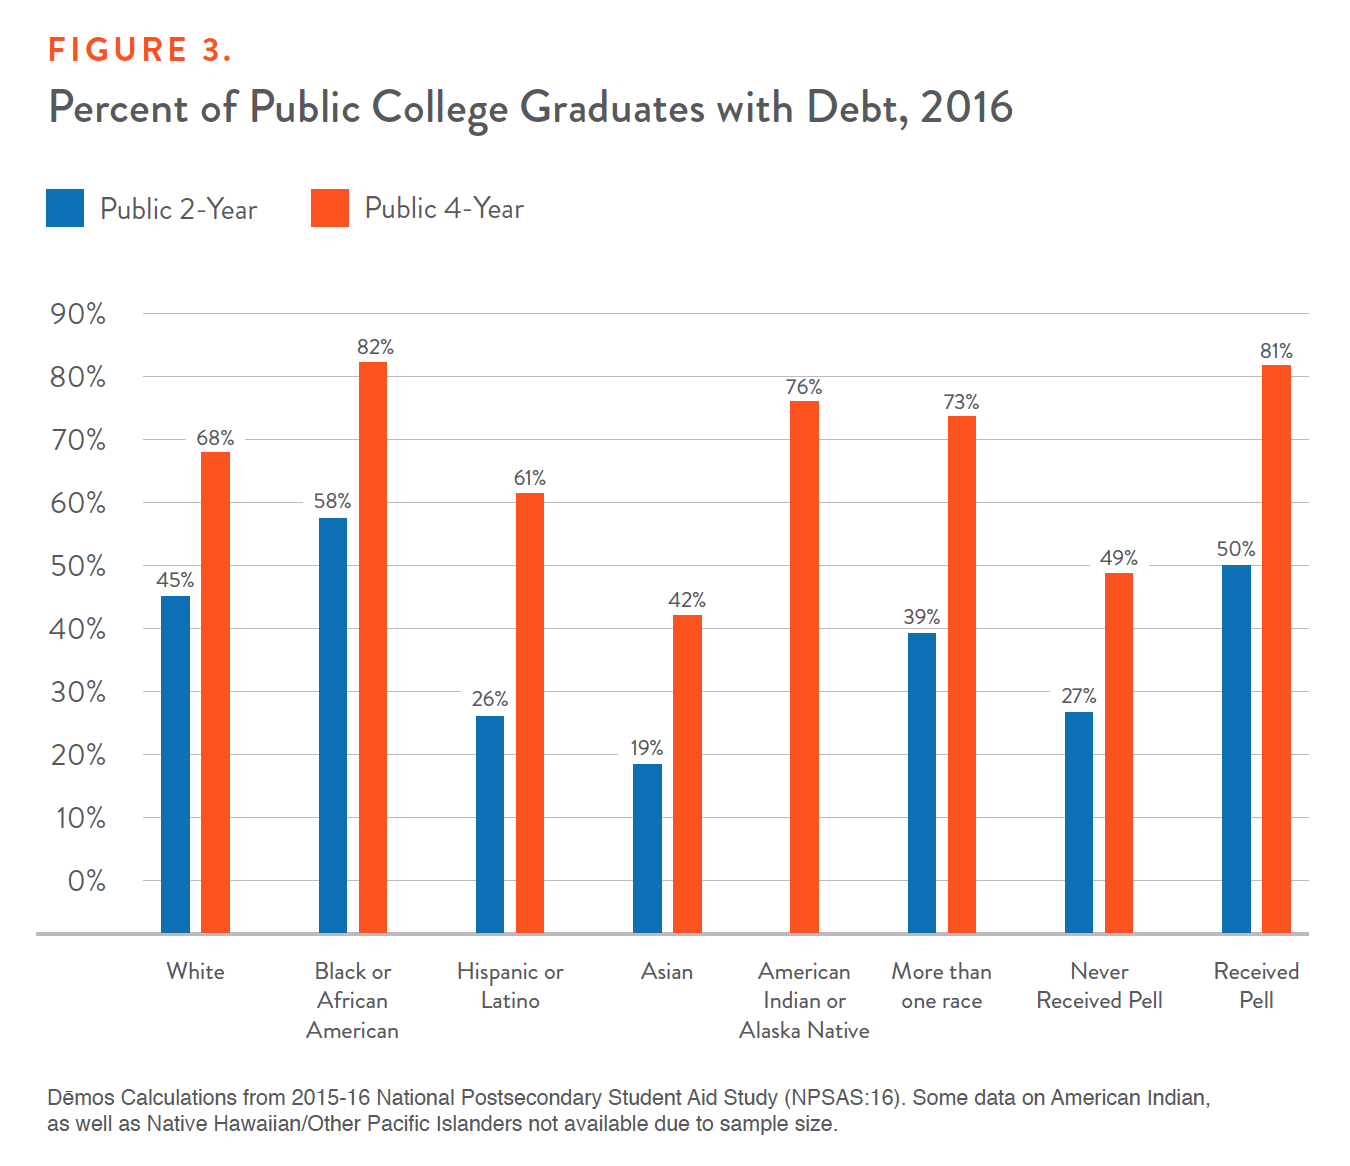
It is no surprise, then, that 4 in 5 working-class or African-American students must borrow for a bachelor’s degree from a public college, and nearly 6 in 10 black associate-degree recipients took on debt from public 2-year institutions in 2016, putting the lie to the notion that our public institutions—including community colleges—can be considered remotely affordable. Figure 3 illustrates the percentages of public 2- and 4-year college graduates who had to take on debt.
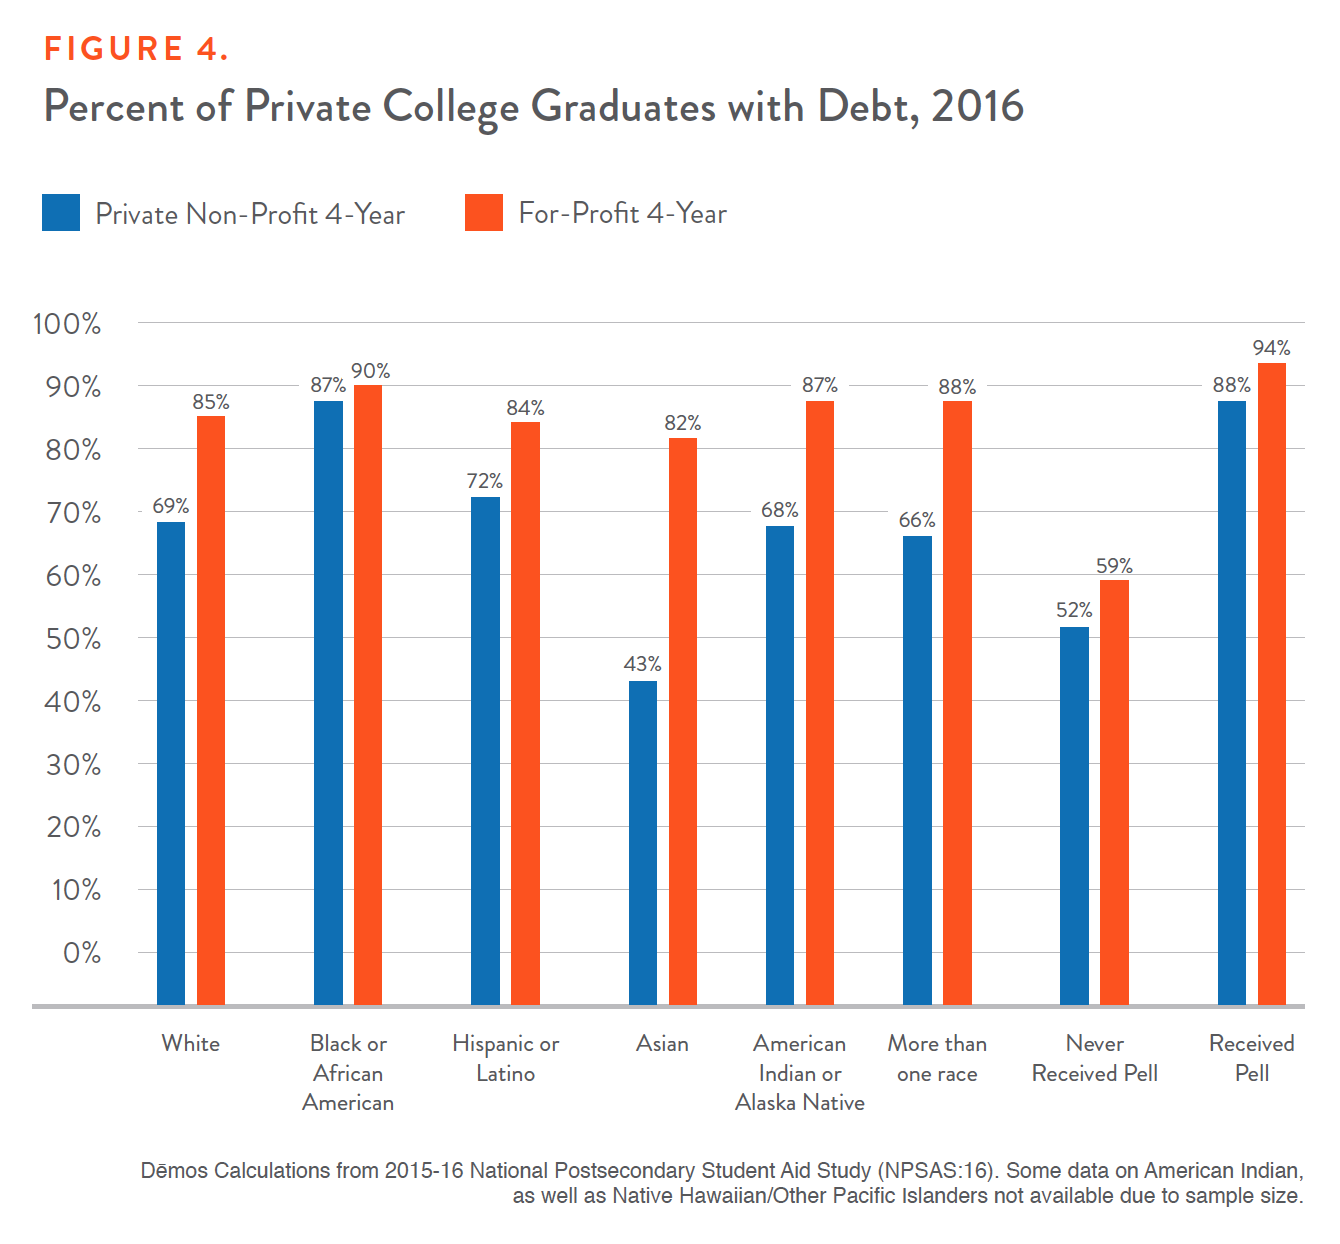
Disinvestment in the public sector—which not only raises prices but can diminish the number of available seats, classes, or degree programs—is related to increases in students enrolling in for-profit colleges9, which often compete with community colleges and open-access public colleges for students, and which also have even higher average prices and greater debt, as Figure 4 shows.
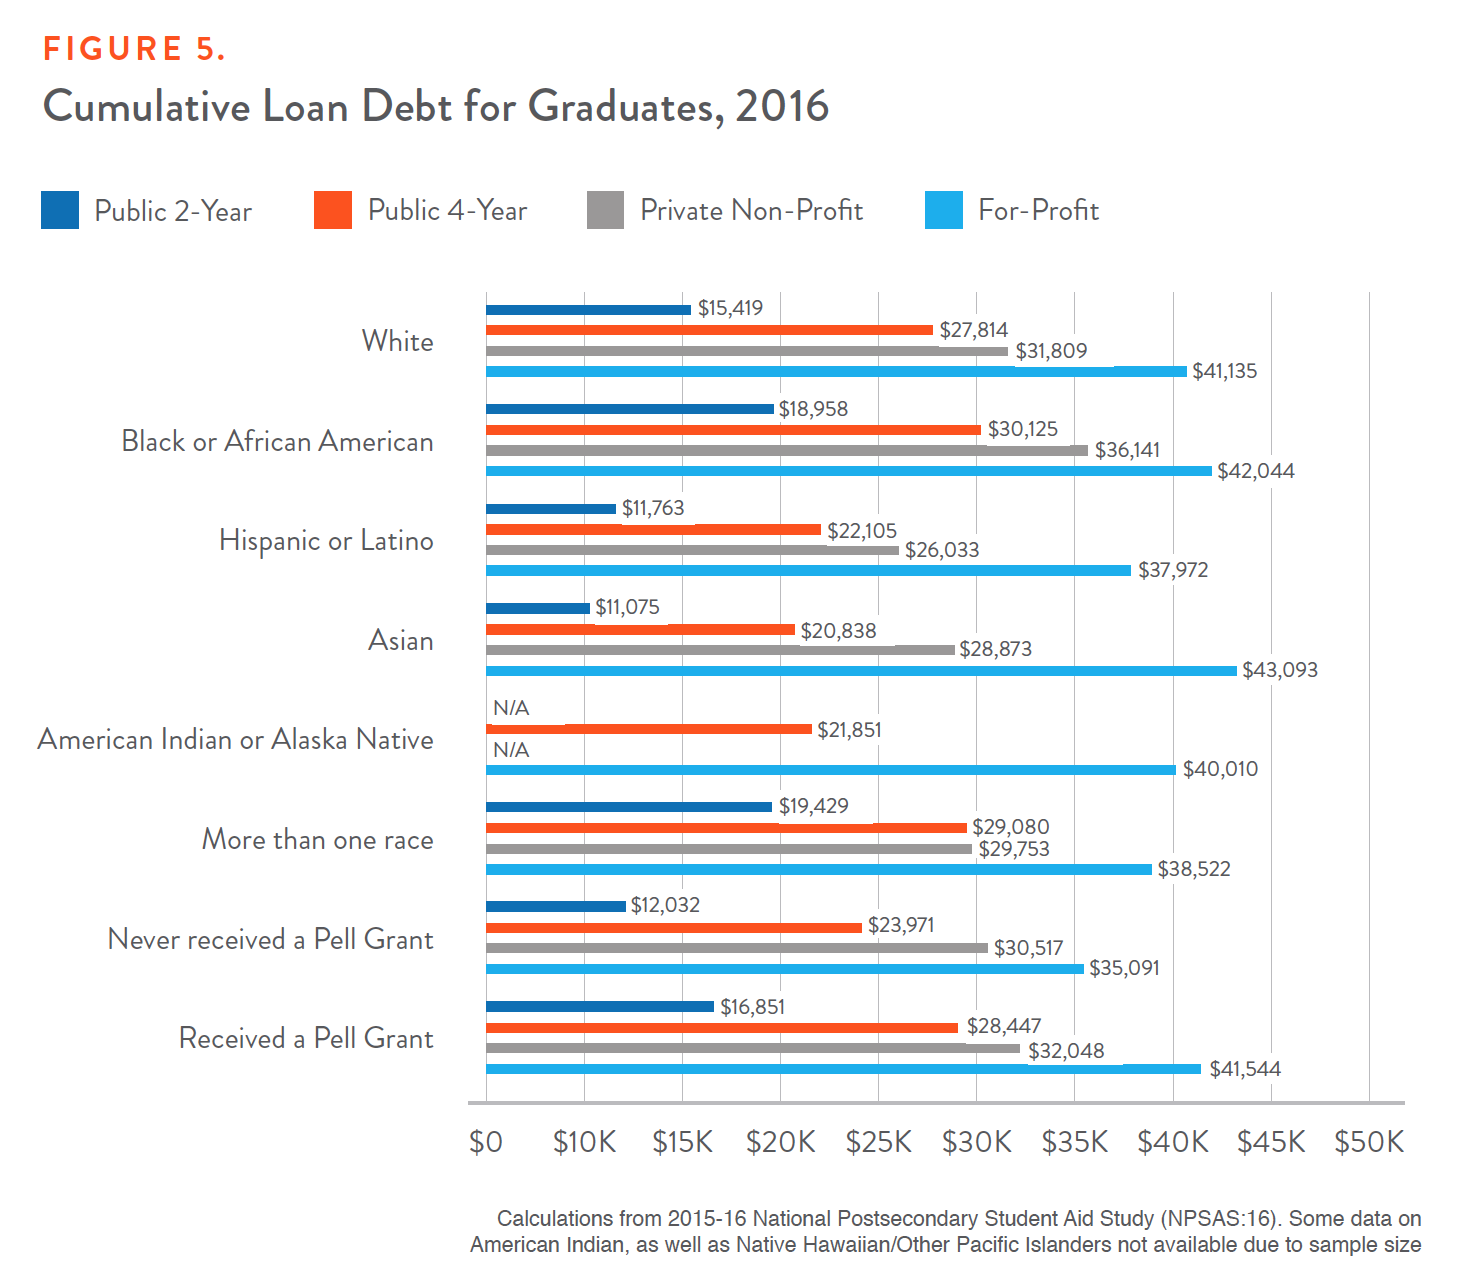
For African-American borrowers, the average debt for an associate degree at a public 2-year college is over $18,500, and over $30,000 for a bachelor’s degree from a public college. (See Figure 5.)
Reversing this inequitable trend would be consistent with the stated values of the U.S. and also good for the economy. Time and again, state governments have failed to invest in services like education and instead relied on tax cuts to spur state growth. Yet promises that slashing income-tax revenue would lead to greater investment or boost family finances in the long term have failed to come true.10 Instead, these tax reductions serve primarily as state giveaways to large corporations, and actually offset average state and local business taxes to the tune of $45 billion.11
In contrast, investments in every level of education pay off. Studies show that individual states see a return of between $3 and $4 for every $1 invested in public colleges and universities.12 States investing in higher education see greater returns than if they had taken the funding and invested it in an S&P 500 index fund.13 One study estimates that Illinois recoups investment in education in fewer than 3 years.14 Investment in a state’s talent pool is a proven strategy for attracting business, inoculating from economic downturns, and encouraging innovation.
Where Does Your State Rank on Disinvestment?
A generation ago, public institutions relied on tuition for just a portion of their funding, turning to public investments for the rest. Today, reliance on tuition—just one of many costs students encounter in college—can be linked to a long-term decline in per-student investment. No state is immune to this phenomenon, but some states have been more derelict than others in meeting the demand for education and skills with investment. Figure 6 illustrates how each state’s reliance on tuition has grown from 1992 to 2017. Nationally, tuition made up 22 percent of the total spending on public higher education in 1982, and by 1992, the figure was just under 29 percent. Twenty-five years later, by 2017, it reached over 46 percent.15
Click to enlarge
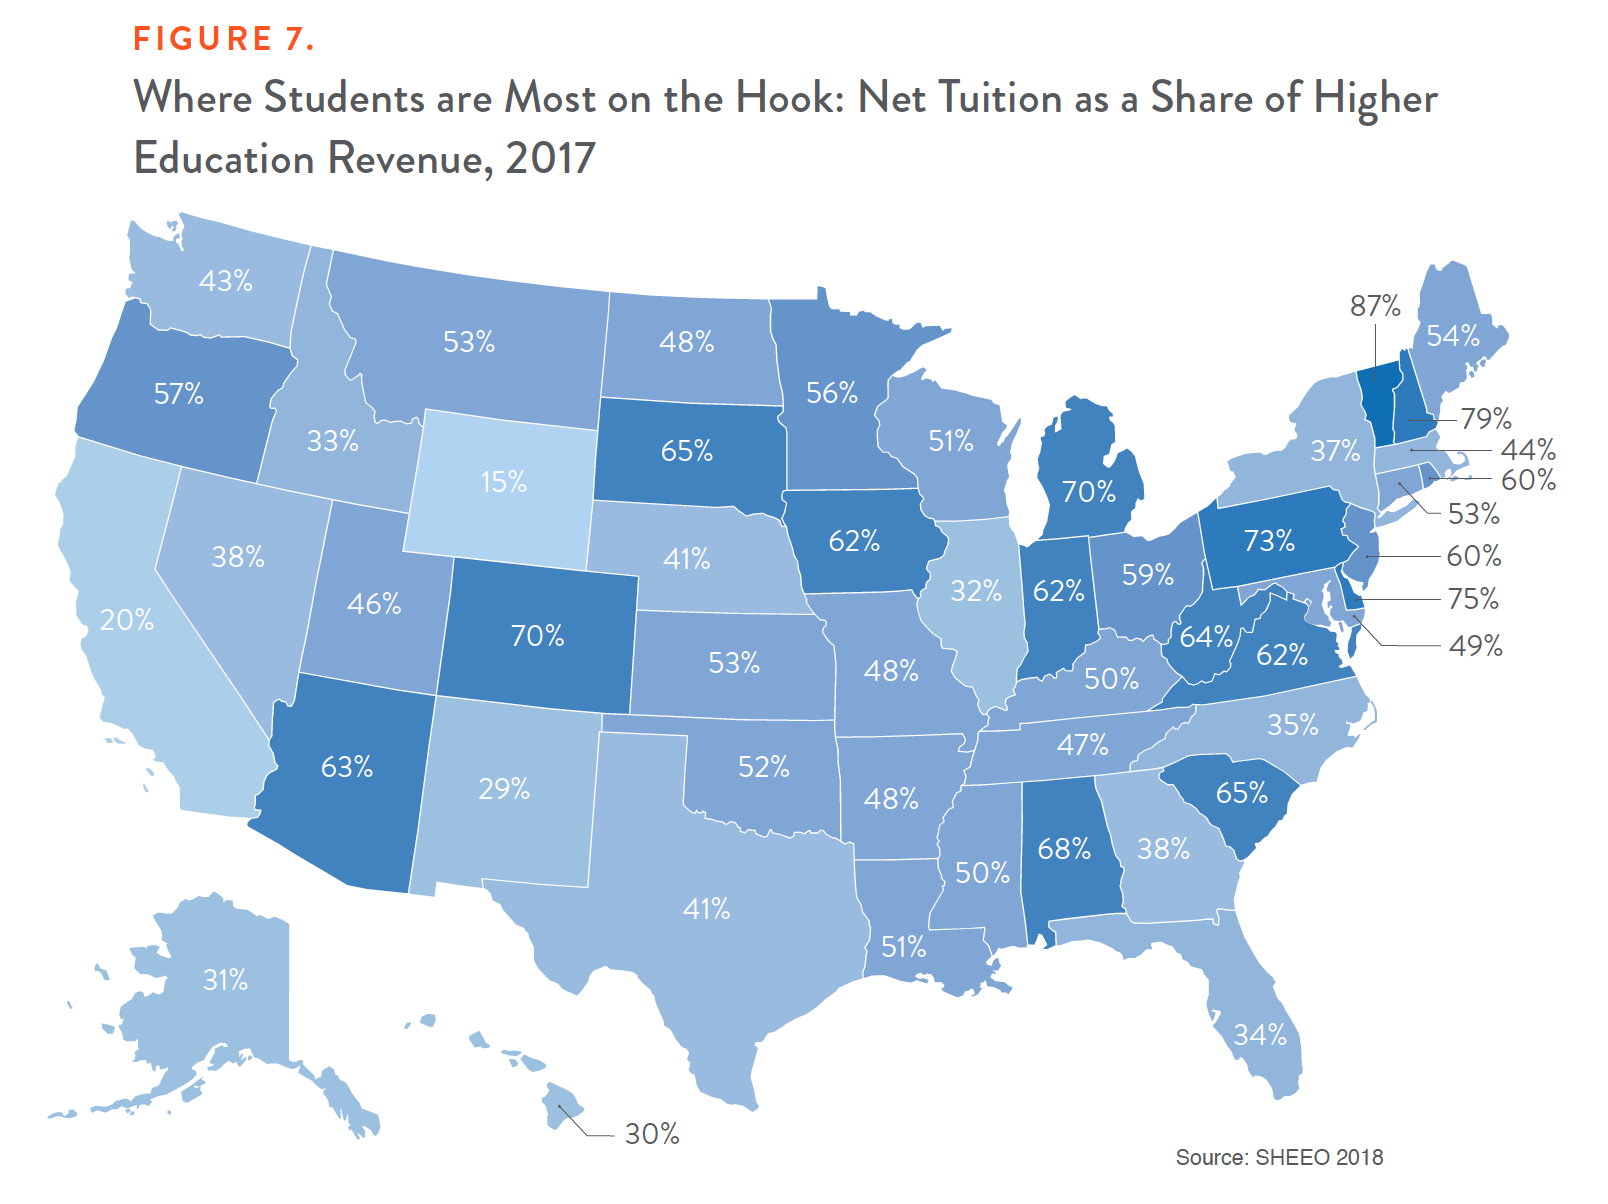
Across the country, the share of higher education revenues provided by tuition ranges from a low of 15 percent in Utah to a high of 87 percent in Vermont as Figure 7 indicates.
This great cost shift from taxpayers to individuals has been particularly brutal in some states. Pennsylvania and Vermont, for example, have cut per-student funding in half (adjusting for inflation) since 1992. Several states that had been synonymous with excellent public higher education, such as Wisconsin and Michigan, have decreased funding by one-third in the past 25 years. Table 1 breaks out the changes in per-student appropriations in each state over the past 2 decades.
Analysis from SHEEO Data. All figures are adjusted for inflation using the Higher Education Cost Adjustment index
Each state faces unique budgetary pressures, and some states have a stronger ability to weather any industry-specific or economy-wide downturns. But the phenomenon of states so often cutting higher education first during economic downturns—and not reinvesting to the previous level in the upturn—is not sustainable in the long run. States risk diminishing their talent pool and facing the knock-on effects of greater debt and lower financial security. Candidates and policymakers who care about reversing tuition spikes, job cuts, and deferred maintenance at public institutions of higher learning must understand that a series of political decisions that favor tax cuts, tax breaks for corporations, and prison spending are in part to blame for this crisis. Only a recommitment to core values—and investment backing up those values—will stop this trend.
How to Build an Equitable, Bold, and Simple Guarantee of College without Debt
Over the last few years, 16 states and dozens of cities have launched “Promise Programs,” initiatives that cover tuition and fees for students, primarily at 2-year colleges.16 The growth of these programs is a testament to their political appeal and their early success in promoting college access and persistence. Each program has its own features, which can be appealing given differences in state economies and attainment needs. When contemplating a Promise Program or any guarantee of affordable college, states should consider that there are policy designs that can determine how equitable and sustainable these programs are, not to mention features that may increase or reduce political support. The following is a list of common policy features, and a discussion of how to create a bold affordability guarantee that lifts everyone up. Where possible, we outline a gold standard for equitable policy, while discussing the relative merits of other approaches that do not quite reach the level of optimal policy.
Goal 1: Invest in All College Costs, Not Just Tuition
Since 2015, the national debate around college affordability has been driven by different camps—those offering proposals for “tuition-free” college, and those who prefer to focus on “debt-free” college. These 2 framings are not mutually exclusive. But it is important to remember that the total financial burden on students goes well beyond tuition: Students must cover the cost of books, fees, living expenses, and transportation, not to mention things like childcare costs. At community colleges, tuition makes up only one-fifth of the price of attendance, so dealing with tuition alone will not eliminate—and may barely reduce—the need to borrow to attend college full-time.
Gold Standard: First-Dollar Programs
There are several ways to ensure that students, particularly those from working-class backgrounds, can receive a genuine affordability promise. The ideal approach is through a “first-dollar” program, in which the state (or institution) eliminates tuition and allows students to use any grant or scholarship aid on living expenses and other non-tuition costs. This approach is equitable and generous; since high-income families do not receive need-based financial aid, all families receive some benefit but low-income students are set on a path toward more equal opportunity. The research on first-dollar programs, similar to research on need-based grant aid in general, is positive: They lead to increases in enrollment, college persistence, and attainment.17
In contrast, the “last-dollar” approach employed by many states and cities, including New York,18 only invests in the amount of tuition that is not covered already by the Pell Grant or other aid. In other words, it exhausts federal financial aid before new state resources kick in. Thus, by definition these programs send less money to low-income households. There may be some benefits to a last-dollar structure—it focuses students to apply for financial aid when they otherwise might not have, thus taking advantage of money that currently exists—but it is less effective for closing affordability gaps.
Other Approaches: Middle-Dollar Programs, First-Dollar for Working Class, Increase Investment in Other Social Programs
There are other approaches as well. Oregon, for example, has a last-dollar program but guarantees all students receive at least $1,000, even if their tuition is covered by other grant aid, also known as a “middle-dollar” scholarship.19 Thus, students whose Pell Grants cover tuition will receive an additional $1,000 grant for living expenses, while wealthier families’ awards go mainly toward tuition.
Another compromise approach could be to guarantee a first-dollar program for working-class families, while maintaining a last-dollar approach for families above a certain income threshold. For example, a state could promise to pay tuition for anyone making below 150 percent of the poverty threshold before factoring in other aid, while factoring in existing aid for middle-class families and above. This could be done by expanding a state’s need-based aid program or eliminating merit-based aid programs and putting money into increasing awards for low-income students.
Additionally, states could attempt to cover all college costs by expanding programs that would take care of childcare for student parents, offering housing credits for rent-constrained families, or even increasing the minimum wage such that a 10-hour per week job can cover living expenses, while tuition is taken off the table.
Goal 2: Address Inequitable Funding Across Institutions
Higher education is often reflective of a legacy of wealth extraction and blocked opportunity for communities of color. Elite institutions maintain large endowments and are often judged by the number of students they exclude, rather than include. Just 5 percent of students at our nation’s public flagship colleges are black.20 Courts have found that troubling vestiges of racism make it so Historically Black Colleges are underfunded and often disadvantaged due to state policy.21 Meanwhile, across the country, community colleges receive less funding despite enrolling far more students with greater financial and academic need. Public funding at state research universities is over twice that of community colleges.
Gold Standard: Fund Community Colleges and MSIs First, Demand Selective Institutions Become More Representative
Consider these disparities when designing a college affordability guarantee. States should not only ensure that the institutions that enroll the lion’s share of working-class students and students of color be able to provide a low-cost education to students, but also that new investments are made through a reparative lens. States should consider a generous affordability promise that provides more subsidies for students at community colleges, open-access 4-year colleges, and public Minority Serving Institutions. Any affordability promise to public flagship institutions could include a mandate that they take steps to enroll a more economically (and ideally, racially) diverse student body,22 or that they contribute a portion of endowment or other funds to need-based financial aid as a part of their commitment to the promise.
Goal 3: Be Judicious with Income Caps
Federal proposals, including those put forth by Sen. Bernie Sanders and Secretary Hillary Clinton during the 2016 presidential campaign, have proposed tuition-free college for all families making under $125,000.23 Likewise, New York state’s Excelsior Scholarship is a tuition-free promise for all individuals or families making under $125,000 annually.
Gold Standard: No Income Caps
Income caps serve a noble purpose: With limited state resources, policymakers want to target resources at middle- and working-class families. And to be sure, any equity-focused free college policy will find a way to direct more funding at working class students as well as the institutions that serve them in large numbers. States should be careful, though. On one hand, only considering annual income ignores the fact that families with similar incomes, from different racial backgrounds, often have very different wealth prospects. For example, the typical white family making near the median household income (between $50,000 and $60,000) has more than 4 times the financial assets as African-American and Latino families earning the same amount.24 Furthermore, when setting parameters on any plan, lawmakers should account for family size and geographic differences in the cost of living. After all, a family of 6 with an annual income of $100,000 in a metropolitan area will have vastly different resources than a family of 2 with the same income in a rural area.
Finally, policymakers should seriously consider the relative benefits of saving small amounts of money with the costs of potentially undermining political support in the long term, given the outsized role that wealthy voters play in our politics.25
This is where framing of “debt-free” or “college without debt” can be useful. Wealthier families, by definition, are less likely to be forced into borrowing for public college. Thus, states can offer all families a guarantee that students can go to college without debt—and avoid the need to create an arbitrary income cap—by committing that the state will cover a portion, or all of, a student’s unmet financial need after grants, a reasonable Expected Family Contribution, and perhaps 10 hours of work by the student per week. This offers the same universal guarantee to everyone – you can go to college without debt – without needing to create an arbitrary income cap, while potentially directing more resources on the households with the greatest financial need.
Other Approach: Income Caps at Elite Institutions Only
A compromise approach would enable families of all income levels to benefit from a free college guarantee at all community colleges and less-selective 4-year colleges, while capping the benefits for selective or flagship 4-year institutions. This would serve 2 purposes: first, it would ensure that any poor student wanting to attend an elite college still has the same guarantee that they would at a community college, while taking into account the fact that elite institutions often have more endowment funding, and the ability to attract wealthy students who are less price-sensitive. Second, given the funding disparities at the state (and federal) level between flagship and selective colleges and their less-selective counterparts, such a proposal could re-route new state funding to those colleges that traditionally receive fewer state dollars.
Goal 4: Avoid Overworking Students
In the past few years, there has been a wave of efforts to impose work requirements on families receiving social assistance such as Medicaid, TANF, and food stamps.26 These ill-thought policies invariably harm those who cannot work due to mental illness or physical conditions, and create an unnecessary bureaucracy that undermines the purpose of many public benefit programs. Ironically, such policies may leave people less able to be productive members of society.
Gold Standard: No Work Requirements
Likewise, any state considering a bold college affordability guarantee should avoid work requirements for several reasons. First, 40 percent of the college-going population is 25 or older, and 25 percent of all college students have children of their own.27 These students are already working, by and large, in order to support their families. By putting a work requirement on any plan to make college more accessible, states also risk hitting students with a “double whammy,” if they were to lose their jobs, forcing students into a cruel and counterproductive situation in which they are unemployed and also lose financial aid or free college benefits. Second, research suggests that working at a job more than 15 hours a week may be harmful to academic success. In 38 states, working-class students must work more than 20 hours a week to avoid education debt.28 We should encourage students to work less in many cases, not more.
Other Approach: Work Assumptions
Rather than requiring students to work, states considering how much to subsidize students should take care to expect that only a portion of a student’s earnings while in school can go toward college. A reasonable assumption may be that 10 hours per week at the state minimum wage (or between $3,625 and $6,625 per year, depending on the state29) is an affordable contribution for a student. However, this assumption should be waived for certain groups, namely adults returning to college and student-parents, who may have fewer earnings available to meet basic needs for themselves and their families if their earnings are earmarked for tuition or other college costs.
Goal 5: Build a Sustainable, Progressive Revenue Stream
Across the country, Promise Programs vary in design and generosity, but because they all feature a simple, easy-to-understand guarantee for families, they likely generate more political support than simply promising to add more money into a general fund for colleges and universities.30 But another key to the sustainability will be ensuring that any funding stream is durable and fair as well.
It is obvious that states that have slashed taxes have not seen the promised economic growth materialize, and cuts to education (higher, K-12, and pre-K) have followed.31 In many cases, simply reversing harmful tax cuts and avoiding ineffective business tax breaks will provide a chance to seed a college affordability guarantee. But where possible, state policymakers should avoid levying additional regressive taxes to pay for a college affordability promise. Sales taxes, for instance, have eroded in many states and are not levied on many services and certain goods, including those purchased online. Increasing sales taxes will only compound the regressivity of many state tax codes, especially if it is not coupled with fixes for the online-sales loophole and tax breaks on goods targeted at wealthier households.
Some states consider lottery funds to pay for higher education. Lotteries can be extremely regressive—low-income households account for the majority of lottery sales—and can be unreliable funding streams.32 And while using them as a way to pay for public higher education can indeed increase funding, researchers found a strong negative relationship between lottery funding and need-based financial aid.33 In other words, additional lottery funds coming from low-income households often get used to cover merit scholarships and other services that benefit wealthy students.34 To the extent that they are a revenue stream at all, lottery funds should be combined with funding that comes from those who can afford to pay.
And of course, families with the greatest wealth often pay very little in state and local taxes. Consider the estate tax. States, despite persistent budgetary pressures, have eliminated or raised the exemption on estate or inheritance taxes in recent years.35 These taxes are designed to stop tax-free growth of inherited income, and their cuts signal that many policymakers remain troublingly unconcerned with intergenerational inequality. Even modestly reversing these cuts not only avoids taking revenue from poor families, it sends a powerful message: We are paying for the greater good with income that has not been earned. Another option is to levy a small surcharge on high-income earners—say, households making $500,000 and above. Better yet, states should consider multiple revenue streams—a surcharge on high incomes, reinstating an estate tax, closing corporate tax loopholes, and modest changes to sales taxes—and guarantee a portion go into a fund that ensures long-term fiscal health of any college affordability guarantee.
Goal 6: Avoid Punitive Measures and Bait-and-Switch Provisions
Some states have tried to ration their Promise Programs in ways that often sound politically advantageous but make the program either punitive or overly complex. Such proposals include drug testing recipients,36 limiting benefits only to certain majors,37 or demanding that students who receive the benefit of free college stay and work in the state for a set number of years after college, with the penalty that otherwise their free college “grant” will convert into a student loan.38
Of these 3 rationing mechanisms, asking students to stay in the state after college may seem the most harmless. After all, state policymakers want to make sure their investments are rewarded with a dynamic workforce. Unfortunately, creating a back-end requirement that students stay in-state will harm those who need to move across state lines to care for family and restrict those who might have a more fulfilling job opportunity just a few miles away. At its worst, it could force someone to remain unemployed rather than take a job in a neighboring state. It also creates a totally unnecessary bureaucracy; the creation of a new financial instrument—the new student loan—may cost the state more than they could recoup by ensuring that a middling number of students do not leave the state after graduation. Further, the loan would have to be administered for graduates who, by definition, no longer live in the state, creating even more logistical hurdles. States should instead focus on inducing graduates to stay through policies that build dynamic communities and by investing in higher wages, childcare, or paid family leave.
Other policies such as drug testing recipients are cruel, counter-productive, and hypocritical. At a time when the opioid epidemic has ravaged many states and cities, denying educational opportunity on the grounds that someone may struggle with substance abuse is particularly ill-conceived. Families who receive state tax benefits or invest in state college savings plans are not drug-tested. Nor should be families who want to send kids to college. A far more humane approach would be to increase investment in drug prevention and treatment centers at public colleges and universities, based on effective models of integrating multiple public benefit programs into higher education.39
Goal 7: Invest in Proven Methods to Increase Completion and Lower Debt
Another way to limit the cost of college—both to students and taxpayers—is to ensure that students are provided with services that decrease the time it takes to receive a high-quality degree or credential. While making college more affordable will undoubtedly boost persistence and completion, particularly for those who might otherwise drop out due to financial reasons, colleges and states can employ other methods to help students get to and through college more quickly.
For example, the City University of New York’s (CUNY) Accelerated Study in Associate Programs (ASAP) approach provides an affordability guarantee by waiving tuition and providing free textbooks and a transportation stipend, as well as high-touch advising, counseling, and tutoring. It doubled 3-year graduation rates for participants and was so successful that the cost per graduate was far lower than traditional services that attempt to increase college completion.40
Other institutions, including Georgia State University, have increased graduation rates by combining emergency financial aid and high-touch, consistent advising and mentoring services for students who may drop out because they face an unexpected financial need or have unpaid tuition and fees.41 Still other colleges have invested in class offerings and financial aid in the winter and summer, allowing students to afford to attend school year-round, and thus complete more quickly.
State affordability plans can resource these proven strategies through a dedicated grant fund for institutions that are interested in implementing some of these practices. In addition, aid should be distributed such that students can use them year-round, should they choose to continue their education in the summer and complete their degree even more quickly. And much of this investment does not need to be limited to public institutions—private colleges with high numbers of low-income students, including private HBCUs, Hispanic Serving Institutions, and Tribal Colleges, could participate in state efforts as well.
Goal 8: Bold and Targeted Loan Forgiveness, and Protection for Current Borrowers
As states ensure that no future student will need to take on loans for their education, they should work to address the current $1.5 trillion of student debt in our economy and particularly to help those who are most likely to fall behind on their payments or default. While the vast majority of student debt comes in the form of federal loans, states have begun to experiment with ways to help existing borrowers.
Gold Standard: One-Time Loan Forgiveness
Contrary to what some may believe, loan forgiveness need not be expensive to have a big impact on the borrowers who most struggle with their debts. Around one-quarter of loan borrowers default on their debt at some point. But the borrowers who are most likely to default or fall behind are those who have not completed their degree program and often carry relatively low balances. Thus, state policymakers could agree to make a one-time debt payment—of $5,000 per borrower, for example—and wipe out the debt of many of the very non-completers who are most likely to struggle with their loans. In this case, a flat benefit would mean a world of difference to low-income (low-balance) borrowers, while providing some benefit to those with large balances and graduate degrees.
Previous Demos research has found that targeted loan forgiveness—aimed at families below the median income—would reduce the racial wealth gap, particularly among low-wealth households.42
Other Approaches: Stricter Oversight, Repayment Assistance
States have begun experimenting with worthwhile protectionary measures. Some efforts, such as creating a Student Borrower Bill of Rights, are aimed at expanding oversight of loan servicers operating within a state and empowering attorneys general to bring cases on behalf of students who see their payments mishandled or are otherwise misled by their loan servicer.
States should certainly dismantle outdated and counterproductive rules that put workers’ professional or driver’s licenses at risk if they default on a loan; this punitive policy does nothing to deter default or delinquency.43
States can also, however, be creative about loan forgiveness. New York’s Get on Your Feet program, for example, agrees to make 2 years’ worth of payments for student borrowers earning under $50,000 a year, so long as they are enrolled in a federal income-driven repayment (IDR) plan.44 The program’s benefits are squarely targeted at middle-class students; those whose income is low enough to qualify for a $0 payment under federal IDR plans have no payments for the state to cover. This policy could be improved by ensuring that the plan also pays the monthly interest accrual on a loan for low-income borrowers, so they do not see their balances balloon while their monthly payments are manageable.
Or states could supplement the federal Public Service Loan Forgiveness plan, which cancels debt after 10 years of loan payments and employment in a government or non-profit job. Since federal forgiveness is “all or nothing” after 10 years of payments, states could conceivably step in and offer incremental forgiveness—every 3 years, say—and pay off a portion of the loan principal. This would benefit workers who spend a substantial amount of time in non-profit work but do not reach the 10-year forgiveness window. Loan forgiveness can often be sector-specific. For example, many states including California, Colorado, Louisiana, Minnesota, and Ohio offer loan forgiveness for health professionals willing to work in underserved areas.45
Making the Case: How to Talk about Public Higher Education as a Public Good
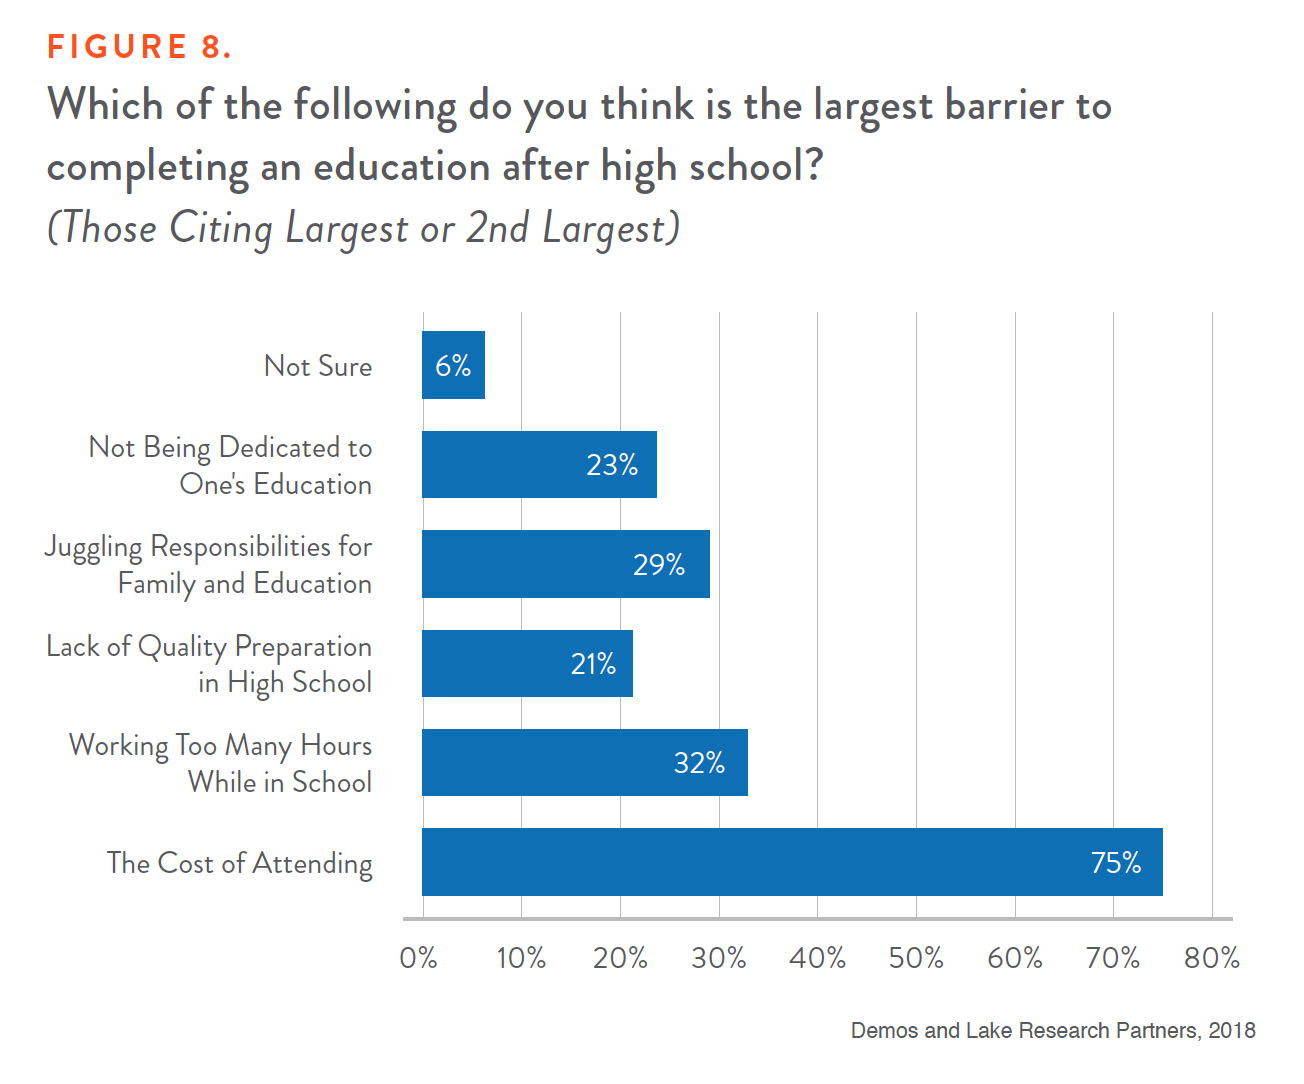
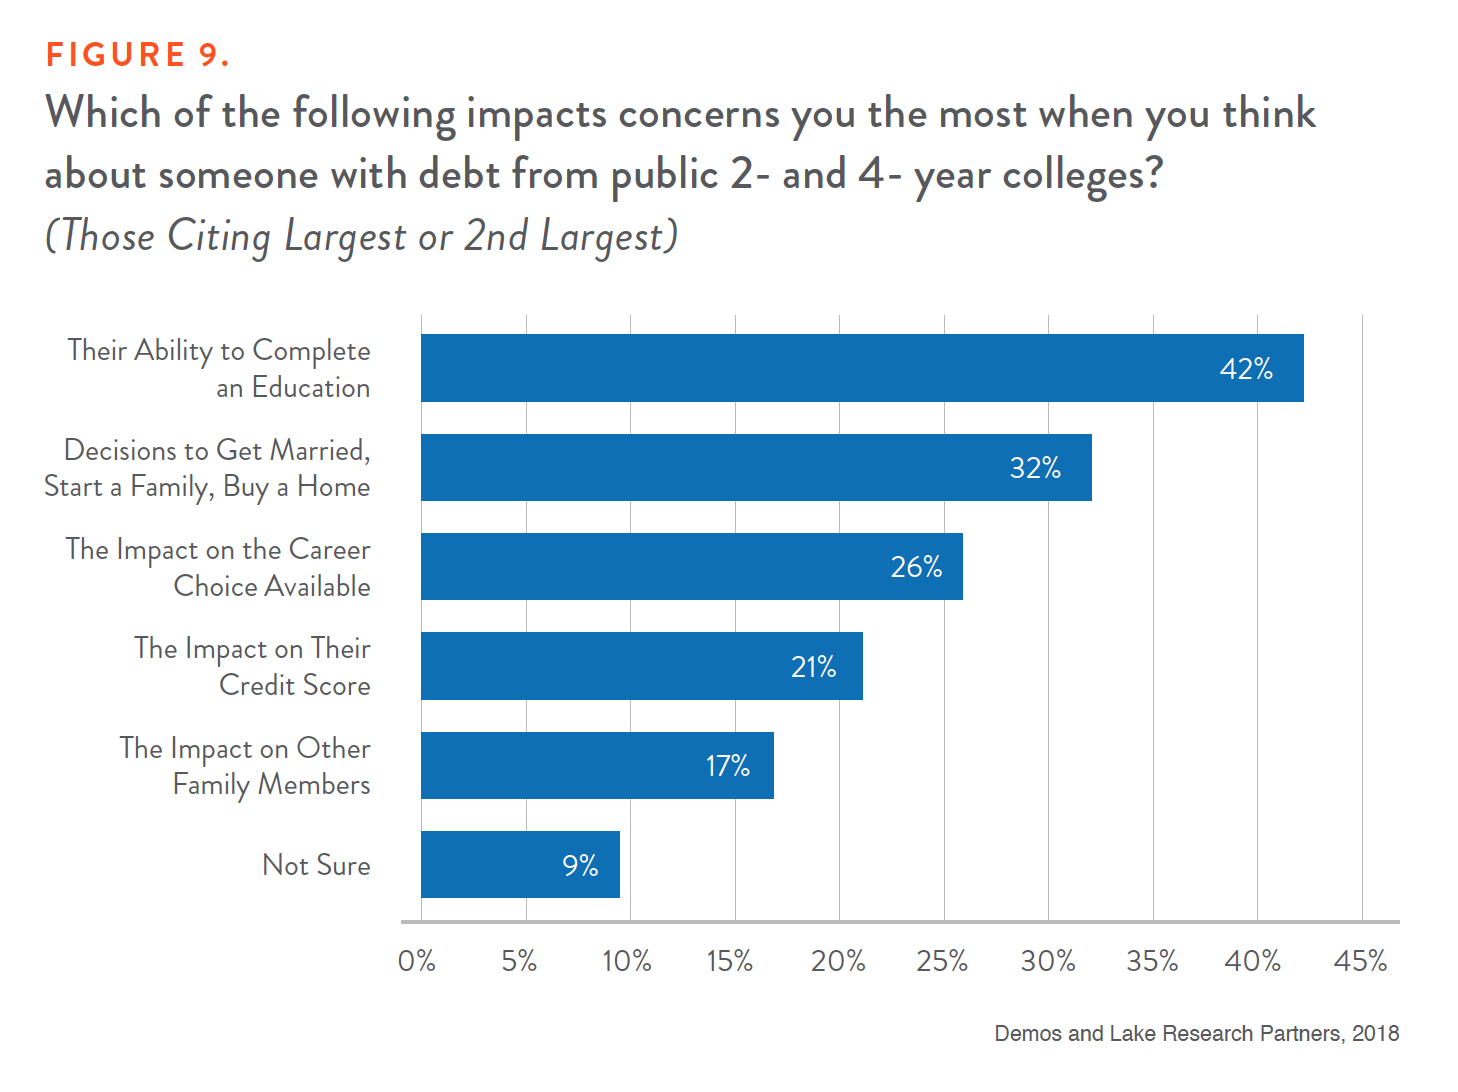
In winter 2017-18, Demos and Lake Research Partners undertook a series of focus groups, dial-tests, and a national poll to better understand voters’ attitudes about higher education and proposals to make it more affordable.46 The results of our public opinion research indicate that Americans of all stripes strongly favor policies to enable more students to graduate without debt. They have internalized the notion that cost is the greatest barrier to completing a degree and that debt may be preventing people from pursuing their dreams—in fact, as Figure 8 shows, it’s the most commonly-cited worry about debt from 2- and 4-year colleges.
Two other worries rated high among the polled voters when they considered people who had student debt: 42 percent ranked the ability to complete an education or the ability to save money as either their first or second concern when it came to student debt. (See Figure 9.)
Most importantly, voters view higher education as something worth investing in as a society, not just as an individual good, and are supportive of policies that would do so. Based on proposals at the state and national level, we asked respondents to indicate their support (on a 1-10 scale) for several policies, including those that would do the following:
Ensure all students can graduate from public 2- and 4-year colleges without debt
Make tuition to public colleges free for all households
Make tuition to public colleges free for households earning below $125,000 per year
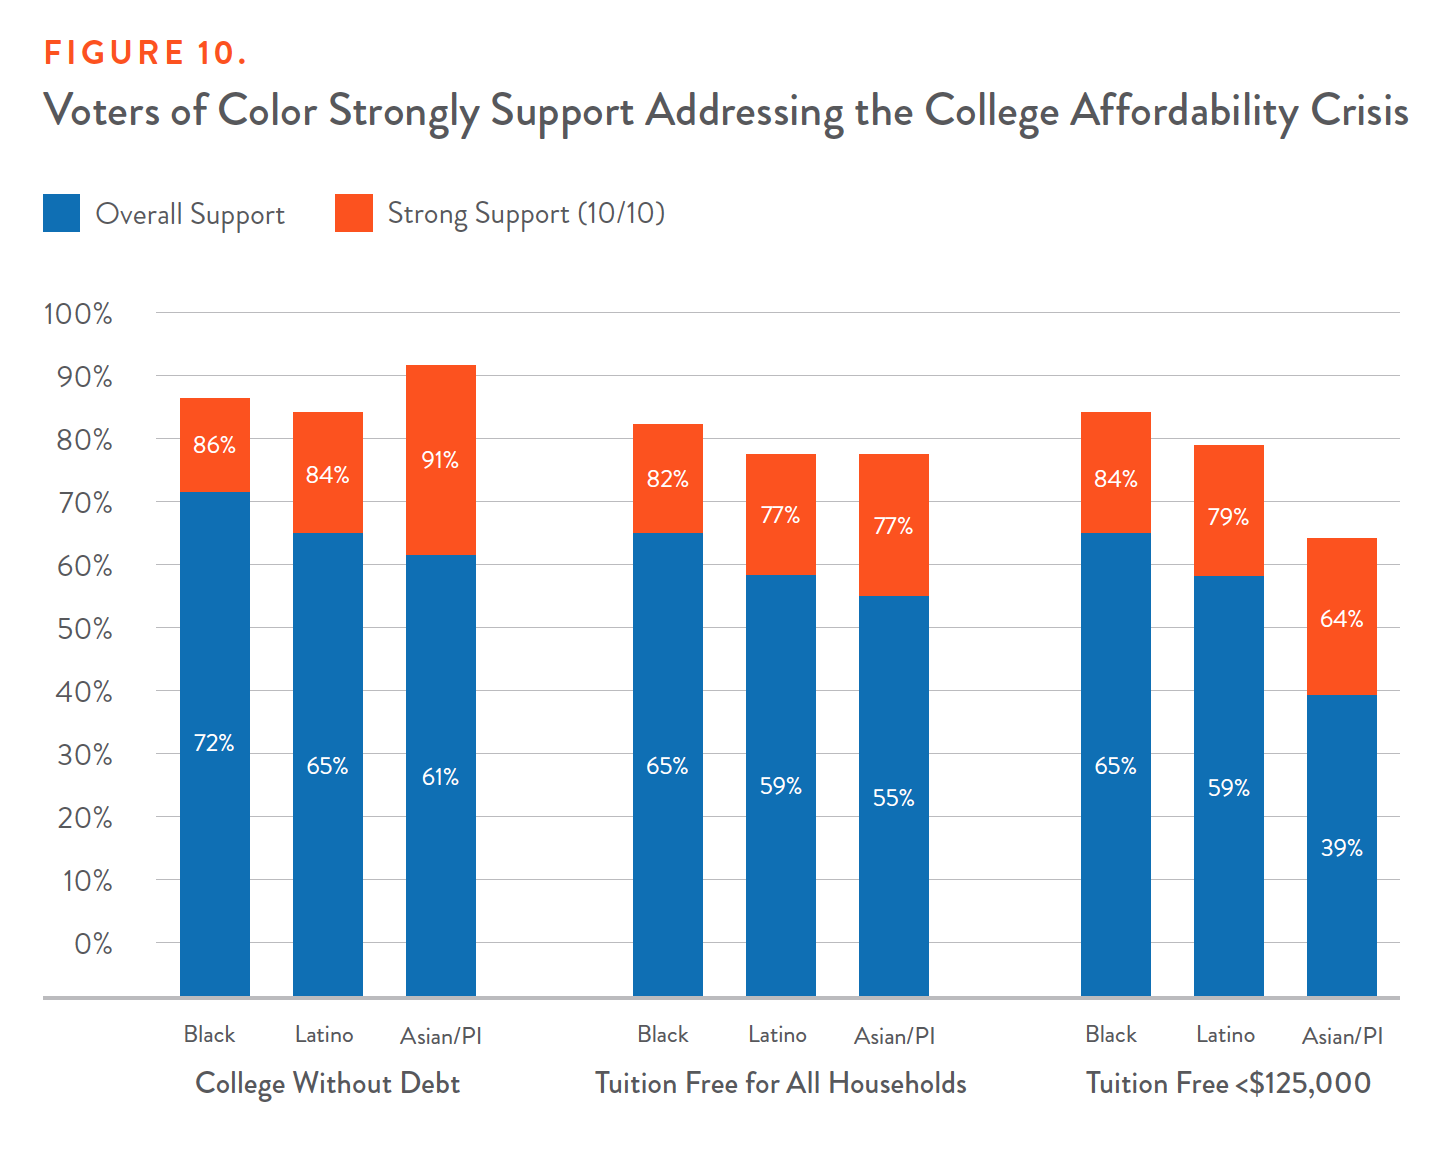
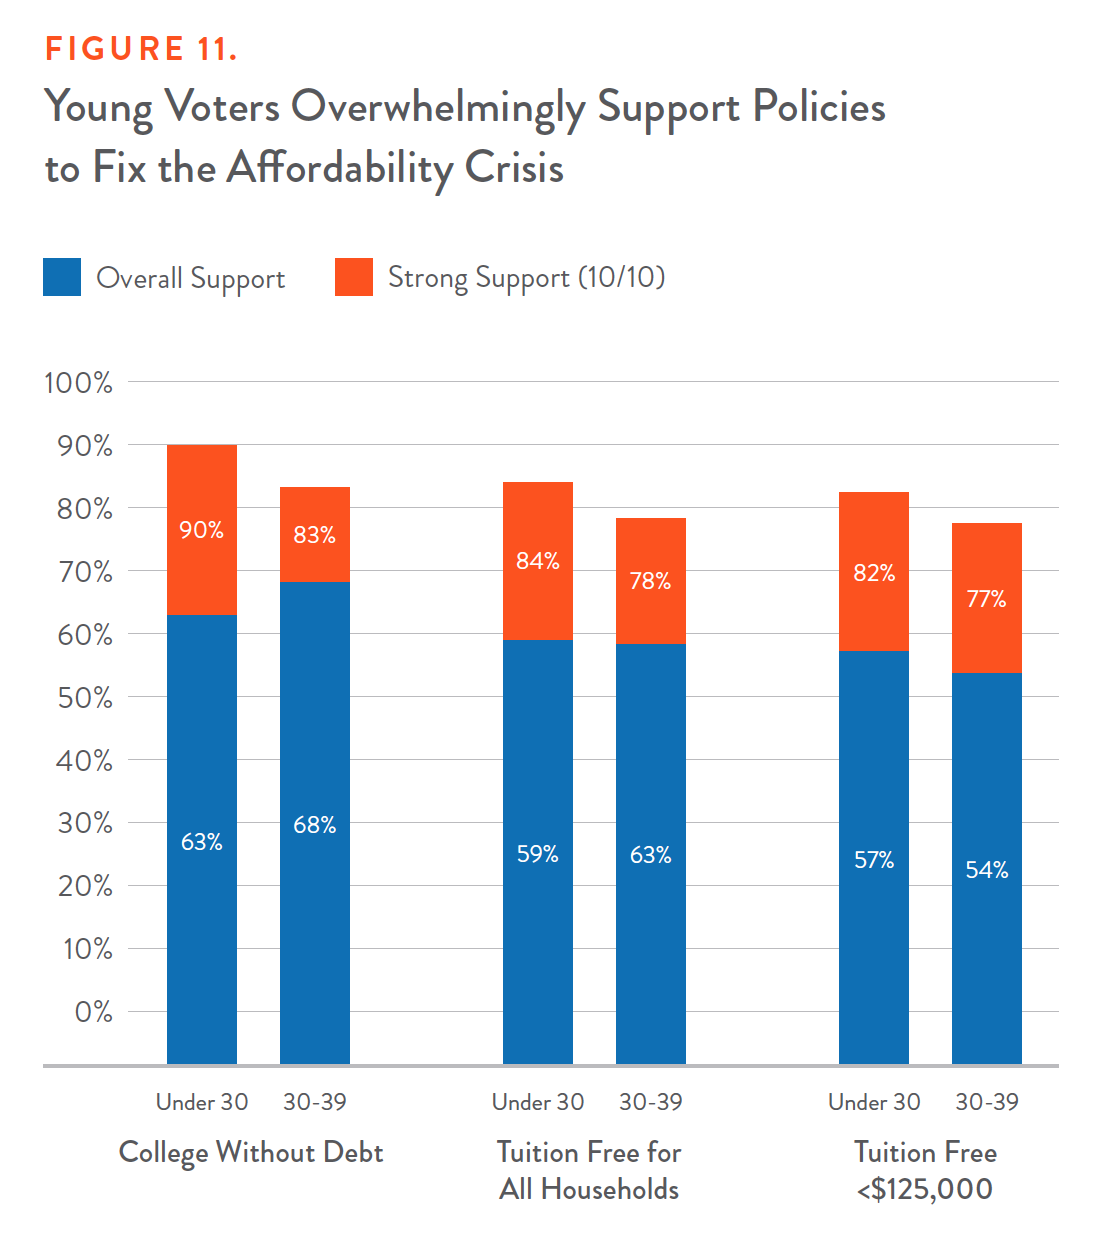
In testing these common college-affordability policies, we found that a guarantee of college without debt is wildly popular with voters of color, young voters, and working-class voters. So too were policies that guarantee free tuition for all families at public 2- and 4-year colleges—in fact, guaranteeing free tuition for all was more popular than creating a $125,000 income cap. Those most affected by the affordability crisis unsurprisingly are most enthusiastic about fixing it. Seventy-two percent of African-American voters, for example, gave a policy of college without debt a 10 out of 10, while 86 percent in general favor such a policy. Ninety percent of voters under 30 favor college without debt.
Figure 10 shows how black, Latino, and Asian/Pacific Islander voters respectively rated the 3 propositions.
Figure 11 illustrates the overwhelming support that young voters demonstrated for all 3 policies.
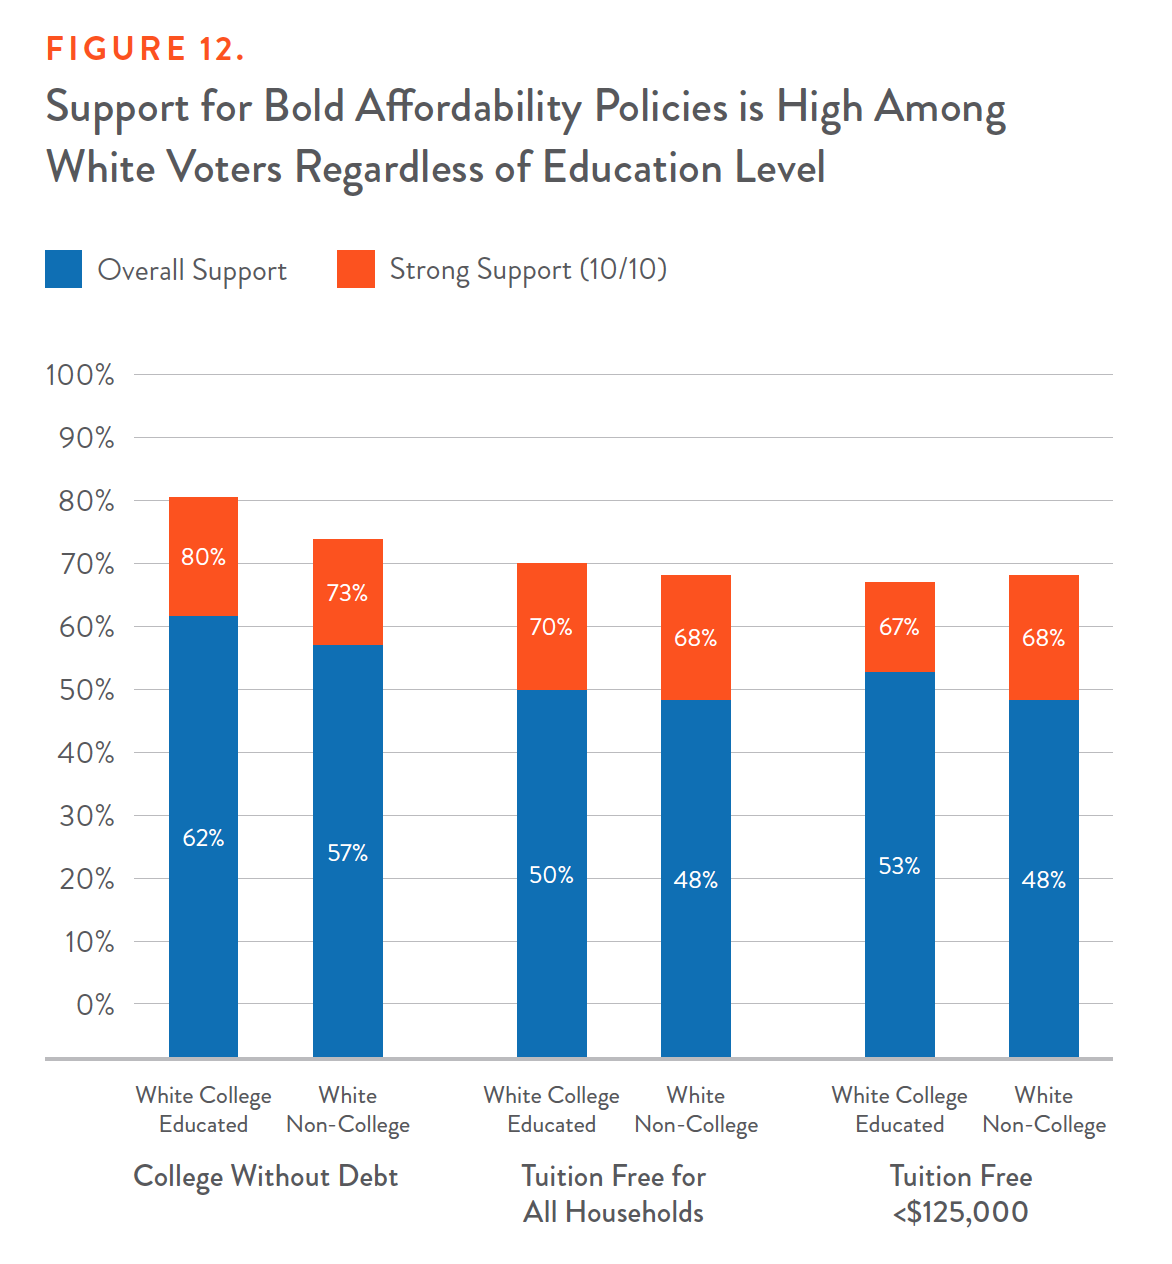
And Figure 12 reflects strong support for college-affordability policies among white voters, including those who did not receive a college education themselves.
The results of the focus groups and message-testing yielded important insights for those serious about making the political case. In general, we found that messages around the public good and the ability to pursue one’s dreams, as well as messages that painted education as a universal good worth investing in, resonated strongly. These messages, which see education as a worthy public investment, were consistently more salient than the common refrain around college as an individual benefit and typical arguments blaming government for the student loan crisis. In short, people believe in education as a core value and are offended that students have to contend with burdensome debt just achieve it.
Messaging Recommendations on College Affordability and the Public Good
Lead with Values: Connect on the core value of our responsibility to future generations.
Education is the road to a better life.
Everyone should have the opportunity to complete 2- or 4-year public college educations without ending up in huge debt.
Define the Problem and Focus on the cost of as the largest barrier to completing a program.
Affordable college only exists today for wealthy people.
Affording college should not have to be this hard.
The barrier of burdensome debt holds back an entire generation from pursuing their dreams.
Provide a Call to Action
We need to ensure all children can pursue their education without the burden of debt that holds them back.
We need to recommit to higher education, better fund public colleges, and reduce the burden of debt.
State government should try to make it easier for more people to attend and invest to make it affordable.
Demos and Lake Research Partners, 2018
Messaging Recommendations on College Affordability
Say
Instead Of
Why?
Ability to
pursue dreams
Ability to succeed
Values driven, more aspirational, less transactional, and better positions debt as a barrier in a broader context.
We all benefit
Our economy benefits, our country benefits, healthier democracy
They are all good, but saying we all benefit connects with solutions on individual and societal levels rooted in fairness and equality
Without debt
Debt free
Better positions debt as a barrier and doesn’t raise tax sensitivities. Stronger language with base and persuadable audiences.
People who are qualified and
want to go
qualified “and who work hard”
Evoking hard work puts debate in frame that this is only about personal responsibility and can obscure from debt as a barrier.
Sliding scale based
on income
Aid for neediest families
Provides an objective measure of fairness.
Education after high school
A college degree
When talking about keys to success we want to be broader than just college. People see a role in multiple forms of education in helping people succeed.
Debt keeps education out of reach for too many
Debt contributes to worsening inequality
Make this about people and the pursuit of their dreams, not a more abstract political and economic discussion.
Demos and Lake Research Partners, 2018
Winning Messages on College Affordability
The following messages resonated strongly with respondents, particularly among groups who are more worried about college affordability, have debt of their own, and are women or people of color. They also resonated strongly with groups that closely reflect the general public, which sees a role for government to invest and make it easier for those to attend college.47 These messages were unique, but all invoked aspirations and a sense of fairness or the common good.
Message 1: We All Benefit
The more America puts into its people, the more it gets back. We came together to make K-12 free to all, to build community colleges, and to provide soldiers with a college education after WWII. These decisions helped us build the greatest middle class ever. But today, right when a college degree is more important than ever, our leaders have backtracked on commitments for public colleges. It is time to recommit, so everyone can get a college degree without the burden of student loan debt. We need to ensure America is a land where all can dream big, develop the potential of our people, and realize our greatest aspirations, and that means making our public 2- and 4- year colleges affordable to all of us.
Message 2: Financial Consequences
A college degree is an important first step for many people to pursue their dreams, but today too many people have burdensome education debt, preventing them from even getting by, much less getting ahead or saving for the future. If we made sure people could work their way through college again, Americans would be able to save, start a business, start a family, buy a home, or simply pay their bills. No one ever said getting ahead would be easy, but burdensome debt from loans make it needlessly hard for many young people. We need to reduce the burden of student loan debt and make it easier for students to work hard toward pursuing their dreams and achieving financial security and peace of mind.
Message 3: Invoking Populism, Dreams, and Inequality
Today there are two Americas: one for the wealthy and one for the rest of us. In the wealthy America, there are elite private colleges and the comfort of knowing your kids can dream big and achieve success. For those struggling, wages stay the same or barely rise and there are endless worries your kids won’t do better. Education has always been the road to a better life, but today, affordable college often only exists for wealthy people. Public colleges should be as good as private colleges, without generating a crippling amount of debt that holds many people back. We must enable all our children to pursue a college education without the burden of debt. The full benefits of achieving a college education should be available to everyone, not just the wealthy few.
Appendix Tables
Appendix Table 1. Percent of Graduates with Debt, 2016
Race/Ethnicity
Public 2-Year
Public 4-year
Private Non-Profit
4-year
For-Profit
4-Year
White
45%
68%
69%
85%
Black or African American
58%
82%
87%
90%
Hispanic or Latino
26%
61%
72%
84%
Asian
19%
42%
43%
82%
American Indian or Alaska Native
N/A
76%
68%
87%
More than one race
39%
73%
66%
88%
Never Received Pell
27%
49%
52%
59%
Received Pell
50%
81%
88%
94%
Source: Demos Calculations from U.S. Department of Education, National Center for Education Statistics, 2015-16 National Postsecondary Student Aid Study (NPSAS:16). Data for Native Hawaiian/Other Pacific Islanders not available due to small sample size.
Source: Demos Calculations from U.S. Department of Education, National Center for Education Statistics, 2015-16 National Postsecondary Student Aid Study (NPSAS:16). Some data for American Indian as well as Native Hawaiian/Other Pacific Islanders not available due to sample size
Appendix Table 3. Net price after grants as percent of income (Bachelor's Degree Programs), 2016
Public
Private Non-Profit
For-Profit
Total
43%
45%
59%
White
38%
39%
54%
Black or African American
54%
56%
66%
Hispanic or Latino
47%
54%
61%
Asian
52%
56%
63%
American Indian or Alaska Native
44%
46%
61%
Native Hawaiian/other Pacific Islander
42%
N/A
51%
More than one race
47%
50%
60%
Never received a Pell Grant
29%
34%
35%
Low-Income (Received a Pell Grant)
56%
58%
67%
Source: Demos Calculations from U.S. Department of Education, National Center for Education Statistics, 2015-16 National Postsecondary Student Aid Study (NPSAS:16).
Appendix Table 4. Net price after grants as percent of income (Certificate and Associate Degree Programs), 2016
Public
For-Profit
Total
37%
71%
White
34%
65%
Black or African American
44%
76%
Hispanic or Latino
38%
74%
Asian
41%
73%
American Indian or Alaska Native
39%
80%
Native Hawaiian/other Pacific Islander
37%
82%
More than one race
44%
77%
Never received a Pell Grant
28%
48%
Low-Income (Received a Pell Grant)
44%
76%
Source: Demos Calculations from U.S. Department of Education, National Center for Education Statistics, 2015-16 National Postsecondary Student Aid Study (NPSAS:16).
Analysis from SHEEO Data. All figures are adjusted for inflation using the Higher Education Cost Adjustment index
Appendix Table 6. Student Share of of Public Higher Education Revenue, 1982-2017
1982
1992
2001
2008
2017
Alabama
27.2%
37.5%
41.8%
41.9%
67.5%
Alaska
8.3%
16.4%
20.8%
25.2%
30.8%
Arizona
21.4%
29.7%
31.9%
36.4%
63.1%
Arkansas
26.7%
31.0%
26.4%
35.7%
48.2%
California
9.3%
13.7%
10.2%
13.9%
20.0%
Colorado
37.8%
45.6%
45.0%
57.0%
69.9%
Connecticut
18.8%
27.0%
32.0%
39.4%
53.1%
Delaware
35.7%
52.1%
53.9%
60.8%
74.5%
Florida
20.4%
23.6%
27.5%
21.3%
33.5%
Georgia
18.7%
26.3%
17.4%
19.9%
37.7%
Hawaii
6.8%
10.1%
19.6%
21.7%
29.7%
Idaho
15.7%
14.8%
18.9%
19.4%
32.8%
Illinois
17.8%
20.3%
18.6%
30.8%
32.1%
Indiana
31.6%
37.2%
41.4%
51.9%
61.6%
Iowa
25.3%
32.9%
35.2%
48.3%
61.6%
Kansas
21.4%
27.8%
28.4%
39.4%
53.3%
Kentucky
23.8%
29.7%
29.8%
36.8%
50.3%
Louisiana
18.2%
35.6%
26.3%
24.2%
51.3%
Maine
35.5%
32.8%
35.5%
49.9%
54.3%
Maryland
27.9%
37.9%
37.2%
44.9%
48.8%
Massachusetts
26.8%
39.1%
29.0%
40.3%
43.6%
Michigan
33.1%
40.4%
40.3%
57.1%
69.7%
Minnesota
20.1%
28.4%
28.6%
43.8%
56.0%
Mississippi
26.2%
37.8%
27.6%
36.9%
50.5%
Missouri
26.4%
37.2%
27.5%
40.8%
47.6%
Montana
16.9%
23.2%
42.9%
49.6%
53.4%
Nebraska
22.9%
26.4%
32.8%
34.7%
40.8%
Nevada
23.4%
15.4%
24.2%
22.6%
38.1%
New Hampshire
57.6%
61.0%
65.2%
70.5%
78.8%
New Jersey
21.4%
27.9%
39.2%
45.8%
60.1%
New Mexico
14.6%
8.5%
11.1%
17.5%
28.7%
New York
19.5%
24.7%
29.6%
30.0%
36.5%
North Carolina
16.1%
19.5%
18.9%
23.1%
34.8%
North Dakota
23.9%
32.8%
40.4%
51.6%
47.9%
Ohio
35.0%
43.4%
40.3%
53.7%
58.7%
Oklahoma
15.3%
21.3%
21.3%
31.5%
51.7%
Oregon
28.3%
29.7%
35.9%
46.9%
57.0%
Pennsylvania
35.8%
45.2%
48.7%
57.1%
72.8%
Rhode Island
26.0%
46.9%
44.0%
51.4%
59.7%
South Carolina
25.5%
35.3%
38.1%
48.1%
65.2%
South Dakota
32.4%
38.4%
46.0%
51.1%
65.1%
Tennessee
27.6%
30.7%
33.6%
32.6%
46.6%
Texas
14.9%
23.2%
34.0%
34.2%
40.7%
Utah
21.0%
26.5%
26.6%
33.5%
46.2%
Vermont
63.1%
67.0%
76.1%
81.1%
86.6%
Virginia
26.6%
39.1%
32.3%
47.7%
61.9%
Washington
22.1%
21.2%
23.6%
29.9%
43.0%
West Virginia
20.7%
40.5%
39.2%
45.2%
63.9%
Wisconsin
27.2%
30.7%
27.5%
37.1%
50.9%
Wyoming
12.0%
14.6%
27.0%
14.9%
14.7%
U.S. Average
22.1%
28.8%
29.4%
35.8%
46.4%
Demos Analysis from State Higher Education Executive Officers 2017 State Higher Education Finance Report. All figures are adjusted for inflation using the Higher Education Cost Adjustment index
2D. Deming and Susan Dynarski, “College Aid,” in Targeting Investments in Children: Fighting Poverty When Resources Are Limited (Chicago: University of Chicago Press, 2010); and Judith Scott-Clayton, “The Role of Financial Aid in Promoting College Access and Success: Research Evidence and Proposals for Reform,” Journal of Student Financial Aid 45, no. 3 (November 2, 2015): 6–22. https://publications.nasfaa.org/cgi/viewcontent.cgi?referer=https://www.google.com/&httpsredir=1&article=1586&context=jsfa.
3Sara Goldrick-Rab, Doug Harris, Robert Kelchen, and James Benson, “Need-Based Financial Aid and College Persistence Experimental Evidence from Wisconsin” (October 10, 2012). https://ssrn.com/abstract=1887826 or http://dx.doi.org/10.2139/ssrn.1887826.
5Eric Bettinger, “Need-Based Aid and College Persistence: The Effects of the Ohio College Opportunity Grant,” Educational Evaluation and Policy Analysis, (May 2015), Vol. 37, No. 1S, pp. 102S–119S http://journals.sagepub.com/doi/pdf/10.3102/0162373715576072.
6D. Allen and G. C. Wolniak, “Exploring the Effects of Tuition Increases on Racial/Ethnic Diversity at Public Colleges and Universities. Research in Higher Education” (2018), doi:10.1007/s11162-018-9502-6.
7A. Boatman, B. J. Evans, and A. Soliz, (2017), “Understanding Loan Aversion in Education” AERA Open, 3(1), 233285841668364. doi:10.1177/2332858416683649.
12Michael Hout, “Social and Economic Returns to College Education in the United States,” Annual Review of Sociology 38, no. 1 (2012): 379-400. doi:10.1146/annurev.soc.012809.102503.
13Walter W. McMahon, Higher Learning, Greater Good: The Private and Social Benefits of Higher Education (Baltimore: Johns Hopkins University Press, 2009) https://muse.jhu.edu/.
15Analysis from data the State Higher Education Executive Officers Association, “State Higher Education Finance 2017,” http://www.sheeo.org/projects/shef-%E2%80%94-state-higher-education-finance.
17Timothy J. Bartik, Brad J. Hershbein, Marta Lachowska, The Effects of the Kalamazoo Promise Scholarship on College Enrollment, Persistence, and Completion, Upjohn Institute for Employment Research Working Paper 15-229, 2017, http://research.upjohn.org/cgi/viewcontent.cgi?article=1246&context=up_workingpapers.
25Benjamin I. Page, Larry M. Bartels, and Jason Seawright, “Democracy and the Policy Preferences of Wealthy Americans,” Perspectives on Politics 11, no. 1 (2013): 51–73. doi:10.1017/S153759271200360X.
34Don E. Heller and Patricia Marin (Eds.), Who Should We Help? The Negative Social Consequences of Merit Scholarships (2002, Cambridge, MA: The Civil Rights Project at Harvard University).
46Lake Research Partners conducted 5 focus groups in October and November 2017. Groups were conducted on October 23rd in Orlando, Florida among mixed-race and mixed-gender parents of kids ages 14 to 17 who plan on attending college and among mixed-gender Latinos; on October 26th in Dallas, Texas among millennials who have education debt; and on November 1st in Cincinnati, Ohio among mixed-gender noncollege-educated conservative white people with annual household incomes under $75,000. Lake Research Partners also conducted an online dial survey of 1,000 adults nationwide, with oversamples of 150 African Americans, 150 Latinos, and 100 Asian Americans. The survey was conducted between January 2nd and January 10th, 2018. Data were weighted slightly by age, gender, region, and educational attainment to reflect the attributes of the population. The margin of error for the overall survey is +/- 3.1%, for the African-American and Latino oversamples is +/- 8%, and for the Asian-American oversample is +/- 9.8%.
47For this research, Lake Research Partners created groups of respondents based on an index of support for various policies. Those considered “Base” respondents comprised 27% of adults. They strongly favor every policy to make it easier to pursue an education without debt, are worried about the next generation’s ability to afford college and are more likely to have student debt themselves or for a child and are more likely to be women, people of color, and Democrats. “Opposition” respondents comprised 11% of adults. They strongly oppose policies to make it easier to pursue and education without debt, believe it is up to the individual to pay for college and that it is possible for students today to work their way through college. They are more likely to be men, over 65, white, and Republicans. “Persuadable” respondents comprised 63% of adults. They are generally favorable toward policies that would make it easier to pursue an education without debt and see a role for government to invest and make it easier for people to attend public 2- and 4-year colleges. They more closely reflect demographics of the general public