Introduction
As student debt continues to climb, it’s important to understand how our once debt-free system of public universities and colleges has been transformed into a system in which most students borrow, and at increasingly higher amounts. In less than a generation, our nation’s higher education system has become a debt-for-diploma system—more than seven out of 10 college seniors now borrow to pay for college and graduate with an average debt of $29,400. Up until about two decades ago, state funding ensured college tuition remained within reach for most middle-class families, and financial aid provided extra support to ensure lower-income students could afford the costs of college.
As Demos chronicled in its first report in The Great Cost Shift series, this compact began to unravel as states disinvested in higher education during economic downturns but were unable, or unwilling, to restore funding levels during times of economic expansion. Today, as a result, public colleges and universities rely on tuition to fund an ever-increasing share of their operating expenses. And students and their families rely more and more on debt to meet those rising tuition costs. Nationally, revenue from tuition paid for 44 percent of all operating expenses of public colleges and universities in 2012, the highest share ever. A quarter century ago, the share was just 20 percent. This shift—from a collective funding of higher education to one borne increasingly by individuals—has come at the very same time that low- and middle-income households experienced stagnant or declining household income.
The Great Recession intensified these trends, leading to unprecedented declines in state funding for higher education and steep tuition increases:
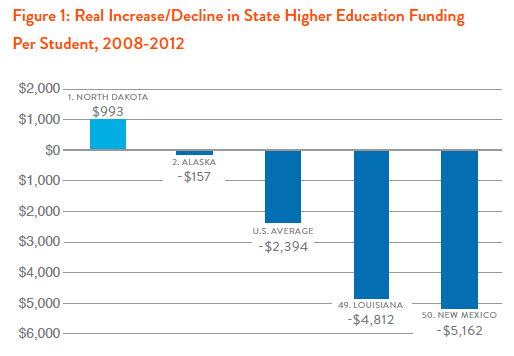
NATIONWIDE CUTS: 49 states (all but North Dakota) are spending less per student on higher education than they did before the Great Recession. In contrast, only 33 states cut per-student spending between 2001 and 2008, the period since the last recession.
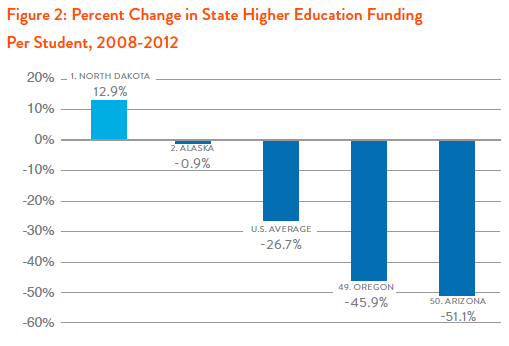
MANY DEEP CUTS: In many states, the cuts have been especially deep. Since the recession, 28 states have cut per-student funding by more than 25 percent, compared to just one state—Michigan—that did so between 2001 and 2008.
ESCALATING TUITION: Funding cuts have led to large tuition increases. Nationally, average tuition at 4-year public universities increased by 20 percent in the four years since 2008 after rising 14 percent in the four years prior. In seven states, average tuition increased by more than a third, and two states—Arizona and California—have raised it by more than two-thirds, or 66 percent. At public 2-year colleges, average tuition has risen by more than a third in six states.
FAMILIES PRICED OUT: Average tuition at 4-year public schools now consumes more than 15 percent of the median household income in 26 states. Average total cost—including room and board—consumes more than one-third of the median household income in 22 states.
The decreasing affordability of higher education is eroding the last relatively secure path into the middle class, as more students take on larger amounts of debt to finance their higher educations, or forego it altogether. With $1.2 trillion in outstanding student loan debt and climbing, student loan debt is now substantial enough to affect our overall economy as indebted graduates find it harder to buy a home or a car.
This brief updates our previous analysis of state funding trends by examining trends in state funding and tuition since the Great Recession.
State Cuts to Higher Education: How Much and Why?
Every state but one—North Dakota—has cut per-student funding since the Great Recession in order to help close wide budget gaps. Nationwide, these cuts have averaged $2,394 per student, or 27 percent. As Figure 1 and Figure 2 show, the magnitude of the cuts varies widely from state to state. However, most states have made deep cuts to higher education funding: 29 states have cut funding by more than $2,000 per student, resulting in a national average cut in funding of more than 25 percent.
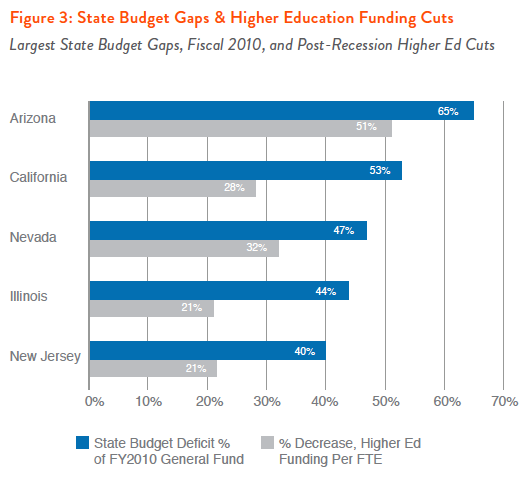
Higher education cuts triggered by the Great Recession were closely linked to state budget gaps. As Figure 3 shows, Arizona, California, and Nevada had the three largest deficits, and also made some of the largest higher education cuts, as well. The budget gaps, in turn, were significantly linked to the housing crisis. Declines in housing prices were the most severe in Arizona, California, Nevada, and Florida. All of the hardest-hit states raised taxes after the Great Recession, but none raised them enough to close their entire gap, making higher education cuts all but inevitable.
The Effects of State Higher Education Cuts
Historically, public colleges and universities get nearly all of their revenue from state and local funding and tuition and fees. So, when states cut higher education funding, schools essentially have two options for closing the gap: raise student charges—tuition, fees, room, and board—or cut salaries and services. Most states have chosen to do both since the Great Recession, implementing steep hikes in charges for tuition, room, and board, and cutting thousands of course offerings and positions.
Rising Tuitions
The effect of state cuts on student charges has been especially dramatic. Nationwide, tuition at public 4-year universities has risen by an average of 20 percent, or $1,282, since 2008. The increase in total cost—including room and board—has been even greater, rising by an average of $2,292 over the same period. Tuition at public 2-year schools has increased sharply as well, rising by an average of 18.5 percent, or $414, since 2008.
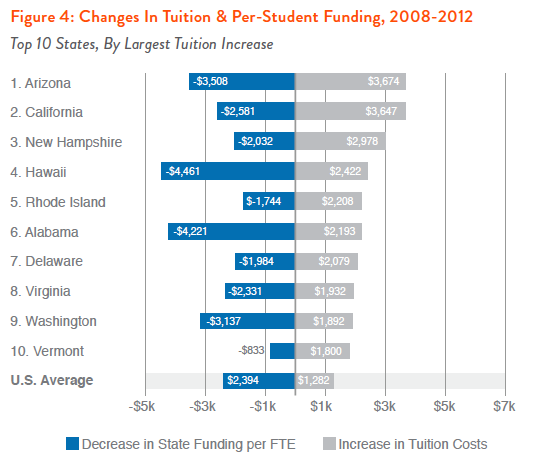
In many states, the tuition increases have far outstripped the national average. Seventeen states have raised tuition prices by more than 20 percent since the Great Recession, and seven states—California, Arizona, Hawaii, Alabama, Georgia, Nevada, and Washington—have seen tuition hikes of one-third or more. The sharp rises in student charges since the Great Recession are closely linked to cuts in state funding for higher education. Figure 4 illustrates this connection, depicting both per-student funding cuts and average increases in tuition in the 10 states with the largest tuition increases since the Great Recession.
Families Can’t Keep Up with Rising Costs
At the same time that states were cutting funding for higher education, families faced their own budget pressures due stagnant or declining incomes. As a result, paying for college requires a much larger share of the typical household’s income in many states. In a fully functioning system, much of this gap in ability to pay would be provided by financial aid and students working in side-jobs to defray costs. What we know, however, is that aid programs, such as federal Pell grants, have lost their purchasing power as a result of rising tuition and a greater number of eligible students. We also know that students are working more hours than ever before and taking on increasing amounts of debt.
The result has been the debt-for-diploma system in which most students fill the gap between what their parents can pay, available grant aid and their earnings from part-time work, by taking on student debt.
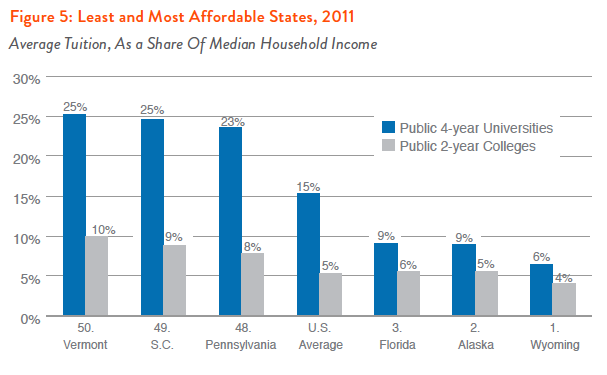
In seven states, tuition consumes more than 20 percent of the state median household income, while it consumes less than 10 percent of median income in five states. Figure 5 illustrates this affordability gap, depicting the most and least affordable states, ranked by the share of median household income consumed by the average 4-year public university tuition in the state.
And as the full tables in the Appendix show, affordability is very closely linked to state funding levels: the five least affordable states—Vermont, South Carolina, Pennsylvania, Michigan, and New Hampshire—were among the lowest third of states in funding per student. Affordability is also closely linked to average student debt: the five least affordable states were all among the upper third of states, ranked by average student debt of graduates.
Conclusion: Returning to a Debt-Free System
Higher education is a true public good—its benefits accrue far beyond the individual who participates directly in the system. This is why, since the founding of public higher education, our nation has moved progressively toward expanding the doors of access. It is no accident that today some of the best state universities are land grant colleges—a legacy from the 1860s when the federal government granted federally controlled land to states to establish public universities and colleges. Over the next century and a half, federal and state policy continually improved to expand access and affordability to those who were left out of the system. But in the last generation, we have moved in the opposite direction. State higher education funding on a per-student basis is lower today than it was in 1980. Federal financial aid no longer provides grants robust enough to defray the rising cost of college: the Pell grant once covered $7 out of every $10 in college costs, today it covers only $3 out of every $10 needed to attend a public college or university.
And so, the costs of funding our higher education system have increasingly been borne by students and their parents, chiefly by going into debt. Yet, higher education remains a public good—with all of us relying and depending on the system not just for the education of doctors, nurses, teachers, accountants and other professionals—but to provide the critical thinking that is the lifeblood of our democracy.
This publication was funded in part by the Kresge Foundation