Introduction
In January 2016, Oregon became the first state in the country to implement Automatic Voter Registration (AVR). AVR increases access to voting by using information already provided to governments in order to add eligible individuals onto the voter rolls. In contrast to current models of self- registration, AVR removes outdated, unnecessary and cumbersome barriers to voting, shifting the burden of voter registration away from individuals and onto government in the process. Under the Oregon AVR program, eligible but unregistered voters found through the state’s Department of Motor Vehicles (DMV) databases are notified by mail that they will be added to the voter rolls, unless they decline registration within 21 days by returning a postcard to the state’s election authorities. For purposes of primary voting, this notification postcard also allows individuals to choose a political party. If no response is given, these individuals become automatically registered as “nonaffiliated” voters, which makes them ineligible to vote in primaries (Oregon has a closed primary system). Automatic address updates and notifications also take place through this system.
Key Facts
• A Significant Share of Individuals Registered Through AVR Voted:
In 2016, 44 percent of those who were automatically registered voted in the November 8th election. Of the individuals who were registered for the first time through Oregon’s AVR law, 36 percent voted in 2016. Notably, automatically registered individuals account for 66 percent of individuals who registered in 2016 and voted. Ninety-five percent of those who were registered with AVR and voted in the 2016 election were first-time voters.
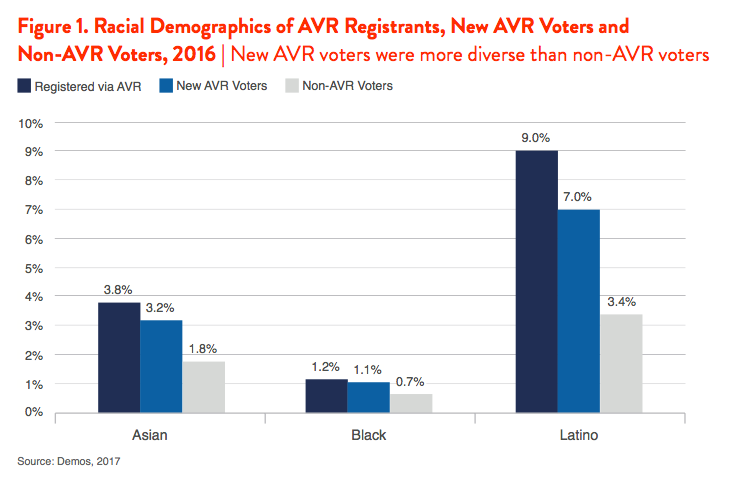
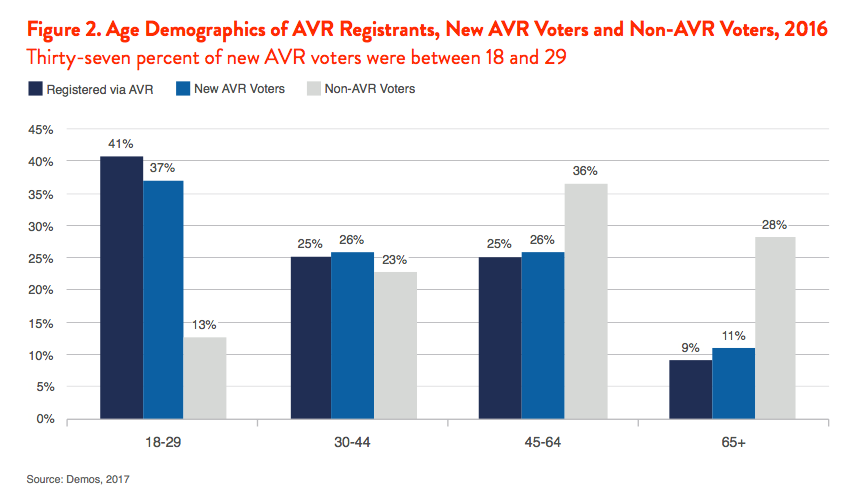
• AVR Increased the Racial and Age Diversity of Oregon’s Voters:
Only 6 percent of the non-AVR voters were people of color, compared with 11 percent of first-time AVR voters and 15 percent of all individuals registered through AVR. While 3 percent of the non- AVR voters were Latino, 7 percent of new AVR voters and 9 percent of those registered with AVR were Latino. Thirty-seven percent of automatically registered persons who voted for the first time in 2016 were between the ages of 18-29, compared to 13 percent of the non- AVR voters. Forty-one percent of individuals registered with AVR were between the ages of 18-29. (See Figures 1 and 2.)
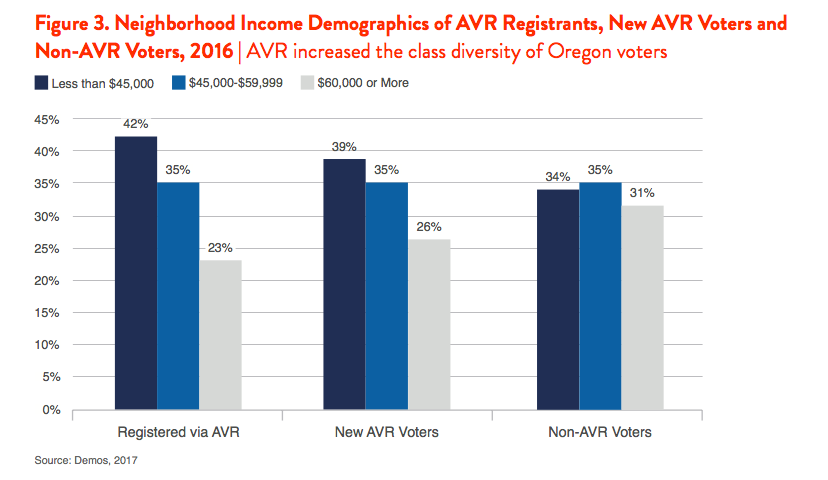
• AVR Increased the Income Diversity of Oregon’s Voters: In a state with a median income of $51,000, 39 percent of new AVR voters lived in census blocks with a median income below $45,000, compared to 34 percent of the non-AVR electorate. Twenty-six percent of new AVR voters lived in neighborhoods with a median income over $60,000, compared with 31 percent of non-AVR voters. (See Figure 3.)
- We Estimate a 2-3 Percentage Point Increase In Turnout Attributable to AVR: Following the implementation of AVR, Oregon’s turnout increased by 4 percentage points, from 64 percent of the voting eligible population (VEP) to 68 percent. The state’s increase in turnout between 2012 and 2016 was higher than that of any other state. Oregon’s registration rate increased from 78 percent of the voting eligible population in 2012 to 85 percent of the VEP in 2016. Automatically registered individuals made up 5 percent of Oregon’s electorate in 2016. We estimate that AVR increased turnout in Oregon by between 2 and 3 percentage points. It is possible that these estimates understate the increase in turnout between 2012 and 2016.
- Individuals Registered via AVR Overwhelmingly Chose to Remain Registered: Only 8 percent of enrollees through AVR decided to opt out of registration. Eleven percent chose a party and 78 percent were automatically registered as Non-Affiliated (the other 3 percent could not be contacted by the Oregon Department of Motor Vehicles).
Methodology
The state of Oregon maintains a list of the individuals who were automatically registered to vote in 2016. We merged these individuals with Catalist, a subscription database with demographic and validated registration and voting history data on more than 260 million American adults. By merging individuals from the Oregon database with Catalist using their voter ID number, we were able to obtain demographic and voting history data for a very large proportion of individuals who were automatically registered (98 percent of the data merged successfully between the Catalist and Oregon voter file data). Some demographic information, such as age, is available on the voter file. Oregon does not include race or ethnicity in its voter files, however. In such cases, Catalist uses a combination of information based on names and local racial/ethnic context to predict an individual’s race or ethnicity. Although the models are not perfect and should be treated with appropriate caution, they have been shown to be quite accurate in large-scale validation using public voter files.
Using the information available, we were able to compare the demographic profiles and voting histories of individuals who were registered through AVR (either for the first time, or because a previous registration had lapsed) to those of Oregon residents with up-to-date registrations prior to implementation of the AVR law. Furthermore, because Catalist stores registration and voting history data from previous election cycles, we could compare registrants under AVR with those who registered to vote in 2012.
Our source of data for the Voting Eligible Population (VEP), which accounts for non-citizens and other people not eligible to vote, comes from Michael McDonald’s United States Election Project. We also use Citizen Voting Age Population (CVAP), which accounts for non-citizens, based on estimates compiled by Bernard Fraga. These data sources are all similar, but have modestly different estimates of turnout and registration rates in the 2016 election. We use VEP when possible because it provides a more accurate picture of the potential electorate, and CVAP when necessary to examine demographic information.
In total, there were 97,184 individuals registered through automatic voter registration who voted in 2016; that year, automatically registered individuals accounted for 5 percent of the electorate. It’s possible that some of these individuals would have voted anyway. The analysis therefore was limited to 88,573 individuals who were registered with AVR and were first-time voters (meaning they don’t have a record of registration going back to 2008) in 2016. These AVR individuals make up 63 percent of those who were first-time registrants and voters in 2016, and 4 percent of the total 2016 electorate.