Summary

Priorities USA is in the midst of a research project analyzing “swing voters” and “turnout voters” in the 2016 election in order to glean lessons that can be applied to strengthen Democrats in elections in 2018, 2020 and beyond. The initial analysis, conducted via polling and focus groups, has now continued with an examination of the impact of voter identification laws.

Voter suppression and strict ID laws are spreading rapidly around the country. For example, according to the Washington Post, “before 2006, no state required photo identification to vote on Election Day. Today 10 states have this requirement. All told, a total of 33 states — representing more than half the nation’s population — have some version of voter identification and suppression rules on the books.”

The central argument for the spread of these laws by its proponents has been that ID laws, and similar repressive voting laws, are necessary to combat voter fraud. However, the evidence is clear that these laws are not only unnecessary but also serve as an obstacle preventing racial and ethnic minorities from participating in their fundamental right to vote and be a part of the democratic process.

And now, although Trump’s presidency has barely begun, his victory and persistent false claims of massive voter fraud are only serving to embolden the efforts of Republican-controlled state legislatures to continue to enact restrictive voting measures for the purposes of suppressing the right to vote – particularly of voters who are unlikely to support them.

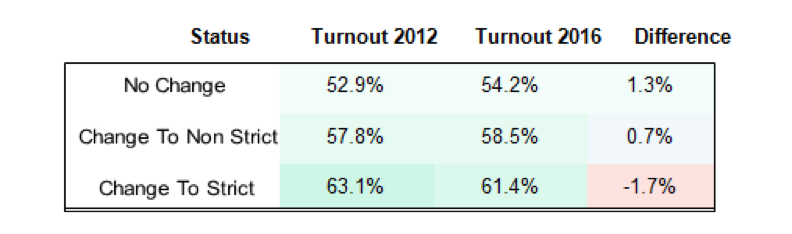
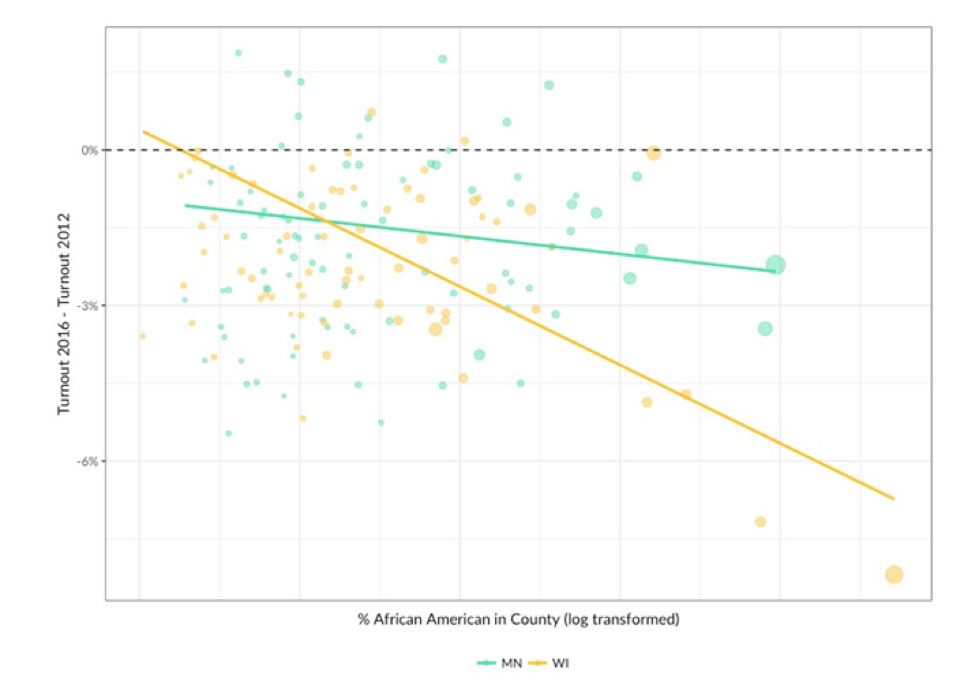
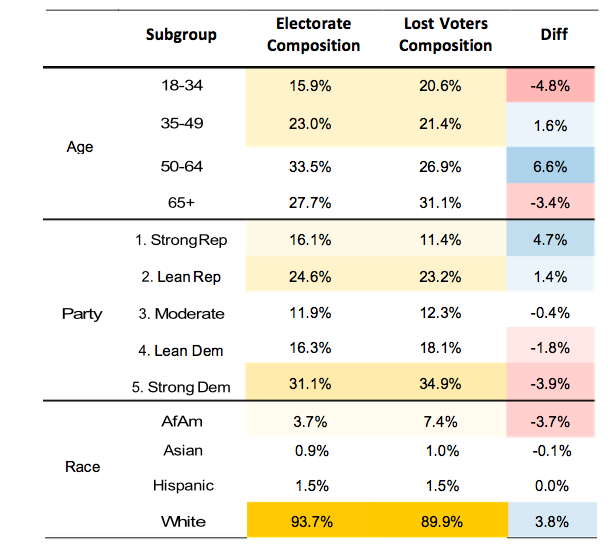
This analysis covers the effects of voter identification laws on voter participation during the 2016 election. Specifically, we find that changing to both “strict” and “non-strict” voter-id laws has a significant negative effect on total voter turnout and that these effects are most severe in African American areas of the country.

As a result, we can say with confidence that adding strict identification requirements had significant negative effects on voter participation during the 2016 election.1 

Effects of Changing ID Laws

Turnout2 was lower in states where ID laws changed – We found that total turnout increased in states where ID laws did not change between the 2012 and 2016 elections, but decreased in states where ID laws changed to strict. Specifically, in states where the voter identification laws did not change between ‘12 and ‘16, turnout was up +1.3%. In states where ID laws changed to non-strict (AL, NH, RI) turnout increased less, and was only up by +0.7%. In states where ID laws changed to strict (MS, VA, WI) turnout actually decreased by - 1.7%. 

Considering the African American Population

Across the board, turnout3 decreased more between 2012 and 2016 in counties4 with higher population percentages of African Americans, but this drop-off in participation was amplified in states that changed voter-ID laws, and was most pronounced in states that changed voter ID laws to strict.

In counties where African Americans make up less than 10% of the population AND there were no changes to voter ID laws, 2016 turnout was up +1.9% from 2012, but in similar <10% African American counties where ID laws changed to be strict, total turnout decreased by -0.7%. In counties where African Americans make up more than 40% of the population, however, 2016 turnout was down -2.2% from 2012 in states where ID laws did not change, but down -5 points in states where ID laws changed to be strict. 

We found that even in Wisconsin -- a largely white state -- voter ID laws disproportionately suppressed turnout among communities of color. Across the board, turnout was down from 2012 among counties with higher percentages of African-Americans. This decrease was expected, as 2012 turnout was especially high in these counties in the election of Barack Obama. Yet by comparing these county decreases in Wisconsin, where voter ID laws changed to strict, to Minnesota, a demographically similar state where voter ID laws did not change, we found that turnout in African- American counties dropped off at significantly higher levels than in their Minnesota- counterparts. While our previous analysis already suggests that voter identification laws had a suppressive effect on 2016 turnout, this significant drop- off demonstrates the particularly suppressive effects the stricter laws had on African-American counties in Wisconsin. 

Wisconsin and the “Lost Voters”

While states with no change to voter identification laws witnessed an average increased turnout of +1.3% from 2012 to 2016, Wisconsin’s turnout (where voter ID laws changed to strict) dropped by -3.3%. If turnout had instead increased by the national- no-change average, we estimate that over 200,000 more voters would have voted in Wisconsin in 2016. For context, Clinton lost to Trump in Wisconsin by only 20,000 votes. 

In order to better understand who these theoretical 200,000 lost voters were, we identified high propensity voters registered in Wisconsin (who had voted in 2012 and 2014) who were still alive in 2016 but did not cast a vote. We then compared their demographic make-up to that of the Wisconsin electorate, and found that the lost voters skewed more African-American and more Democrat.

For example, Wisconsin’s 2016 electorate was 6.1% more Republican, and 5.7% less Democrat, than the group of ‘lost voters’. Furthermore, the WI electorate was 3.7% more White and 3.8% less African American than the group of ‘lost voters.’ This analysis suggests that the 200,000 lost voters would have both been more racially diverse and have voted more Democratic. 

Conclusion

Our analysis demonstrates that voter ID laws had a suppressive effect on voter turnout in the 2016 election. We found that turnout decreased significantly more in states where voter identification laws changed to strict, and that these strict laws disproportionately affected African-American counties. If states where voter ID laws became stricter between 2012 and 2016 had increased turnout by the same rate as that of states where there were no voter ID law changes, we estimate that over 400,000 more voters in the six states (AL, MS, NH, RI, VA, WI) would have cast their ballots in the 2016 election. Moreover, we estimate that at 200,000, nearly half of the national lost voters are from Wisconsin, where Hillary Clinton lost by only 20,000 votes. Finally, we find that lost voters tend to skew more African- American and more Democrat. These findings suggest that voter identification laws not only have a suppressive effect on voter turnout, but on specifically African-American turnout and on Democratic vote share. 


NOTES:

1 For the purposes of this memo, "strict" refers to states where voters without the acceptable ID must vote on a provisional ballot and take additional steps after Election Day for it to be counted (GA, IN, KS, MS, TN, VA, WI, AZ, ND, OH) and "non-strict" refers to states where voters without acceptable identification have the option to cast a ballot that will be counted without further action post- election day (AR, AL, FL, ID, LA, MI, RI, SD, TX, AK, CO, CT, DE, HI, KY, MO, MT, NH, OK, SC, UT, WA). 

2 Here, turnout is calculated on a state-level as the number of highest-office ballots divided by the VAP, as recorded by the United States Election Project: http://www.electproject.org/.

3 To calculate a county-level estimate of turnout, we divided raw D+R votes in each county by a county-level VAP estimate. Each county-level VAP estimate was calculated by multiplying the county’s share of the state’s population (based on 2010 census records) by the VAP in the relevant election year, as recorded by the United States Election Project.

4 County-level analysis excludes Alaska and Washington, D.C.