From the time a baby is born, American families are trapped between the need to provide care for their children and the necessity of earning income. The crisis of care is most acute when children are too young to be in school: we find that families with children under age 5 have significantly lower incomes and higher poverty rates than households with no children at all. Yet incomes rise and poverty rates fall once the youngest child reaches kindergarten age and universal schooling is available to help families meet childcare obligations.
This report looks more closely at the economic conditions facing parents of young children. We explore the demographics and economic data on households with children under 5 and use regression analysis to examine the differences between households with young children, those with no children, and households where all children have reached school age (see the appendix for details on the regression analysis). We consider the especially difficult circumstances facing single parents—particularly single mothers—and parents of color. And we investigate how policies in the workplace and the larger economy—including unstable work schedules, a lack of paid leave, low pay, employment discrimination, and a severe shortage of high-quality, affordable childcare—exacerbate the pressures that leave parents trapped. Finally we discuss the actions both private employers and public policymakers can take to better support families with young children and enable hard-working parents to escape this trap and raise their families without facing severe hardship. Among our findings:
- Families with children under 5 have substantially lower incomes than households without children, even after controlling for differences in age, partnership status, education, and race.
- The drop in income associated with having a young child is $14,850 for households with two adults, after controlling for other factors. This is equivalent to 14 percent of household income.
- For single women, the drop in income associated with having a young child is $16,610, after controlling for other factors. Since single women have significantly lower incomes, on average, this is equivalent to 36 percent of household income.
- Declines in income, combined with an increased family size, are enough to throw many families into poverty.
- Single mothers with young children are 15 percent more likely to live in poverty than single women without children, after controlling for other factors.
- Partnered mothers and fathers with young children face poverty rates about 3 percent higher than their counterparts with no children, after controlling for other factors.
- Decreased employment and labor force participation among mothers explain much of the income drop associated with having a young child.
- Having a young child has the strongest effect on whether mothers who live with a partner are in the labor force: after controlling for other factors, their labor force participation is 19 percent lower than partnered women without children.
- This effect is magnified for mothers of young children with less education: after controlling for other factors, mothers with a high school diploma or less who live with a partner are 21 percent less likely to be in the labor force than their counterparts without children.
- With no partner to help provide income, single parents have higher labor force participation than partnered parents when their children are under 5, yet they face unstable employment. Single mothers of young children contend with a 16 percent unemployment rate, after controlling for other factors, with even higher unemployment rates among single mothers of color and those with less education.
- As children reach school age, the trap that grips parents of young children eases: labor force participation and incomes rise for virtually all parents, while unemployment and poverty rates fall.
- Mothers living with a partner, who were disproportionately likely to leave the workforce when their children were young, are more likely to return once their youngest child is old enough for kindergarten.
- For parents living with a partner, having the youngest child reach age 5 increases household income by $30,440, after controlling for other factors.
- For single mothers, household income increases by $9,980 once children are
old enough for school, after controlling for other factors. Accordingly, single mothers of school-age children are 6 percent less likely to be in poverty than their counterparts with children under 5, after controlling for other factors.
- Both private employers and public policymakers must take action to better support families with young children, addressing the lack of paid leave, low-paying jobs, irregular work schedules, employment discrimination and shortage of quality, affordable childcare that trap parents between the need to provide care for their children and the need to earn income to support them.
The Parent Trap: Earning Income and Providing Care
Being a good parent is always a challenging job. Striving to provide the next generation with the opportunity to succeed, parents offer their love, support, encouragement, and guidance. Yet working parents in America also face an additional set of challenges: from the time a baby is born, families are trapped between the need to provide care for their children and the need to earn income. The crisis of care is most acute when children are too young to be in school: families with children under age 5 have significantly lower incomes and higher poverty rates than households with older children or none at all. Unstable work schedules, a lack of paid leave, low pay, and a severe shortage of high- quality, affordable childcare compound the strain on American parents.
This report looks more closely at the economic conditions that trap the parents of young children between supporting their families and providing care. We explore the demographics and empirical economic data on households with children under 5 and use regression analysis to examine the differences between households with young children, those with no children, and households where all children have reached school age (see the appendix for details on the regression analysis). We consider the especially difficult circumstances facing single parents—particularly single mothers—and parents of color. And we investigate how policies in the workplace and the larger economy exacerbate the pressures that leave parents trapped. Finally, we discuss the actions both private employers and public policymakers can take to better support families with young children and enable hard-working parents to escape the trap and raise their families without facing severe hardship.
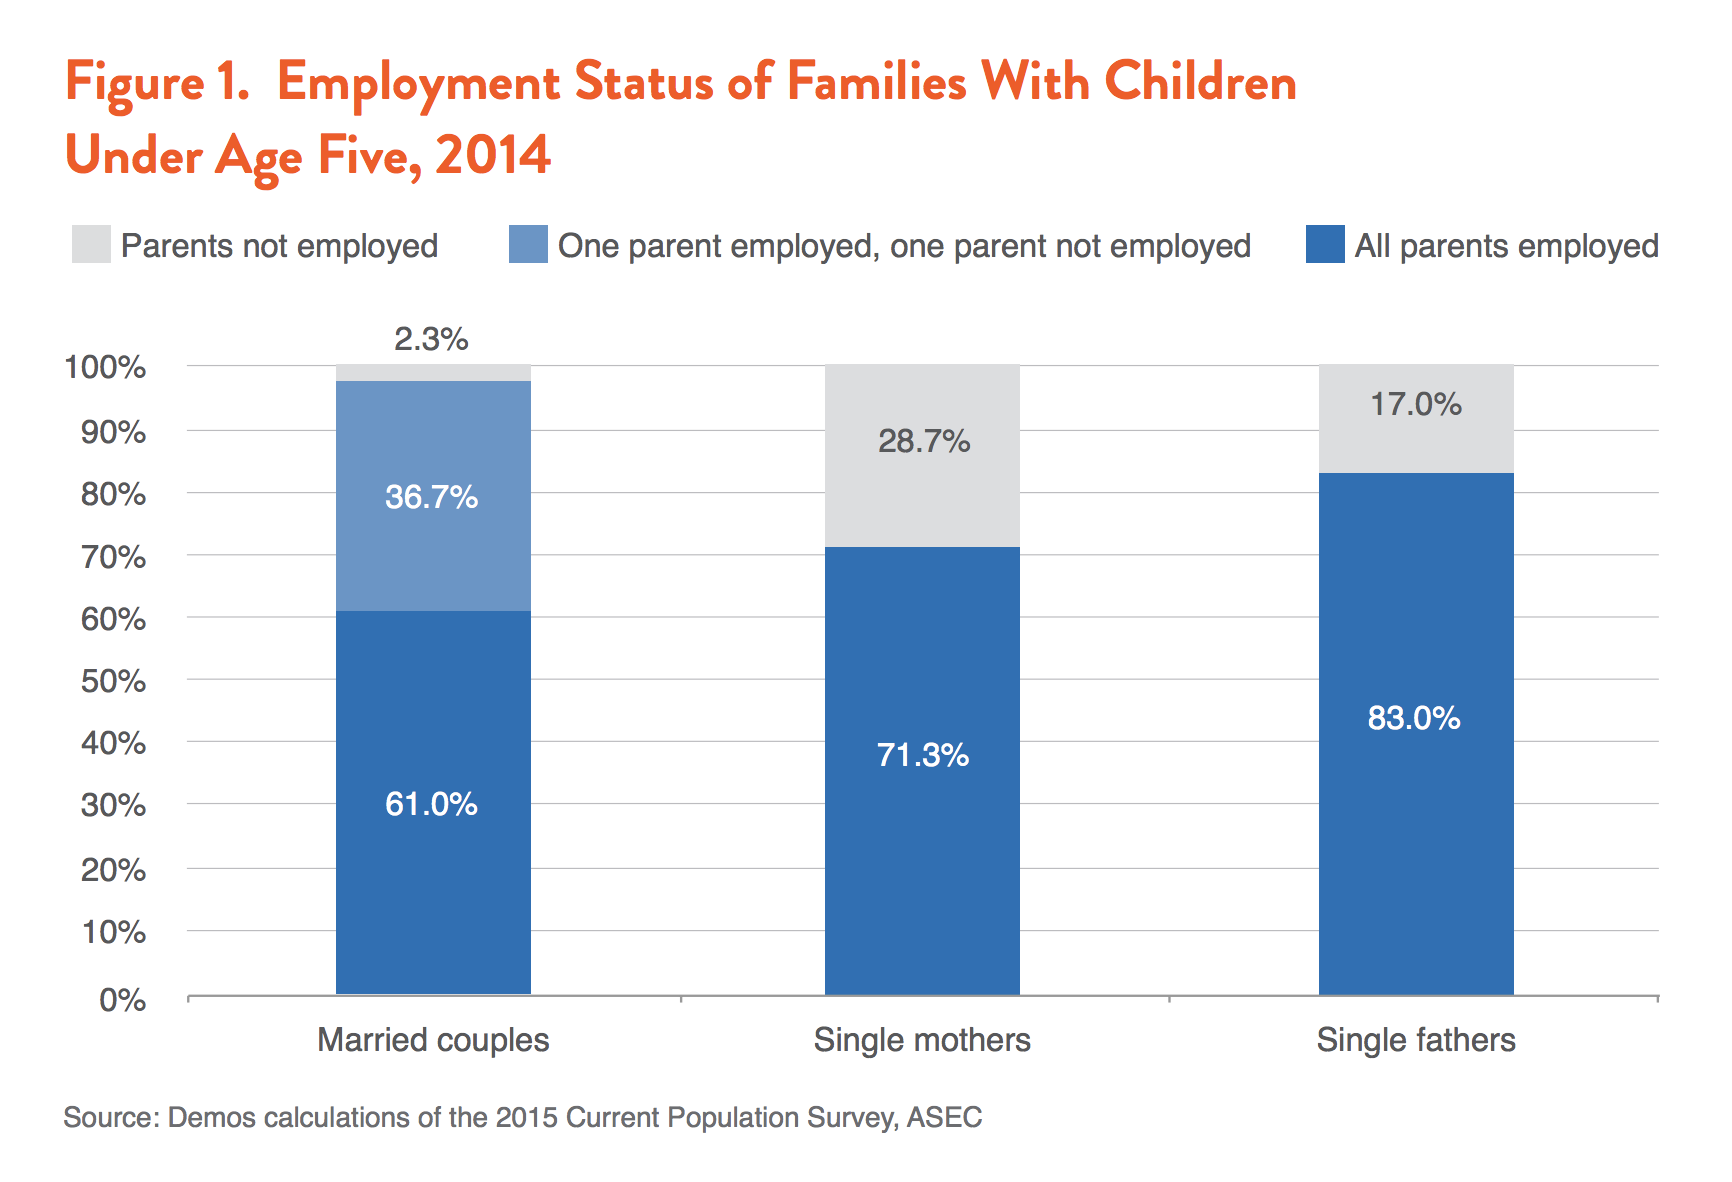
The reality today is that most parents must work even when their children are young. As growing numbers of women have entered the workforce in recent decades, families increasingly depend on the incomes of all working-age adults in the household. In nearly 2 out of 3 families with a child under age 5, all parents in the household are employed. As Figure 1 shows, the proportions are even higher in households headed by single mothers and fathers. In nearly 4 out of 10 households with children, mothers earned half or more of family income. A majority of mothers with infants under a year old worked outside the home in 2014, and more than two-thirds of mothers worked outside the home before their children reach school age.
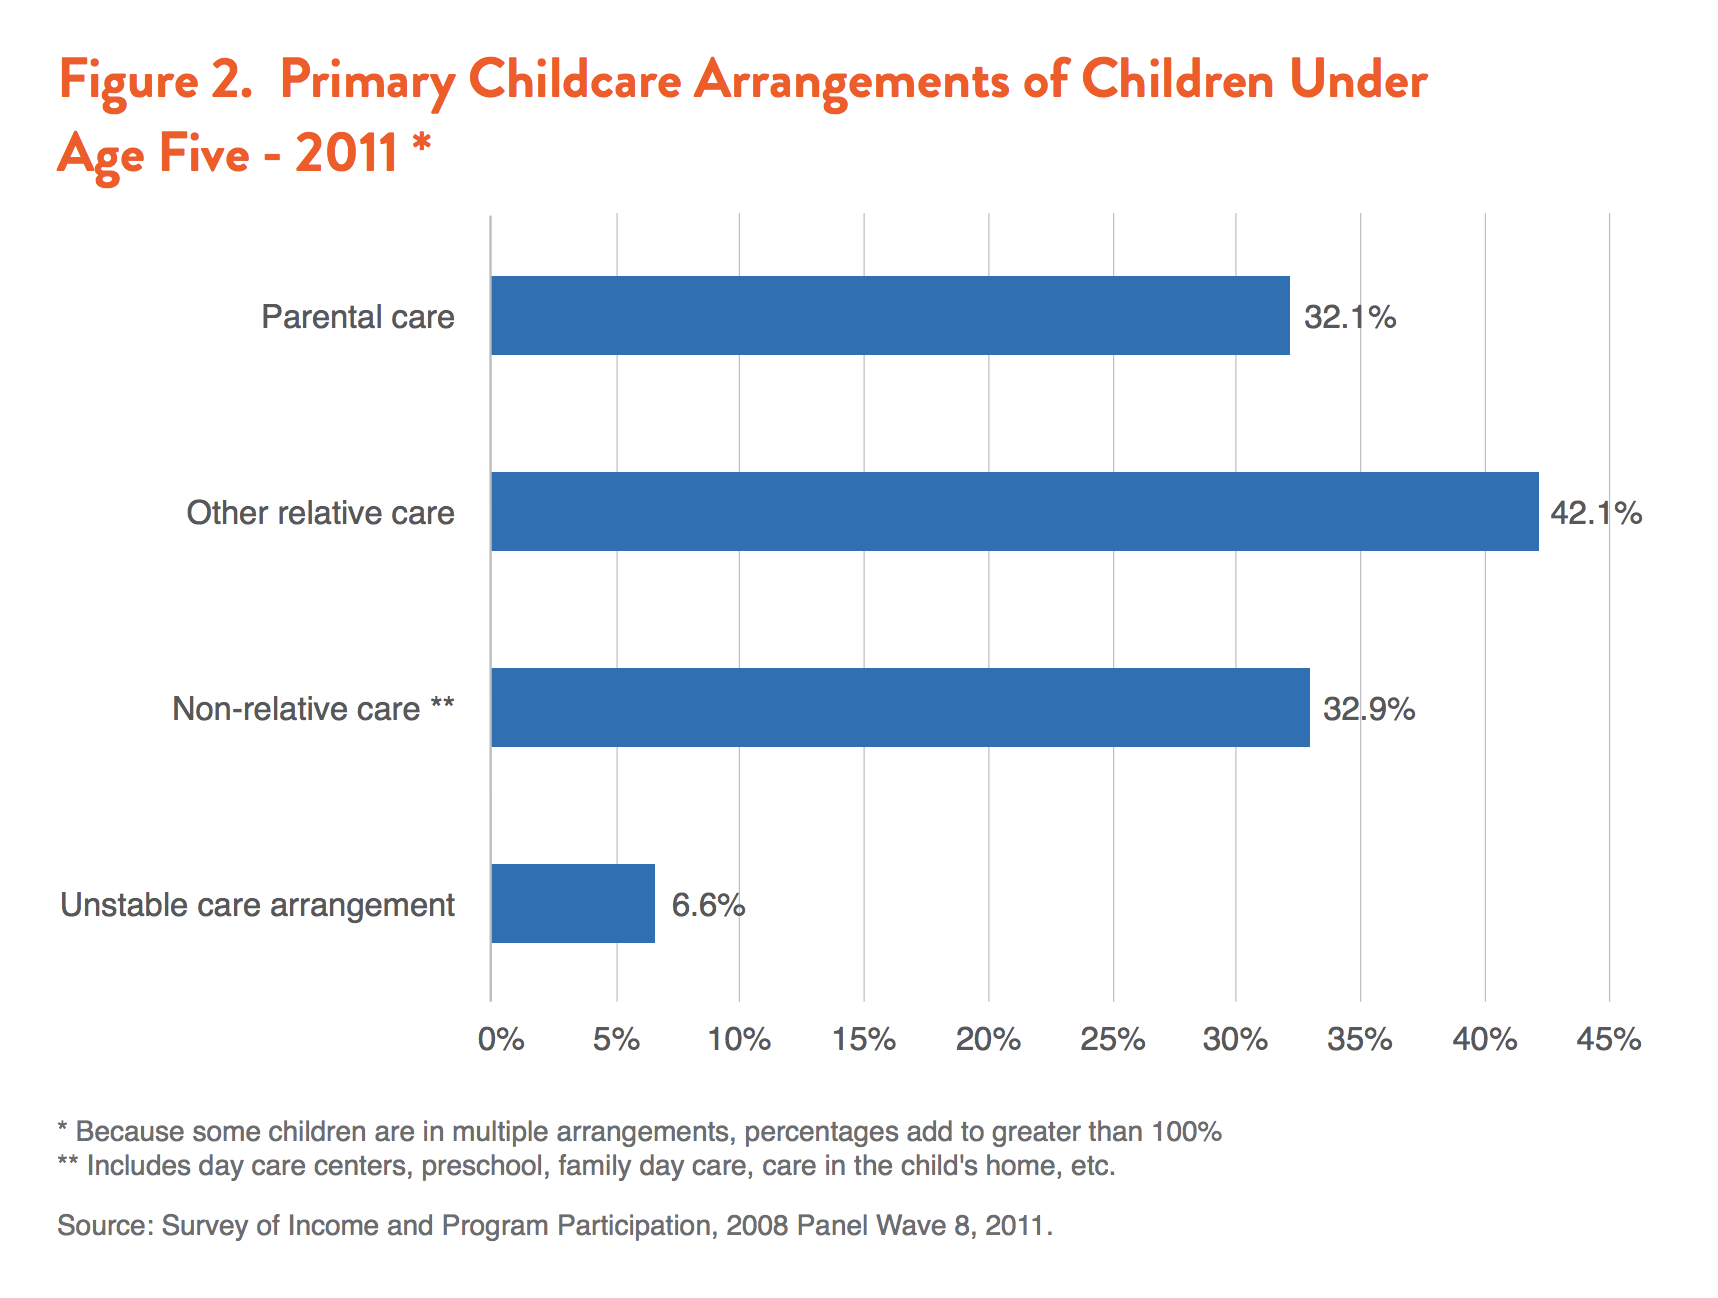
While parents are on the job, babies and young children still need care. The U.S. Census Bureau last analyzed childcare arrangements in 2011, focusing on children under age 5. According to this analysis, shown in Figure 2, 61 percent of young children were in some type of regular childcare arrangement while a parent was working or in school. More than 2 out of every 5 young children were cared for by a grandparent, sibling, or another relative. A third of children under age 5 were in non-relative care, including day care centers, preschool, family day care, or another non-relative arrangement.
But the trap that confronts families as they strive to both earn a living and care for their children is more complex than simply working and seeking childcare. A survey by Pew Research Center finds that half of all working parents report experiencing a major job or career interruption—reducing their work hours, taking a significant amount of time off, quitting a job, or turning down a promotion—in order to care for a child or other family member. While women were substantially more likely than men to interrupt their working lives for caregiving, many men also saw their jobs impacted: 1 in 4 fathers reported that they had reduced work hours or taken a significant amount of time off work to provide care.
In a separate survey, fully half of fathers said they had stopped working, switched to a less challenging job, or passed up a job opportunity in order to allow more time to care for their children. Overwhelmingly, working parents report that they are glad they interrupted their work trajectory for caregiving, yet many also say their jobs and careers suffered as a result. Perhaps unsurprisingly, 62 percent of all young, childless workers anticipate difficulties advancing at work if and when they have a baby.
Caring for young children while also earning the income to support them should not have to entail such arduous trade-offs. The concluding section of this paper explores improved business practices and public policy solutions that could help ease the strain on young families, improving the lives of parents and children and improving the odds that having a baby will no longer leave households broke.
Who Are Parents with Young Children?
In 2014, 27 million Americans between the age of 18 and 64 were parents living with a child under 5. A close look at these families yields critical insights. As Figure 3 shows, the parents of children under age 5 are younger, more likely to live in poverty, and more likely to be Latino or Asian-Americans than other adults age 18-64. We also find that among working-age adults, parents of young children are more likely to live with a spouse or other partner.
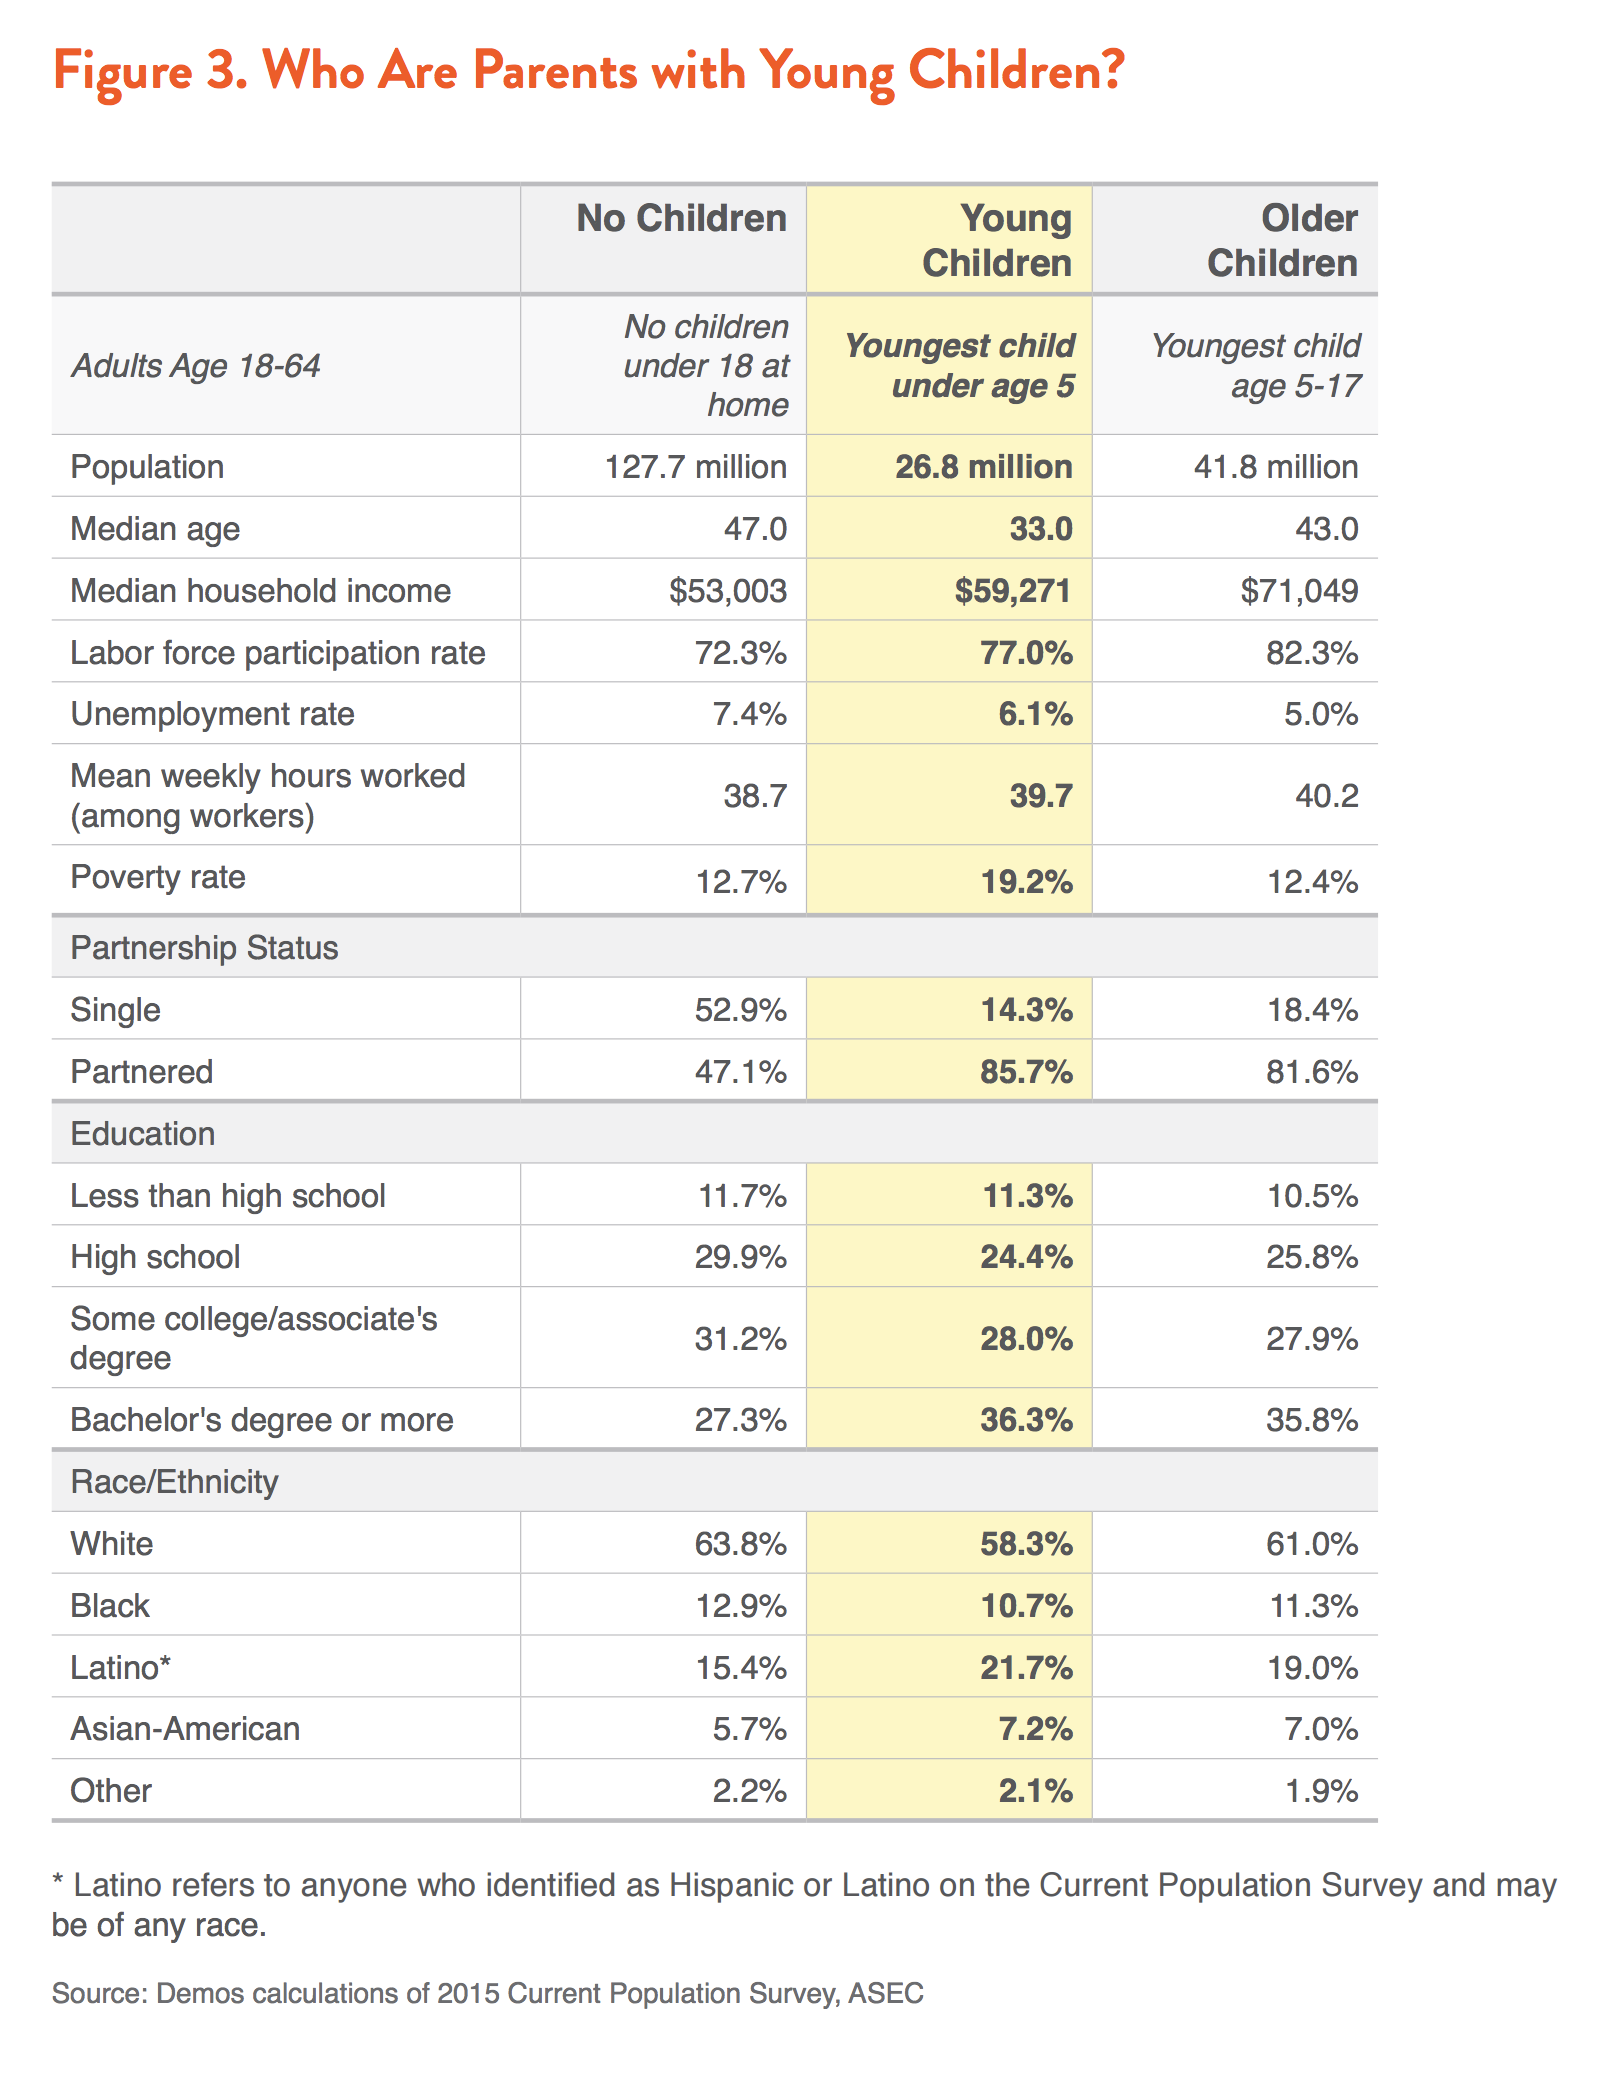
Overall, 86 percent of parents with a child under 5 live with a partner, while 14 percent are single. Women comprise 89 percent of single parent households with young children. Overall, 55 percent of parents living with young children are mothers. Most young children also live with at least one sibling: on average, households with a young child have 2 children.
The parents of young children have diverse educational backgrounds. More than a third have a high school diploma or less, while just over a third hold a bachelor’s degree or more. About 28 percent of parents of young children have some college education, including people who hold an associate’s degree or other certificate and those who have enrolled in college but not received a degree. Parents currently enrolled in college also form part of this group.
Parents of young children are more likely than other working-age adults to be people of color. While Latinos make up just 15 percent of adults without children and 19 percent of parents with older children, they represent 22 percent of adults with young children. The parents of young children are also significantly more likely to be Asian-American than adults without children.
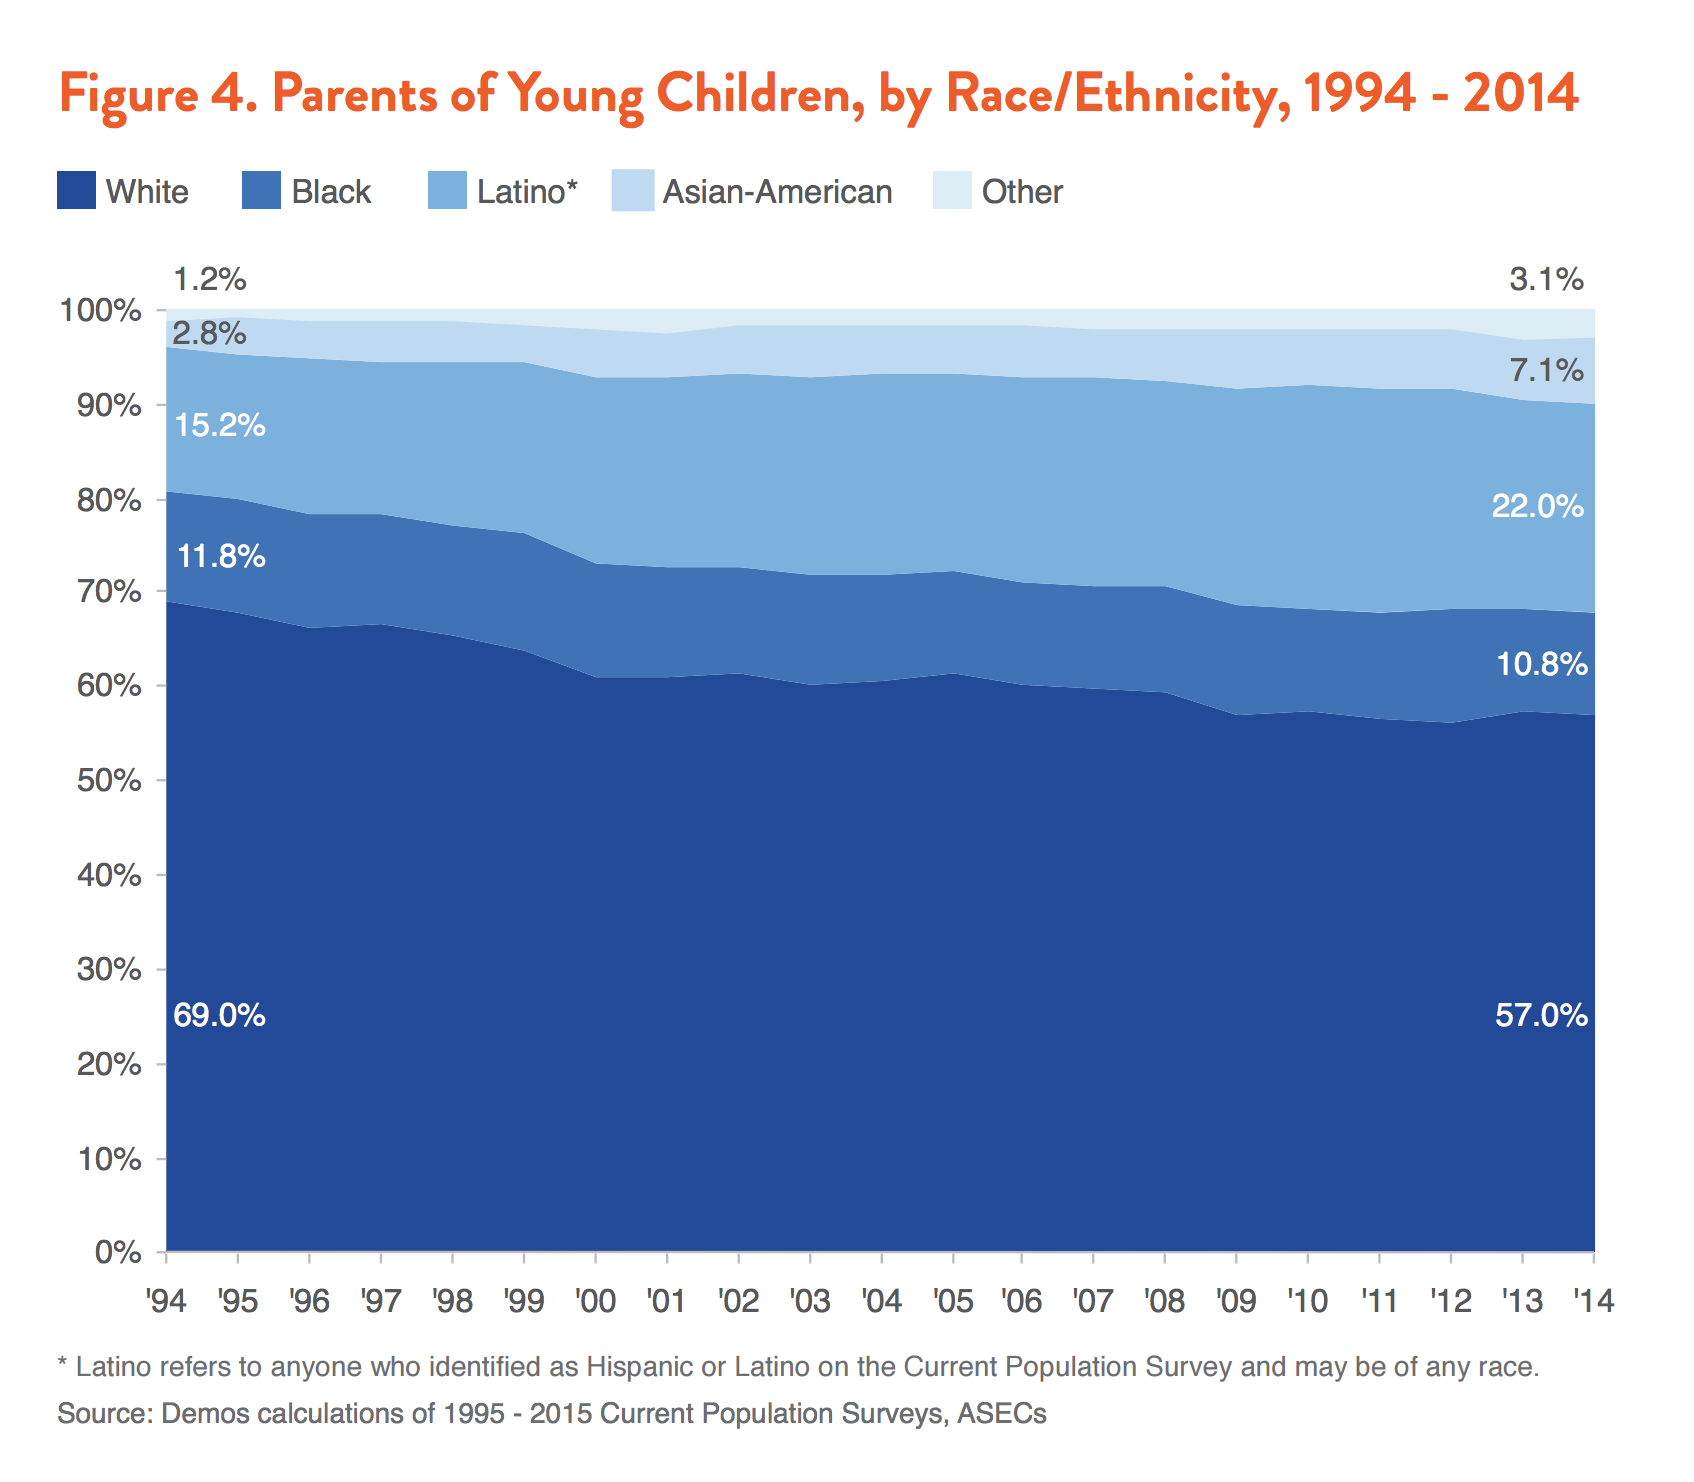
As Figure 4 shows, over the last 20 years the proportion of parents that identify as white has declined steadily: in 1994, 69 percent of parents with a child under 5 was white, compared to 57 percent in 2014. Over the same period, the proportion of parents of young children who identify as Latino, Asian-American, or “other” has increased by 67 percent, while the proportion who are black declined slightly.
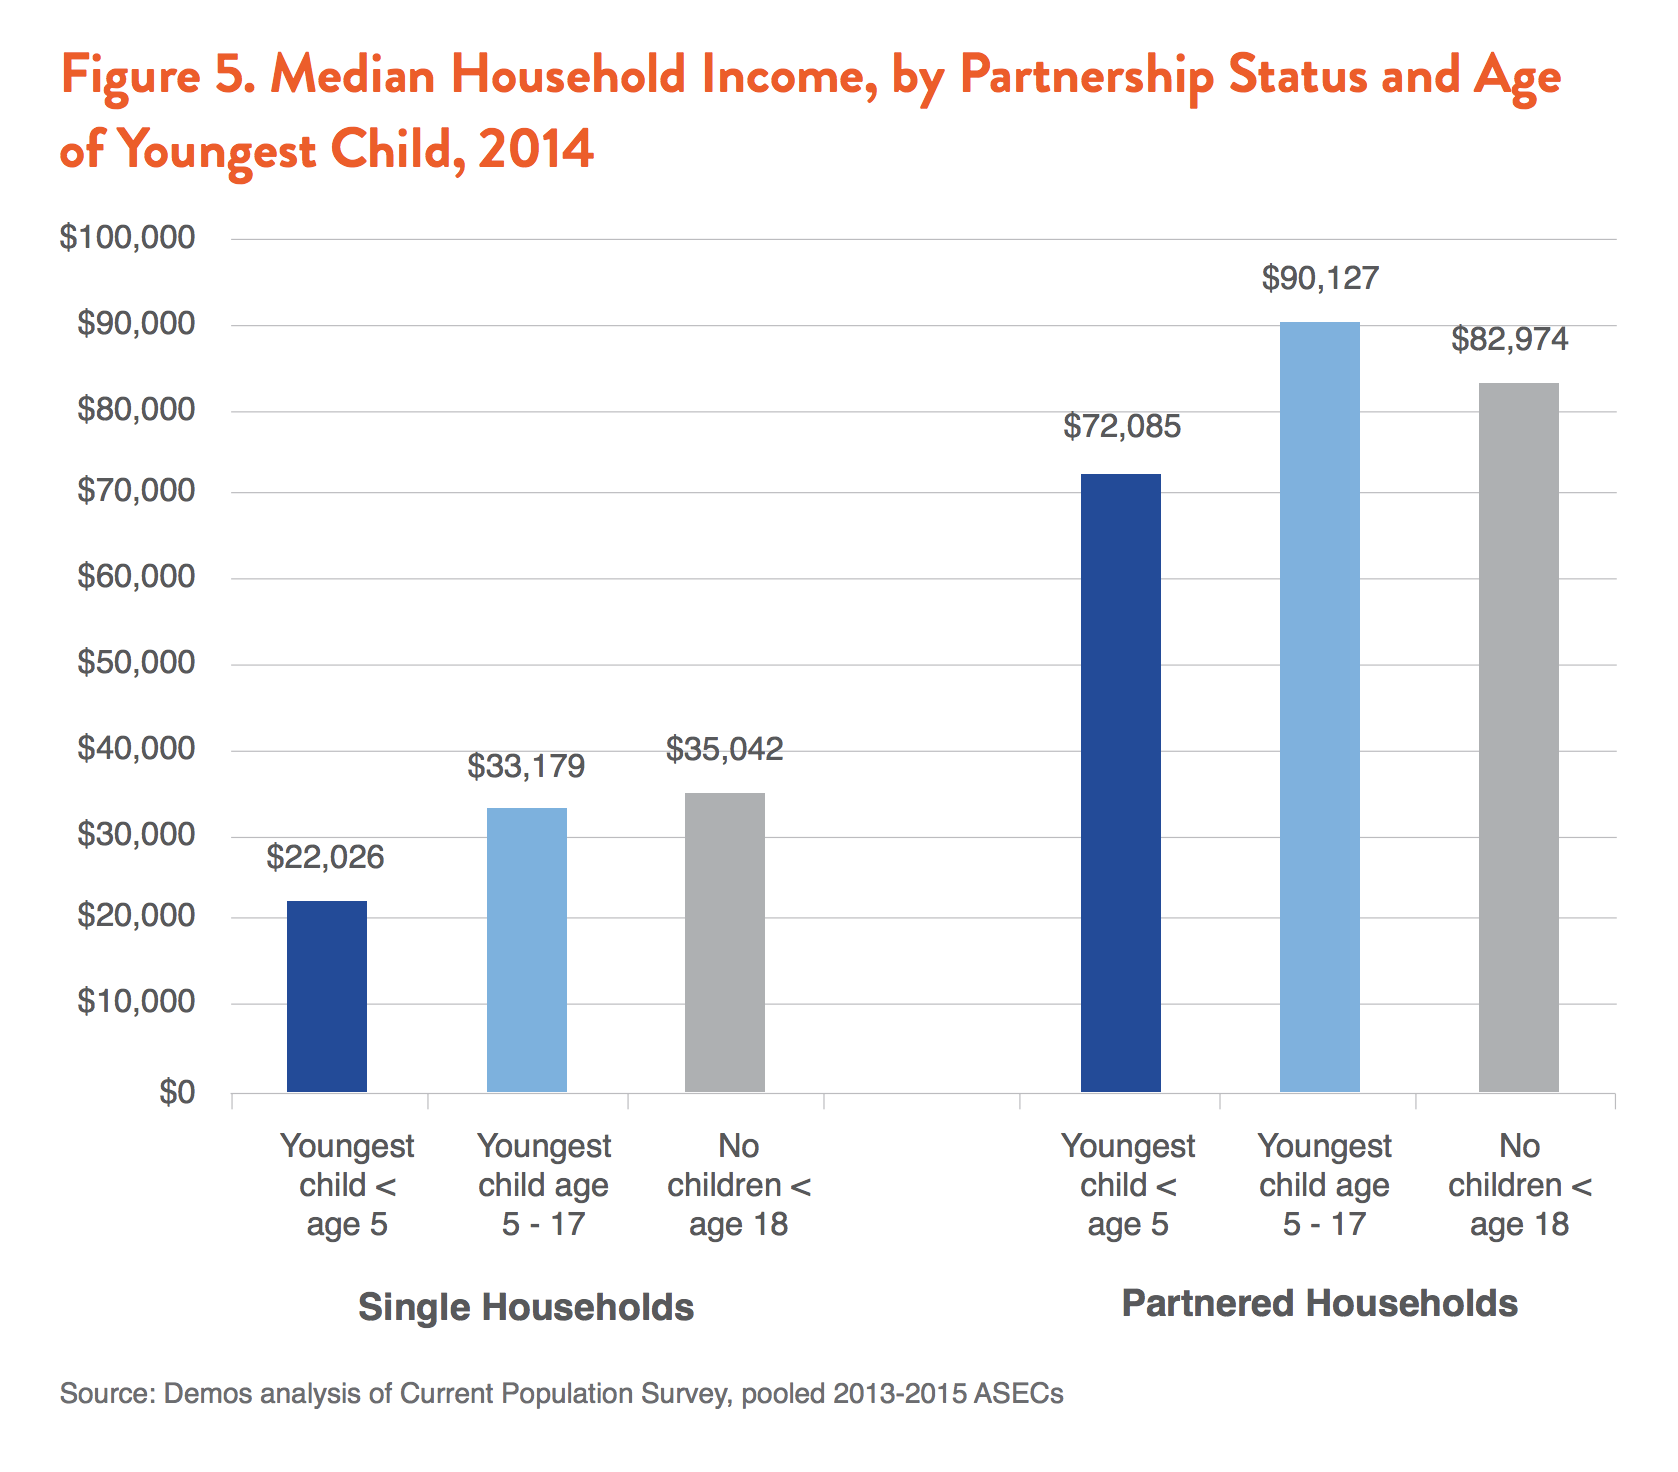
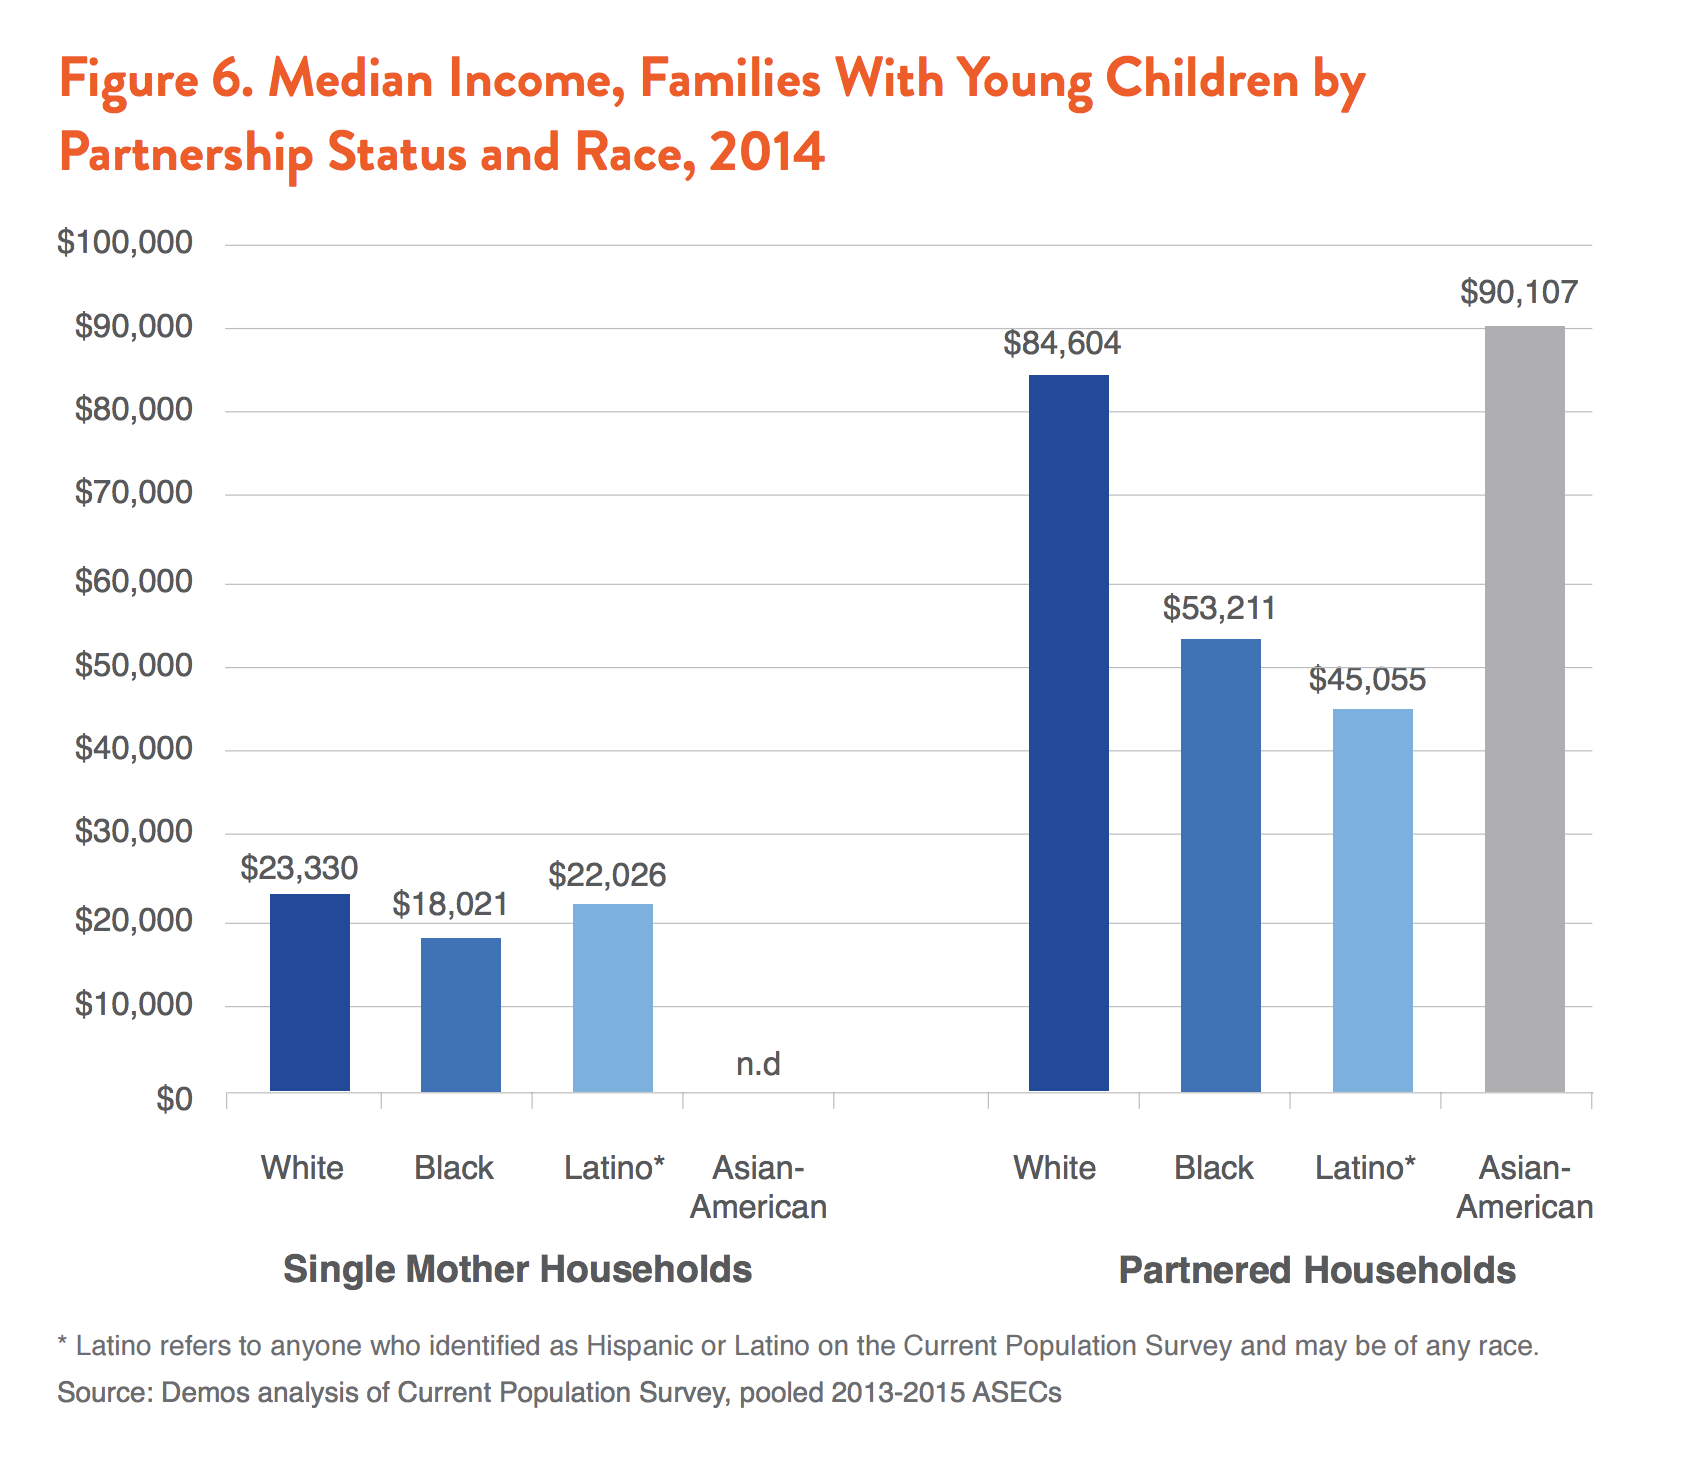
Families with children under age 5 have lower incomes than families with no children or those whose children are older. As Figure 5 depicts, parents of young children who lived with a spouse or other partner had a median household income of $72,085, compared to $82,974 for partners who had no children and $90,127 for partnered parents of older children. For parents of color, the lower income level associated with having a young child is compounded by the broader labor market disadvantages faced by people of color, as shown in Figure 6. Black and Latino parents who live with a spouse or other partner earn $31,393 and $39,549 less, respectively, than their partnered white counterparts. This gap is almost entirely a reflection of general racial income disparities rather than different responses to having children.
Single parents consistently have lower incomes. At the median, single parents of young children had a household income of $22,026, compared to $35,042 for single adults with no children and $33,179 for single parents of older children. Single black and Latina mothers of young children earn $5,309 and $1,304 less, respectively, than single white mothers.
Nearly 1 in 5 parents of young children live in poverty, a significantly higher poverty rate than for adults living without children or those with older children. The poverty rate for single parents is higher still: a devastating 46 percent for single parents with a young child, compared to 20 percent for single adults with no children and 27 percent for single parents with a child older than 5. Black and Latino parents confront still higher poverty rates.
Yet these disparities in income and poverty reflect not only the impact of having a young child but also the differing demographics of each group, discussed above. For example, a lower median income among households with young children can be explained in part by the fact that adults with young children tend to be younger themselves and less advanced in their careers. To better understand the effect of having a young child independent of these other factors, we conducted a statistical analysis controlling for differences in age, education, and race to determine the impact of having a young child on households’ income, poverty, labor force participation and unemployment. The next section of this report discusses that analysis.
How Having a Young Child Affects Work and Income
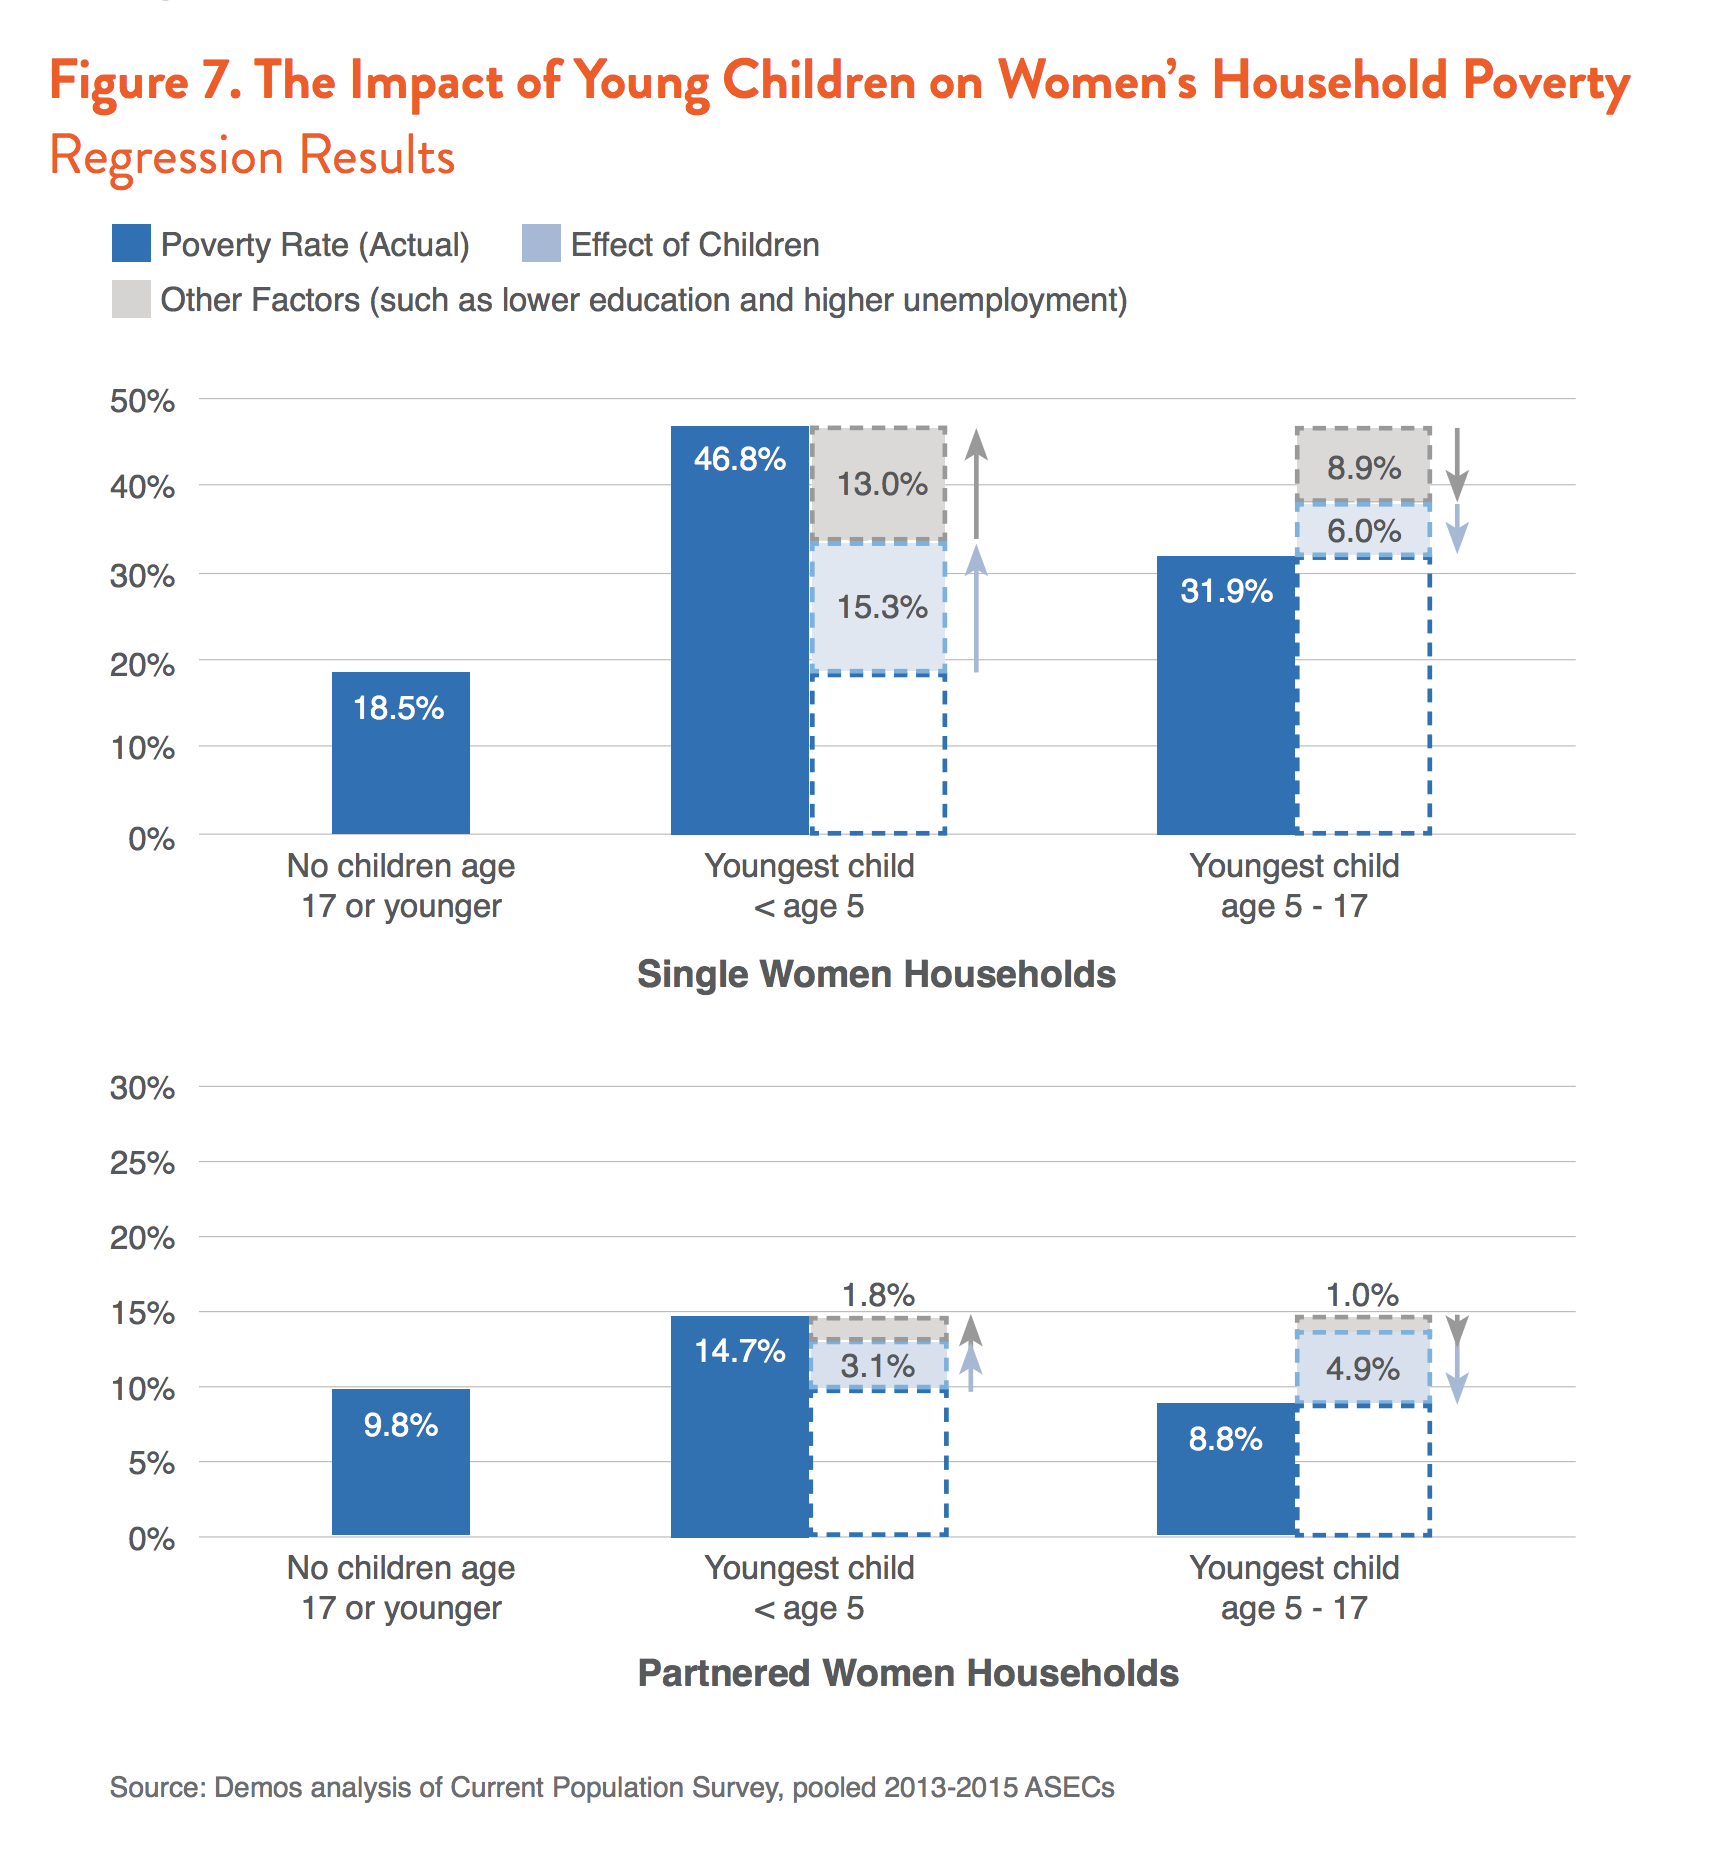
The competing demands of work and caregiving place a particularly heavy burden on families with children too young to attend school, since young children require care for more hours of the day and purchasing childcare is considerably more expensive for babies and toddlers. Evidence of the strain is visible in family incomes and poverty rates. We find that even after controlling for differences in age, education, and race, families with young children face an income penalty ranging from $14,850 for partnered households to $16,609 for single women. These income differences, combined with an increased family size, are enough to throw many families into poverty: as shown in Figure 7, single mothers are 15 percent more likely to live in poverty than single women without children, after controlling for other factors. Partnered mothers and fathers face poverty rates about 3 percent higher than their counterparts with no children.
For parents of color, the income penalty associated with having a young child is compounded by the broader labor market disadvantages faced by people of color. Although our regression results show that the child income penalty is no larger for parents of color than for white parents, parents of color still earn lower wages than their white counterparts due to lower education levels, labor market discrimination, occupational segregation, and other factors. These factors combine to make it even harder for parents of color to make ends meet.
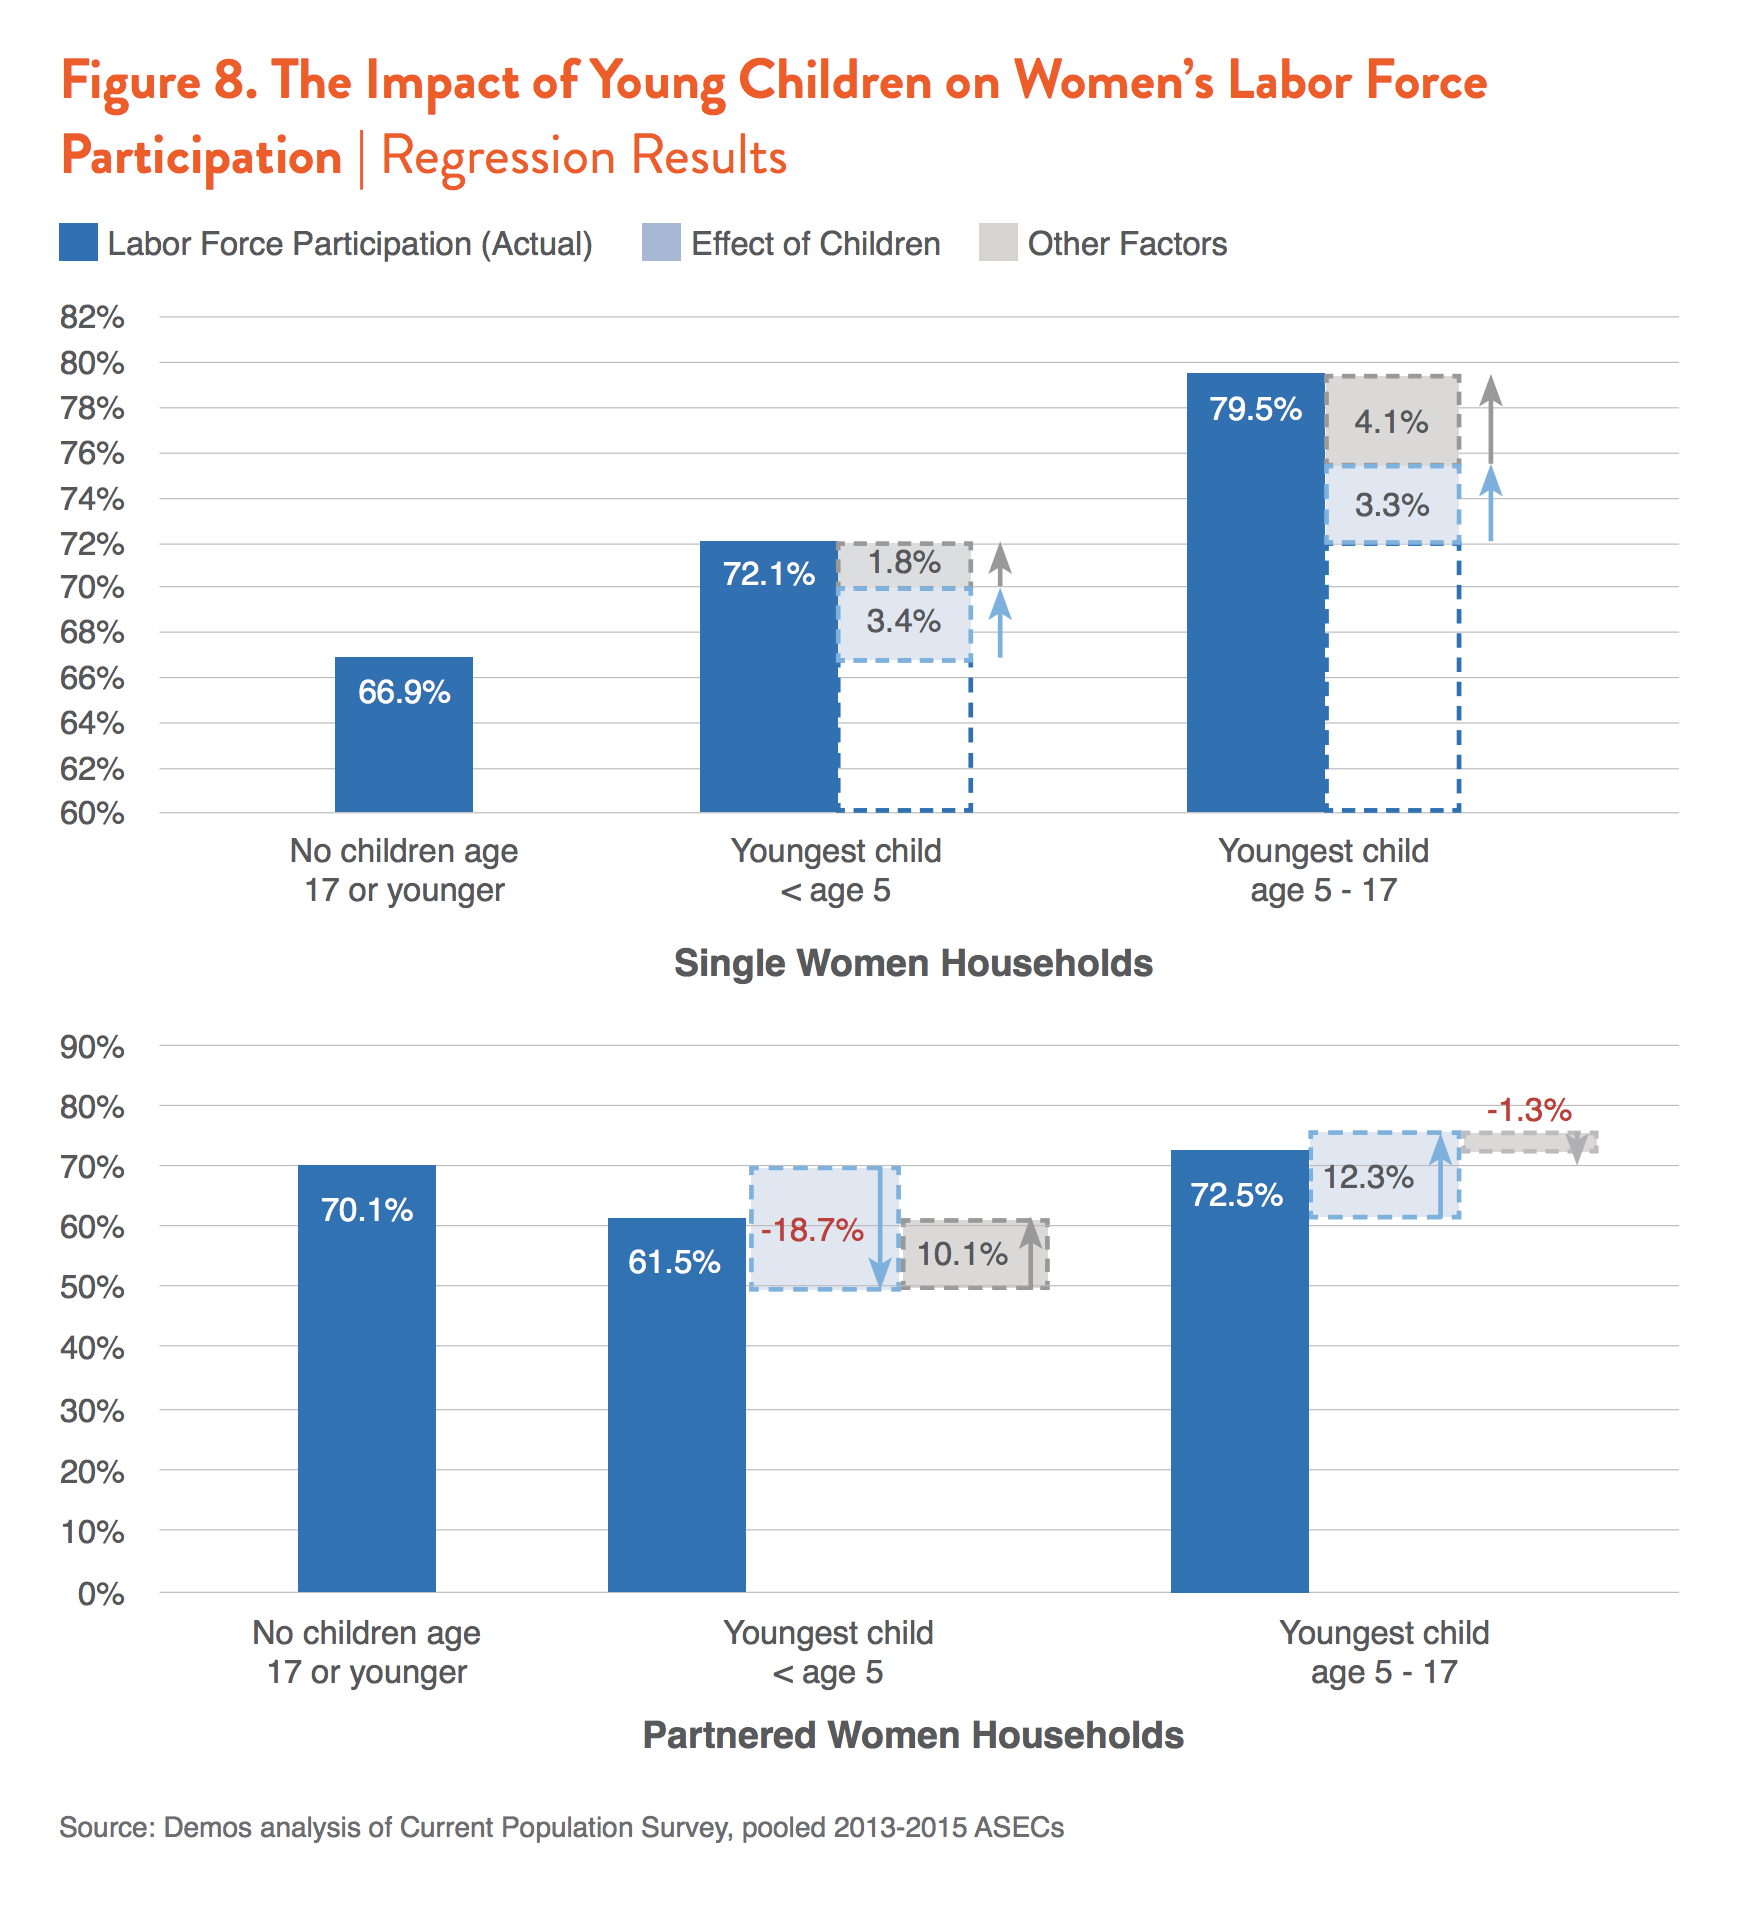
Differences in employment and labor force participation contribute substantially to the income penalty associated with having a young child. Having a young child has the strongest effect on whether mothers who live with a partner are in the labor force: after controlling for other factors, their labor force participation is 19 percent lower than partnered women without children, as illustrated in Figure 8. This effect is magnified for less-educated mothers of young children: after controlling for other factors, partnered mothers with a high school diploma or less are 21 percent less likely to be in the labor force than their counterparts without children. The cost of childcare is likely the primary cause of these lower labor force participation rates: mothers with less education generally earn lower wages, meaning that the expense of childcare may exceed—or nearly exceed—what they could earn outside the home (for more on the cost of child care, see page 20). Particularly when they have working partners, mothers with less education are spurred to leave the workforce and stay home with their children full-time.
Partnered fathers are pushed in the opposite direction: after controlling for other factors they are more likely to be in the labor force than their counterparts without children—regardless of their education level. While polling suggests that younger fathers have much more egalitarian attitudes about family, career and gender roles than previous generations and would like to embrace more childcare responsibilities, the persistent gap in earning potential between men and women means that household incomes are higher if men work.
With no partner to help provide income, single parents of both genders are more likely to seek work when their children are young. After controlling for other factors, single mothers and fathers participate in the labor force at significantly higher rates—3 percent and 9 percent, respectively—than comparable adults without children. However, while labor force participation reflects a willingness and availability for work, it does not necessarily guarantee that the job seeker is successful
in finding employment. As shown in Figure 9, single mothers of young children face a particularly elevated rate of unemployment: 16 percent, overall, with even higher unemployment rates among single mothers of color and those with less education.
The higher unemployment rate for single parents may reflect both employers’ unwillingness to hire single parents and the difficulty of fulfilling caregiving responsibilities while holding on to a job—particularly a job that lacks basic benefits like paid sick days or has an irregular or unstable schedule. Indeed, the data suggests that single parents with young children deal with significantly more unstable employment than other parents. Controlling for other factors, we find that 11 percent of single mothers and 12 percent of single fathers with young children had a job in the past year but not in the previous week when they were surveyed, compared to 4 percent and 6 percent of partnered men and women with young children.

As children reach school age, the trap that grips parents of young children eases somewhat. Partnered mothers, who were disproportionately likely to leave the workforce when their children were young, are more likely to return once their youngest child is in school. Unemployment rates for single parents decline. Incomes rise and poverty rates fall. For parents living with a partner, having the youngest child reach age 5 increases household income by more than $29,000, after controlling for other factors. In fact, parents of older children who live with a partner earn between 12 and 14 percent more than comparable adults without children, after controlling for other factors. The additional income is hardly a luxury, since raising children is also a significant additional expense. Single fathers also see their income penalty all but disappear as their children become older. Having children reach school age increases the incomes of single mothers by $25,651 after controlling for other factors, helping single mothers recover half of the income lost when they had young children. These higher incomes are reflected in their poverty rate: single mothers of school-age children are 6 percent less likely to be in poverty than their counterparts with children under 5, after controlling for other factors.
Tightening the Trap
Tightening the Trap: No Paid Time to Care
For many new parents there is no respite from the competing pressures of earning income and providing care, even during the later stages of pregnancy or when a baby is first born. While paid time to care for and bond with a new baby are the norm in virtually every other country, the U.S. guarantees only unpaid time off work under the Family and Medical Leave Act. The FMLA ensures that working people can take up to 12 weeks to care for a new child without losing their jobs—yet due to restrictions on eligibility, even that protection does not reach about 40 percent of working Americans.
In the absence of a federal guarantee, offering paid time to care is left to the states and to employers’ own discretion. According to the Bureau of Labor Statistics, just 13 percent of working people had access to paid family leave through their employers in 2014—and those with this benefit were more likely to be higher paid and working in professional jobs. Black and Latino workers are less likely than their white and Asian-American counterparts to have access to paid time. Meanwhile, only 5 states guaranteed new parents any type of paid time to care. As a result, millions of mothers and fathers face financial pressure to return to work just a few weeks after a baby enters the family, despite a growing body of medical research showing the importance of parental bonding for the babies’ health and development—as well as parents’ own well-being.
The lack of paid parental leave also plays a role in the lower incomes of families with young children and the lower labor force participation and higher unemployment rates faced by mothers of young children. The Census Bureau reports that about 1 in 5 mothers without parental leave quit their jobs during pregnancy or after the birth of a baby. On the other side, researchers find that new mothers with access to paid time to care are nearly 70 percent more likely than those without any paid time to come back to work three months to one year after having a child. Mothers who take paid time are also more likely to return to their previous employer and to be compensated at their former pay level or to be paid more, while 31 percent of mothers who have to change employers after having a baby see their compensation decline. These findings suggest that if America’s working parents had access to paid time to care, parents trapped between work and care would see their economic bind ease.
Tightening the Trap: No Paid Sick Time
Nearly 2 out of 3 low-wage workers in the U.S.—the employees who can least afford to miss a paycheck—do not have a single paid sick day to take care of sick child (much less themselves). Many low-wage workers even risk losing their jobs and employer-provided health coverage if they call in sick. According to one survey, 1 in 6 Americans says that they or a family member have been fired, suspended, punished, or threatened by an employer for missing work due to illness or to care for a sick child—making employment more precarious, especially for single parents. Latino workers are by far the least likely to have access to paid sick time. A growing number of states, cities, and counties have acted to guarantee workers a right to earn paid sick days, but the United States as a whole still offers no such guarantee.
Tightening the Trap: Irregular Work Schedules
Irregular and unpredictable work schedules can turn the effort to care for young children while earning enough to support them into a grueling ordeal for working parents. In an effort to minimize their labor costs, employers in industries such as retail, hospitality, and personal services increasingly use scheduling software and measures of consumer demand to match workers’ hours to the projected need for labor on a daily or even hourly basis. As a result, the Economic Policy Institute finds that at least 17 percent of the U.S. workforce has an unstable schedule: 10 percent of workers have an irregular or on-call, often unpredictable, work schedule, and an additional 7 percent work split or rotating shifts. A study of workers age 26 to 32 found that people of color were more likely than white workers to receive their work schedule with less than a week’s advance notice.
Unpredictably-shifting schedules are a double blow for working parents of young children, making it harder to arrange care at the same time that it becomes more difficult to earn a stable income. Parents with shifting work schedules may have difficulty arranging childcare and transportation at the last minute and scheduling essentials like doctor’s appointments. Employees who are paid hourly and see the number of hours worked shift from week to week will also bring home varying paychecks, making it very difficult to budget, particularly since the lowest-paid workers tend to have the most unstable schedules. Not surprisingly, 26 percent of workers with irregular schedules report “often” experiencing conflict between work and family responsibilities, more than twice the rate of those on more regular work schedules.
Tightening the Trap: Jobs That Won't Sustain a Family
Trying to support a family on wages that don’t cover the cost of essentials like housing, food, health coverage, transportation and clothing—much less the expense of childcare for young children—leaves parents trapped. In 2013, workers needed to earn at least $11.45 an hour and work full-time just to support a family of 4 at the official poverty threshold. Yet as the Economic Policy Institute points out, 27 percent of all workers earned wages below that level in 2013. An income sufficient to meet families’ actual basic needs is out of reach for even more working people. Workers of color are disproportionately low-paid, with 42 percent of Latino workers and 36 percent of Black workers paid poverty wages. Absent significant policy change, the wage picture is not expected to improve substantially, even if the economy continues to recover and grow: of the 10 occupations projected to add the greatest number of new jobs by 2022, only one (registered nurses) pays more than $32,500 per year at the median. As a result, many families will continue to struggle to provide for children on wages that fall short.
Children are expensive. At the same time that parents strive to earn income and care for their children, they also face the increased expense of having a baby, including hospital and medical bills from the birth itself and regular costs like diapers, formula and food. And while higher-income families spend more money on raising children in absolute terms, lower-income households expend a greater proportion of the incomes. The USDA finds that on average, households with an annual pre-tax income below $61,530 spent 25 percent of their before-tax income on a child, while those making between $61,530 and $106,540 a year spent 16 percent of their income on a child and higher income families spent 12 percent.
Tightening the Trap: Household Debt
Faced with the costs of raising children on an inconsistent or inadequate income, many parents are driven to borrow money in an effort to make ends meet. Debt is both an outcome of the pressures parents face and a pressure that can itself trap parents as interest and fees accumulate. Among low- and middle-income households with credit cards, having children is one of the strongest predictors of indebtedness: households that include children younger than 18 years of age are 15 percent more likely to be carrying credit card debt from month to month than childless households. Half of indebted households with children say they have used their credit cards to pay for basic living expenses (such as rent or mortgage payments, groceries, utilities, or insurance) in the past year because they did not have enough money in their checking or savings accounts—a share significantly higher than that of households without children.
At the same time, keeping up with debt imposes its own costs: indebted households with children report paying an average $395.86 in credit card bills within the last month. The use of payday loans is also significantly more common among families raising children, particularly those with low and moderate incomes. Eventually, borrowing may reach a level that can no longer be sustained. In her seminal 2004 book, The Two- Income Trap, (now Senator) Elizabeth Warren found that the presence of children was the biggest predictor of whether a household would file for bankruptcy. Her study concluded that married couples with children not only file for bankruptcy at twice the rate of childless couples but also have a higher probability of paying bills late and experiencing foreclosure.
Tightening the Trap: Employment Discrimination
Discrimination against pregnant workers and employees who have caregiving responsibilities is another factor that may keep parents out of work or harm their advancement on the job. The Center for WorkLife Law defines family responsibility discrimination as occurring when job applicants and workers are “rejected for hire, passed over for promotion, demoted, harassed, or terminated—despite good performance—simply because their employers make personnel decisions based on stereotypical notions of how they will or should act given their family responsibilities.” Mothers confront a particularly unforgiving employment environment. A Cornell University study found that mothers were judged to be significantly less competent and committed than equally qualified women without children and were held to more stringent standards of job performance and punctuality.
Ultimately, mothers were significantly less likely to be recommended for hire or to be promoted, and were offered an average of $11,000 less in salary for the same position as the equally qualified women who were not mothers. The study found that men were not generally penalized for being a parent, although men who take family leave or seek to actively care for their children may also face discrimination. While there is no federal law that explicitly prohibits employers from discriminating against their employees on the basis of family caregiving responsibilities, parents have some protection from discrimination under the Pregnancy Discrimination Act, the Civil Rights Act, the Family and Medical Leave Act and state and local statutes.
Tightening the Trap: Lack of Reproductive Freedom
The ability to make decisions about whether and when to become a parent is critical to families’ economic security. Having a child is one of life’s most serious commitments, economically and otherwise; an unintended pregnancy can upend financial stability, making it difficult for mothers in particular to pursue education and maintain employment. Yet in 2011, 45 percent of U.S. pregnancies were un- intended. Black and Latina women, young women, and women living below the poverty line were the most likely to experience an unintended pregnancy. Women’s lack of access to effective birth control and abortion compounds the inequalities that already exist, tightening the parent trap for the most vulnerable women and their families.
On contraception, public policy is making a positive difference: recent studies find that access to birth control and the use of highly effective contraceptive methods is increasing due to the Affordable Care Act’s expansion of health insurance coverage and the law’s mandate that insurers cover contraception as a form of preventive care—in most cases without cost to consumers. Yet gaps remain, including exemptions for some employers on religious grounds; federal guidelines that permit insurers to charge copayments for some brand-name contraceptive drugs; and failures by insurers or pharmacies to comply with the law. And women who still lack insurance—including many low-income residents of states that have refused to expand Medicaid eligibility— are excluded from expanded contraceptive coverage. The Kaiser Family Foundation also estimates that there are at least an additional 1.9 million women of childbearing age who will remain ineligible for contraceptive and other health coverage under the Affordable Care Act due to their immigration status.
At the same time, access to abortion is becoming more limited. Between 2011 and 2015, states enacted 288 restrictions on abortion services, including banning some abortions, imposing waiting periods, putting restrictions on the providers allowed to perform abortion procedures, and limiting insurance coverage. These restrictions have the greatest impact on low-income women, who can least afford to travel long distances to an open clinic or a less-restrictive state. The groundbreaking “Turnaway Study” from the University of California, San Francisco found that most women who seek abortion are already struggling financially, and many cite poverty as their main reason to seek abortion. Moreover, a woman who is turned away for an abortion is three times more likely to be in poverty two years after the fact than her counterpart who is able to access the procedure. Limits on reproductive freedom form a punishing part of the trap that con- strains women and their families.
Tightening the Trap: A Shortage of High-Quality, Affordable Childcare
Every week, nearly 7 million children under age 5 are cared for by someone other than a relative or legal guardian. Children go to day care centers; attend nursery schools, preschools, and Head Start programs; and are cared for by childcare providers in the child’s home or the provider’s home. Often this care is costly and difficult to secure. A 2015 Washington Post poll of parents with children under 18 living at home finds that only 10 percent say childcare in their area is not too expensive or is not expensive at all. A third of parents assert that childcare is extremely expensive. At the same time, half of parents say finding quality and affordable childcare has been difficult, including 21 percent who say it is very difficult.
The cost of childcare varies dramatically by the age of the child, the type of care, and the state where the family lives. According to the research and advocacy group Child Care Aware, the average cost of full-time care for a single infant in center-based care ranged from $4,822 a year in Mississippi to $17,062 in Massachusetts. At the other end of the spectrum, costs for a 4-year-old cared for in a childcare provider’s home ranged from $3,675 in Mississippi to $10,030 in Alaska. The expense adds up quickly: Child Care Aware estimates married couples earning the median family income in their state would have to spend 6.8 percent to 15 percent of their income to pay for center-based care for their infant during a full workweek. For single parents the costs can be even more overwhelming—in every state annual costs of center-based infant care averaged over 40 percent of the state median income for single mothers. Having 2 or more children in need of care further raises the costs.
How can families afford such steep bills? Low- and moderate-income households may be eligible for public subsidies: nationwide approximately 900,000 families with 1.5 million children receive public help paying for childcare. The funds primarily come from the federal government through the Childcare and Development Block Grant, Temporary Assistance for Needy Families, and the Social Services Block grant. However, since states administer the federal funds, and may add their own subsidies, eligibility varies widely. In general, families in poverty are the most likely to receive childcare assistance, yet as incomes rise, help paying for care may be cut off before families are capable of managing the costs on their own. According to the National Women’s Law Center, a family with an income above 150 percent of poverty ($30,135 a year for a family of three in 2015) could not qualify for any public childcare subsidy in 17 states. A family with an income above 200 percent of poverty ($40,180 a year for a family of three in 2015) could not qualify for assistance in 39 states. In addition, funds may run out before all eligible families receive subsidies: in 2015, 21 states had waiting lists for childcare assistance or had frozen intake of new families applying for assistance.
While this paper focuses on economics, the reality is that few families see childcare as purely a pocketbook issue. As they go to work, parents want to feel confident that their children are in a safe and nurturing environment and have opportunities for stimulation and learning. Yet there is wide variation in state standards for childcare centers and home-based care, as well as the qualifications of childcare providers. Childcare Aware reports that 31 states require a high school diploma or less for childcare center lead teachers, while 41 states require a high school diploma or less for regulated family childcare providers. When childcare workers do earn degrees or attain additional training, their income often does not rise in tandem with their increased qualifications, according to the Center for the Study of Child Care Employment. In 2012, the median childcare worker earned just $19,510 per year, a poverty wage that does not enable childcare workers to support their own families. Not surprisingly, turnover in the childcare workforce is high, meaning children are less likely to have stable and consistent caregivers and quality is reduced.
For 3- and 4-year-olds, nursery and preschool programs offer both care and a more structured form of early education. During the 2014-2015 school year, 41 percent of 4-year-olds and 16 percent of 3-year-olds were in a public preschool program, either a state- or locally-funded preschool or federal/ state funded Head Start and Early Head Start. According to the National Institute for Early Education Research, more than half a million children, or 40 percent of nationwide preschool enrollment, were served in programs that met fewer than half of the quality standards benchmarks, which include staff-to-child ratios and requirements that teachers have bachelor’s degrees and specialized training in early childhood education. In preschool, as in childcare, low wages for teachers undercut professionalism and quality. And quality is key: while preschool has traditionally been treated as an optional part of children’s education, a growing body of research demonstrates that high-quality preschool programs offer substantial benefits—in both school and later life—for children who participate, as well as broader societal benefits.
For parents, high-quality public preschool offers a respite from being trapped between caregiving and earning income, as well as an assurance that their children are receiving an excellent start to their education.
Caring for young children while also earning the income to support them does not have to leave parents trapped. Improved business practices and public policy solutions could help to ease the strain on families with young children, improving the lives of parents and children and increasing the odds that having a baby will no longer leave households broke. In many cases, legislation has already been introduced in Congress that would improve the lives of parents and their children. In addition, public opinion polls show strong support for many of these policies. A leaked internal survey of corporate executives found that strong majorities of business leaders also favor policies that benefit the parents of young children, including family leave, paid sick time, and an increased minimum wage, even as their lobbying organization has worked against these policies. The nation lacks neither policy solutions nor public support to dismantle the economic vise that traps parents; policymakers simply need the political will to act.
Guarantee Time to Care: A paid leave insurance system would enable working parents to welcome a new child without sacrificing their entire paycheck. The FAMILY Act would guarantee workers up to 12 weeks of time for caregiving with partial income when they take time for the birth or adoption of a child or to care for themselves or a loved one with a serious health condition. It would cover employees of all companies, no matter what their size. The system would be funded by a small payroll tax on employers and employees, equivalent to $1.50 per week for the median worker. A recent poll of likely voters indicated that 76 percent favor a federal paid family leave system along the lines of the FAMILY Act, including support from 57 percent of Republicans. The Healthy Families Act would ensure that working parents don’t miss wages—or get fired—for staying home with a sick child or taking a little one in for a check-up. The bill would enable workers employed by businesses with 15 or more employees to accrue up to 7 paid sick days a year to use for their own illness, providing care for sick family members, or accessing preventive care. Under this legislation, employees of smaller companies would be guaranteed job protection, but not pay, for taking time off while sick. Opinion polls indicate bipartisan support for requiring employers to offer paid sick time.
Raise Pay: At $7.25 an hour, the federal minimum wage is far too low for working parents to support their families, exacerbating the pressures that leave parents trapped between earning income and caring for children. Polling data has consistently shown strong support for raising the federal minimum wage, including a majority of Republican voters. The Raise the Wage Act, which would boost the federal minimum to $12 an hour by 2020, would lift pay for nearly 10 million working parents, including nearly 40 percent of all single working mothers. The Pay Workers a Living Wage Act would go further, increasing the federal minimum wage to $15 an hour. Meanwhile middle-income families—including nearly 5 million working parents—would benefit from strengthening federal overtime regulations, as the Department of Labor has issued regulations to do. By raising the salary threshold for workers to qualify for overtime pay, the proposed regulations ensure that parents (and other workers) will be fairly compensated for extra time spent on the job. Yet raising pay standards can only help working parents if employers follow the law. Improving enforcement of wage laws is critical: every year working people miss out on an estimated $50 billion or more when employers pay less than the minimum wage, oblige employees to work off the clock, misclassify their workforce as independent contractors, or otherwise violate laws on pay and hours.
Improve Schedules: Irregular and unpredictable work schedules make it harder for working parents to arrange childcare at the same time that it becomes more difficult to earn a stable income. Polls indicate that Americans support legislation to stabilize schedules, with 72 percent, including 62 percent of Republicans, saying they favor “requiring chain stores and fast-food outlets to give workers at least two weeks’ notice of any changes in their work schedules or provide them with extra pay.” The Schedules That Work Act would guarantee that employees in the retail, food service, and cleaning industries— among those most subject to irregular schedules—receive their schedules at least 2 weeks in advance and be paid for at least 4 hours on a shift. The legislation would also protect all workers from retaliation if they request more flexible, predictable or stable schedules from their employer and would set up a process for employers to consider workers’ scheduling requests.
Combat Discrimination: Employment discrimination can result in parents being unemployed or underpaid, making it more difficult to support a family. Expecting mothers, for example, may be forced out of their jobs because employers refuse minor adjustments that would allow them to maintain a healthy pregnancy and keep working. The Pregnant Workers Fairness Act would require employers to accommodate the basic health needs of pregnant workers, such as allowing workers to carry a water bottle, take an extra bathroom break, or sit on a chair. Meanwhile, the Paycheck Fairness Act would provide more broad-based protection against pay discrimination that often targets mothers by enabling workers to discuss their pay rates with colleagues without fear of retaliation, mandating that employers prove pay disparities exist for legitimate, job-related reasons, and making it easier to seek legal redress for discrimination. Further steps toward public pay transparency would enable working people to achieve greater equality and would give businesses an incentive to pay employees fairly. Public opinion surveys consistently find strong support for promoting pay equity. Existing discrimination laws—including those focused on race, color, religion, national origin, age, disability or genetic information, which may also affect parents—must also be vigorously enforced.
Guarantee Reproductive Rights: The ability to make decisions about whether and when to become a parent is critical to families’ economic security, so access to reproductive health services is vital. Opinion surveys find that 69 percent of Americans believe that contraception coverage should be a standard part of all health care plans. Congress must preserve the Affordable Care Act’s coverage of contraception without copays and resist efforts to cut federal funding to women’s health care offered by Planned Parenthood. Access to contraception should also be expanded by legislation such as the Affordability IS Access Act, which urges the Food and Drug Administration to make birth control pills available over the counter and ensures that birth control pills be fully covered by insurance without a copay even if they are dispensed without a prescription. At the same time, Congress should act to eliminate the Hyde Amendment, which currently prohibits Medicaid coverage for abortion services, making abortion unaffordable for many low-income women. Access to abortion would also be enhanced by the Women’s Health Protection Act which would push back against recent state limits on abortion by barring states from imposing abortion restrictions that do not apply to similar types of medical care, or that interfere with patient’s decisions, or otherwise impede access to safe abortion care.
Enhance Early Care and Learning: Public policy must aim to increase access to affordable, high-quality childcare. The American National Election Survey finds that a majority of Americans favor
an increase in government spending to help working parents pay for childcare. Increasing subsidies under the Childcare and Development Block Grant and the Temporary Assistance for Needy Families block grant with the aim of eliminating waiting lists, expanding eligibility, raising standards for care and compensation for providers and allowing families to retain subsidies even if their work status and income fluctuates would enable more families to secure safe and nurturing care for their children. President Obama’s proposal to raise the maximum Child and Dependent Care Tax Credit to $3,000 and expand eligibility would be helpful to middle-class families struggling with the cost of care. Expanding Head Start and mobilizing federal funds to help states and cities establish universal preschool programs for 3- and 4-year-olds would aid working parents, their children, and society as a whole.
Policies by Workplace: Beyond what is legislated, employers can autonomously choose to pursue any and all of these policies for their own workforce: raising wages, improving schedules, providing leave, offering childcare, establishing safeguards against discrimination, and devising tailored policies to retain parents who have taken substantial time off work to care for children. At the same time, workers have greater power to negotiate for workplace policies that enable them to care for their families and earn enough to support them when they organize into unions and can negotiate collectively for these priorities.
Summary statistics comparing households with no children, younger children, and older children show statistically significant differences between the three populations. In order to examine how much of those differences were due to the presence of children in the household, we ran several regressions to attempt to isolate the effect of childrearing on several economic variables. The regressions each used Current Population Survey data, pooled 2013-2015 Annual and Social and Economic Supplements (pooled to ensure sufficient sample sizes). The five variables we hypothesized that caring for a child might have a significant impact on are: log(income), poverty status, labor force participation (LFP), employment (among adults in the labor force), and hours worked; thus, these are the dependent variables of our five types of regressions. As the results below show, we ran separate regressions for adult men and women for each dependent variable to avoid an uninterpretable number of interaction terms.
Our hypothesis was that the age of a person’s youngest child would likely impact these variables differently; specifically, whether a person’s youngest child had reached school age. To test this, we divided adults into three groups: adults with no children younger than 18, adults whose youngest child was younger than 5, and adults whose youngest child was between age 5 and 17, inclusive. We also hypothesized that partnership status would impact the effect of childrearing on our dependent variables; thus, we interacted partnership status with the youngest child categories, as shown by our final four regressors in the regression output below. Finally, we controlled for education level, race group, and age/age squared in each.
The general model for each of the regressions was identical, changing only the dependent variable. Each regression took the form:
yi = β0 + β1age + β2age2 + β3educcat + β4racecat + β5single + β6ychild + β7ochild + β8 single * ychild + β9single * ochild
yi is one of the five dependent variables: log(income), average
hours worked per week, poverty status, labor force participation, or employment. An ordinary least squares model was used for the first two regressions, while a logit model was used for the following three. The first two variables are continuous variables, while the following three are binary variables.
age is a continuous variable representing the age of each adult.
age2 is a continuous variable representing the square of the age of each adult.
educcat is a categorical variable representing the educational category of each adult. It contains four categories: less than high school completed, high school diploma, some college or associate’s degree, or bachelor’s degree or higher.
racecat is a categorical variable representing the race or ethnicity category of each adult. It contains five categories: white, not Hispanic; black, not Hispanic; Hispanic; Asian-American; or other.
single is a binary variable indicating whether the adult is partnered or single.
ychild is a binary variable indicating whether the adult lives with a child younger than age 5.
ochild is a binary variable indicating whether the adult lives with a child age 5 to 17.
single*ychild is the interaction term for the relationship between the adult’s partnership status and whether they live with a child younger than age 5.
single*ochild is the interaction term for the relationship between the adult’s partnership status and whether they live with a child between age 5 and age 17.
Coefficient Interpretation: The baseline for all of the regressions is “partnered with no children under age 18.” Thus, the variables “older child” and “young child” below are the coefficients for partnered individuals with young and older children, respectively. To get the coefficients for single parents, we have to add the coefficients for, for example, young child + the interaction term (single:young child).
The interpretation of the OLS coefficients is straightforward: the percent increase or decrease in log(income) or average hours worked for adults with young and older children, by gender and partnership status.
For the coefficients of the logit regressions, the interpretation is a little less straightforward. The coefficient of a binary or categorical explanatory variable (which describes all of our explanatory variables) in a logit regression can be interpreted as the log of the ratio of the odds of “success”—i.e. LFP, unemployment, poverty—when the explanatory variable is 0 and when it is 1, holding all other variables constant.1
Thus, to get the coefficients into a more easily-interpretable form, i.e. a predicted percent change, we have to linearize them. To do so, we take the first derivative of each coefficient: , where is the coefficient for the explanatory variable and is the population proportion for the dependent variable when the explanatory variable is equal to zero.
For example, in the female labor force participation regression, the coefficient for partnered women with young children (the “young child” line) is -0.89. Thus, to get the predicted effect of having young children on the labor force participation of partnered women with young children, we multiply that coefficient by the actual LFP of partnered women with no children younger than 18, which is 70.1%. Thus, -0.89*0.701*(1-0.701)=-0.187, which means that our model predicts that having a young child will reduce partnered women’s probability of being in the labor force by 0.187, or 18.7% compared to partnered women with no children, all other factors being equal.
Empirically, the partnered women with young children have a LFP rate 8.6% lower than partnered women with no children, but that’s because in reality all other factors are not equal: partnered women with young children have higher average education levels than partnered women with no children, thus increasing their probability of being in the labor force.
1. See this FAQ from UCLA’s Institute for Digital Research and Education for a complete description: http://www.ats.ucla.edu/stat/mult_pkg/faq/general/odds_ratio.htm.
Regression Results:
Log(Income), Men
lm(formula = formula(paste(“loginc”, “~”, predictors)), data = df[df$gender == “Male”, ])
| |
|
|
|
|
11.43 |
0.04 |
|
|
-0.03 |
0.00 |
|
|
0.00 |
0.00 |
|
|
0.33 |
0.01 |
|
|
0.56 |
0.01 |
|
|
0.98 |
0.01 |
|
|
-0.47 |
0.01 |
|
|
-0.19 |
0.01 |
|
|
-0.12 |
0.02 |
|
|
-0.26 |
0.02 |
|
|
-0.05 |
0.01 |
|
|
0.14 |
0.01 |
|
|
-0.15 |
0.01 |
|
|
-0.16 |
0.03 |
|
|
-0.11 |
0.06 |
n = 174483, k = 15
residual sd = 1.58, R-Squared = 0.08
lm(formula = formula(paste(“loginc”, “~”, predictors)), data = df[df$gender == “Female”, ])
| |
|
|
|
|
11.21 |
0.05 |
|
|
-0.03 |
0.00 |
|
|
0.00 |
0.00 |
|
|
0.38 |
0.01 |
|
|
0.69 |
0.01 |
|
|
1.09 |
0.01 |
|
|
-0.47 |
0.01 |
|
|
-0.21 |
0.01 |
|
|
-0.09 |
0.02 |
|
|
-0.26 |
0.02 |
|
|
-0.20 |
0.01 |
|
|
0.11 |
0.01 |
|
|
-0.19 |
0.01 |
|
|
-0.20 |
0.02 |
|
|
-0.26 |
0.03 |
n = 187363, k = 15
residual sd = 1.66, R-Squared = 0.11
Hours Worked, Men
lm(formula = formula(paste(“hours”, “~”, predictors)), data = df[df$gender == “Male”, ])
| |
|
|
|
|
15.94 |
0.35 |
|
|
1.21 |
0.02 |
|
|
-0.01 |
0.00 |
|
|
1.96 |
0.10 |
|
|
1.62 |
0.11 |
|
|
3.14 |
0.11 |
|
|
-1.68 |
0.10 |
|
|
-1.15 |
0.08 |
|
|
-1.71 |
0.12 |
|
|
-0.70 |
0.18 |
|
|
-2.73 |
0.08 |
|
|
0.11 |
0.08 |
|
|
0.88 |
0.10 |
|
|
1.13 |
0.23 |
|
|
1.39 |
0.46 |
n = 143577, k = 15
residual sd = 10.60, R-Squared = 0.11
Hours Worked, Women
lm(formula = formula(paste(“hours”, “~”, predictors)), data = df[df$gender == “Female”, ])
| |
|
|
|
|
7.49 |
0.38 |
|
|
1.32 |
0.02 |
|
|
-0.01 |
0.00 |
|
|
2.50 |
0.13 |
|
|
2.23 |
0.13 |
|
|
4.83 |
0.13 |
|
|
0.95 |
0.10 |
|
|
0.62 |
0.09 |
|
|
0.69 |
0.12 |
|
|
0.53 |
0.19 |
|
|
-0.80 |
0.08 |
|
|
-3.28 |
0.09 |
|
|
-2.44 |
0.11 |
|
|
2.85 |
0.15 |
|
|
2.40 |
0.21 |
n = 132786, k = 15
residual sd = 10.88, R-Squared = 0.08
LFP, Men
glm(formula = formula(paste(“lfp1”, “~”, predictors)), family = binomial(link = logit), data = df[df$gender == “Male”, ])
| |
|
|
|
|
-3.11 |
0.07 |
|
|
0.26 |
0.00 |
|
|
0.00 |
0.00 |
|
|
0.67 |
0.02 |
|
|
0.68 |
0.02 |
|
|
1.46 |
0.02 |
|
|
-0.44 |
0.02 |
|
|
0.32 |
0.02 |
|
|
-0.23 |
0.03 |
|
|
-0.43 |
0.04 |
|
|
-0.75 |
0.02 |
|
|
0.50 |
0.03 |
|
|
0.56 |
0.04 |
|
|
0.06 |
0.06 |
|
|
-0.13 |
0.11 |
n = 172640, k = 15
residual deviance = 136732.6, null deviance = 161567.3 (difference = 24834.6)
LFP, Women
glm(formula = formula(paste(“lfp1”, “~”, predictors)), family = binomial(link = logit), data = df[df$gender == “Female”, ])
| |
|
|
|
|
-2.96 |
0.06 |
|
|
0.18 |
0.00 |
|
|
0.00 |
0.00 |
|
|
0.73 |
0.02 |
|
|
1.02 |
0.02 |
|
|
1.53 |
0.02 |
|
|
-0.12 |
0.02 |
|
|
-0.12 |
0.01 |
|
|
-0.34 |
0.02 |
|
|
-0.22 |
0.03 |
|
|
-0.08 |
0.01 |
|
|
-0.31 |
0.02 |
|
|
-0.89 |
0.02 |
|
|
0.61 |
0.03 |
|
|
1.04 |
0.04 |
n = 187165, k = 15
residual deviance = 213049.5, null deviance = 229128.1 (difference = 16078.6)
Employment, Men
glm(formula = formula(paste(“emp1”, “~”, predictors)), family = binomial(link = logit), data = df[df$gender == “Male”, ])
| |
|
|
|
|
0.22 |
0.11 |
|
|
0.09 |
0.01 |
|
|
0.00 |
0.00 |
|
|
0.32 |
0.03 |
|
|
0.73 |
0.03 |
|
|
1.25 |
0.04 |
|
|
-0.67 |
0.03 |
|
|
0.06 |
0.03 |
|
|
0.06 |
0.05 |
|
|
-0.60 |
0.06 |
|
|
-0.47 |
0.03 |
|
|
0.18 |
0.04 |
|
|
0.26 |
0.04 |
|
|
-0.18 |
0.08 |
|
|
-0.49 |
0.13 |
n = 141957, k = 15
residual deviance = 64923.1, null deviance = 69824.8 (difference = 4901.7)
Employment, Women
glm(formula = formula(paste(“emp1”, “~”, predictors)), family = binomial(link = logit), data = df[df$gender == “Female”, ])
| |
|
|
|
|
0.74 |
0.13 |
|
|
0.06 |
0.01 |
|
|
0.00 |
0.00 |
|
|
0.51 |
0.04 |
|
|
0.86 |
0.04 |
|
|
1.37 |
0.04 |
|
|
-0.65 |
0.03 |
|
|
-0.21 |
0.03 |
|
|
0.10 |
0.06 |
|
|
-0.46 |
0.06 |
|
|
-0.23 |
0.03 |
|
|
0.09 |
0.04 |
|
|
0.09 |
0.05 |
|
|
-0.29 |
0.06 |
|
|
-0.54 |
0.07 |
n = 130741, k = 15
residual deviance = 55343.0, null deviance = 58849.0 (difference = 3506.0)
Poverty Status, Men
glm(formula = formula(paste(“pov1”, “~”, predictors)), family = binomial(link = logit), data = df[df$gender == “Male”, ])
| |
|
|
|
|
-1.41 |
0.08 |
|
|
-0.02 |
0.00 |
|
|
0.00 |
0.00 |
|
|
-0.72 |
0.02 |
|
|
-1.10 |
0.02 |
|
|
-1.85 |
0.03 |
|
|
0.82 |
0.02 |
|
|
0.39 |
0.02 |
|
|
0.31 |
0.03 |
|
|
0.54 |
0.04 |
|
|
0.53 |
0.02 |
|
|
-0.10 |
0.03 |
|
|
0.43 |
0.03 |
|
|
0.28 |
0.06 |
|
|
0.11 |
0.10 |
n = 174483, k = 15
residual deviance = 111936.5, null deviance = 122452.4 (difference = 10516.0)
Poverty Status, Women
glm(formula = formula(paste(“pov1”, “~”, predictors)), family = binomial(link = logit), data = df[df$gender == “Female”, ])
| |
|
|
|
|
-1.27 |
0.07 |
|
|
0.01 |
0.00 |
|
|
0.00 |
0.00 |
|
|
-0.71 |
0.02 |
|
|
-1.21 |
0.02 |
|
|
-2.11 |
0.03 |
|
|
0.65 |
0.02 |
|
|
0.37 |
0.02 |
|
|
0.10 |
0.03 |
|
|
0.57 |
0.04 |
|
|
0.48 |
0.02 |
|
|
-0.21 |
0.03 |
|
|
0.35 |
0.03 |
|
|
0.83 |
0.03 |
|
|
0.67 |
0.04 |
residual deviance = 138711.4, null deviance = 158848.8 (difference = 20137.4)