Higher education has long been our nation’s primary lever of upward mobility. As a result, throughout our nation’s history, we have committed to ensuring that all individuals, regardless of cost, would be able to attend college. But that commitment has faltered in the last generation as states reduced funding for higher education and family incomes stagnated. Today, college costs are rising beyond the reach of many Granite Staters. State policy decisions have played a significant role in this rise: New Hampshire’s investment in higher education has decreased considerably over the past two decades and as a result has the highest average tuition in the country. Students and their families now pay—or borrow—much more than they can afford to get a higher education, a trend which will have grave consequences for both their futures and for New Hampshire’s future economy.
STATE HIGHER EDUCATION FUNDING IS DRAMATICALLY DECLINING
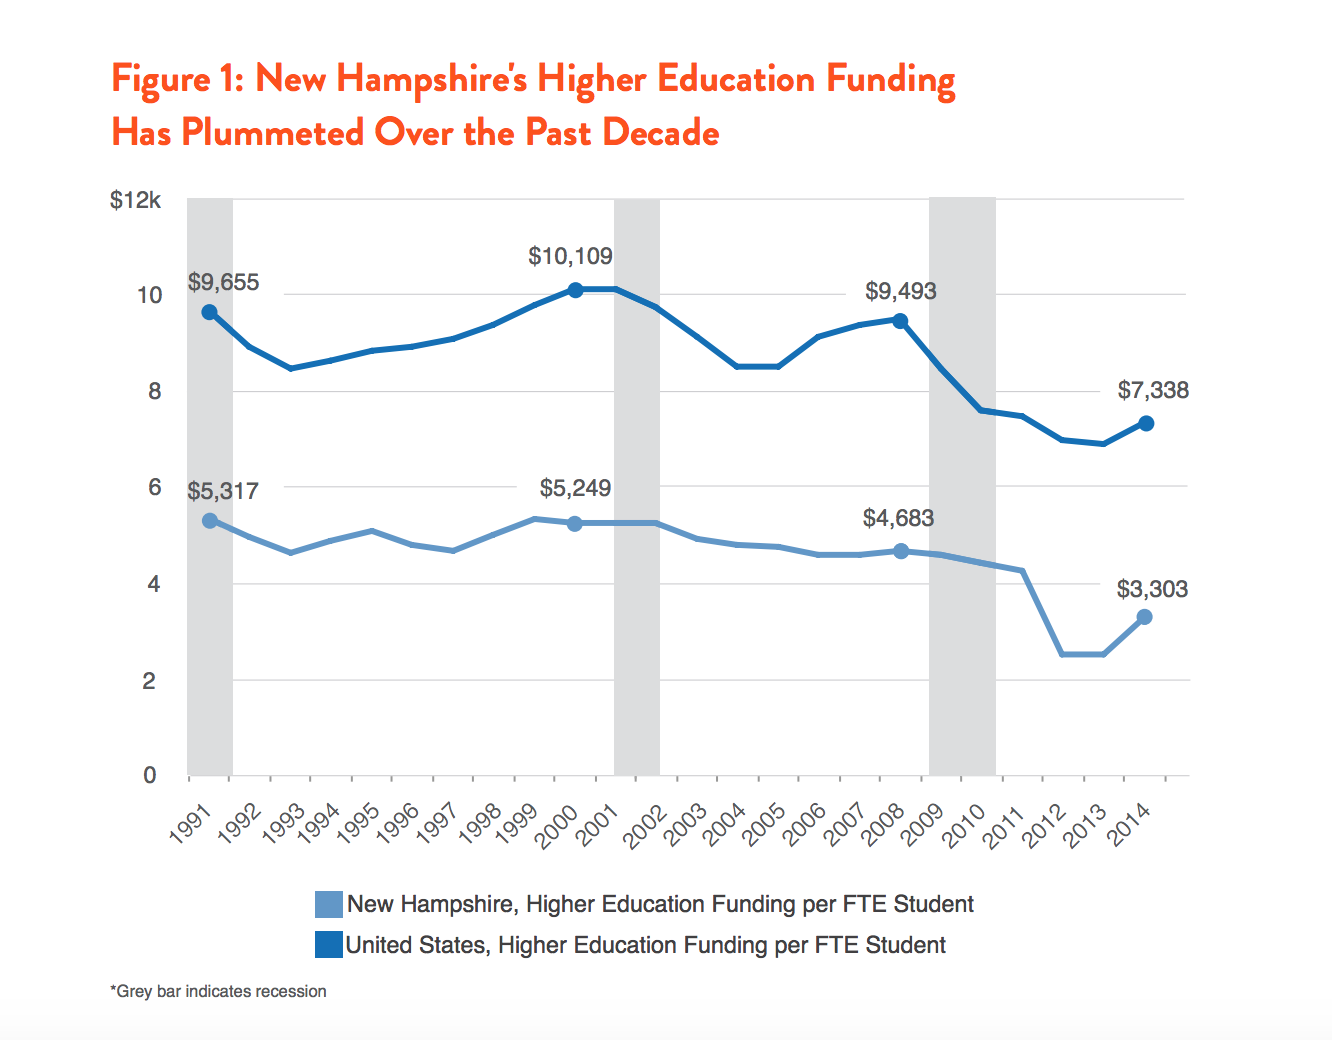
New Hampshire’s overall funding for higher education has declined precipitously since its pre-Great Recession peak in 2010. Funding per student in the state, although still above the national average, has fallen even more dramatically, since enrollments have risen significantly even as total funding fell. Though state funding for higher education has historically risen and fallen in tune with the business cycle, the post-Great Recession decline appears to be a worrisome departure from the historical pattern.
Overall, New Hampshire’s higher education funding fell from its peak of $153.8 million in 2008 to a low of $87.3 million in 2012, a 43 percent decline in just two years.
Funding per full-time equivalent (FTE) student fell 45 percent between 2008 and 2013, though recovered somewhat in 2014.
Despite last year’s increase, New Hampshire’s funding per FTE student is the lowest of any state in the country.
SKYROCKETING TUITIONS
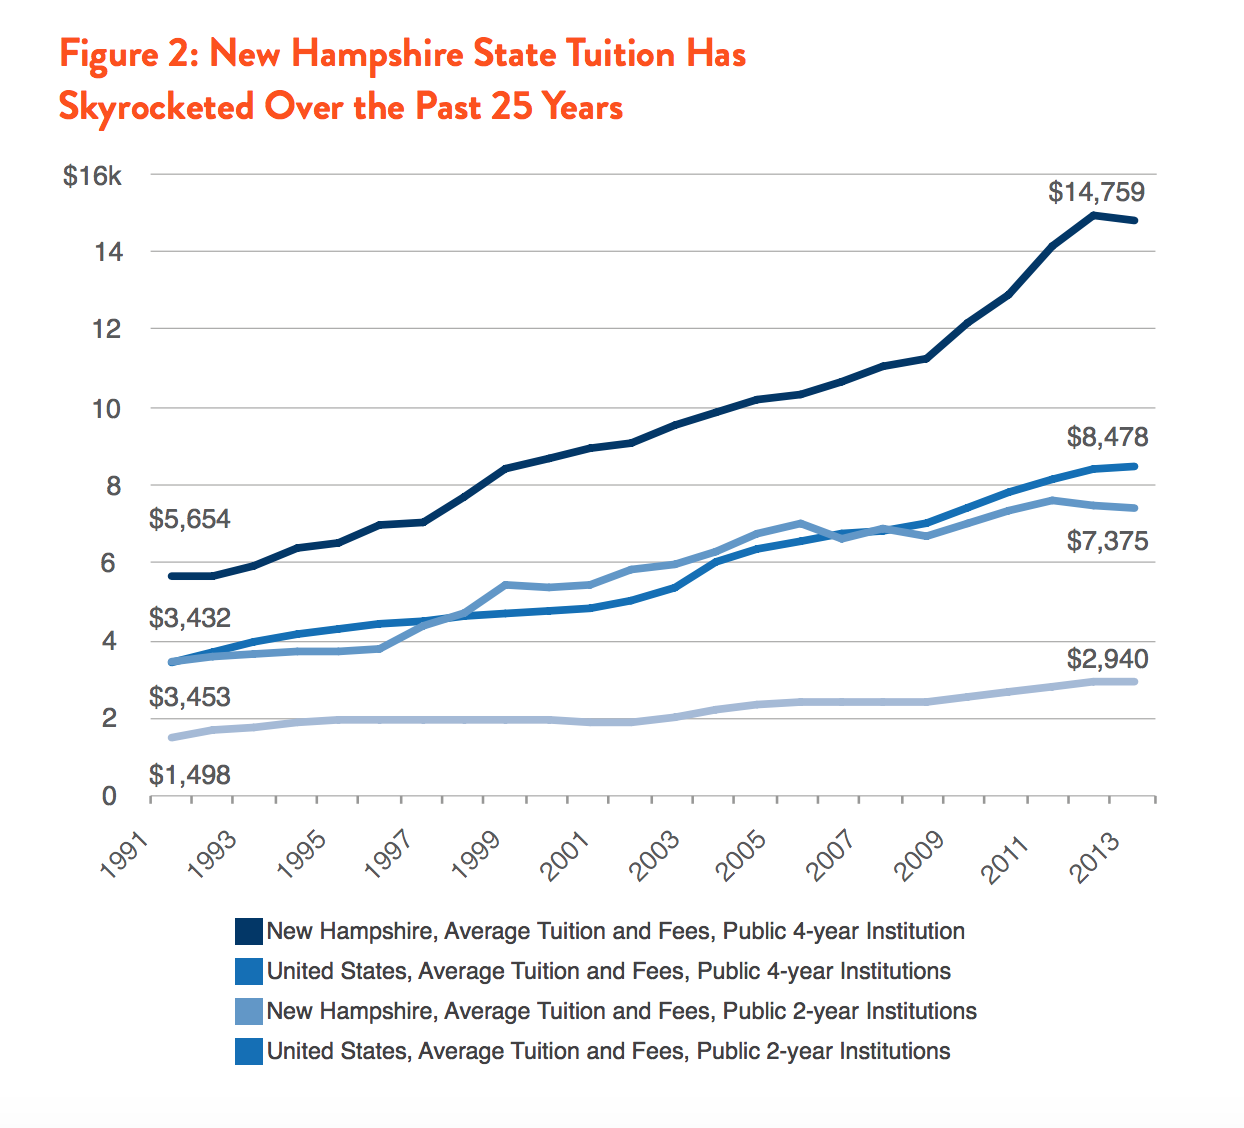
New Hampshire’s rock-bottom financial support for its public colleges and universities has translated into the highest average tuition and fees of any state, making college increasingly unaffordable for the state’s students.
Over the past two decades, average yearly tuition and fees at public four-year institutions in New Hampshire has risen by $9,105, a 161 percent increase.
Tuition and fees have risen almost as quickly at 2-year institutions, climbing 114 percent, or $3,922, over the same period.
Tuition prices at both 4- and 2-year institutions in New Hampshire have been consistently higher than the national average for the past two decades, a gap which has increased significantly, leading to New Hampshire having the most expensive average tuition of any state in the country at both 4-year and 2-year institutions.
SHIFTING COSTS TO STUDENTS AND FAMILIES
Tuitions have been rising far more rapidly than family incomes, causing the tuition costs to take an increasingly large bite out of family budgets. The increasing unaffordability of a college education in the state has forced New Hampshire’s students to borrow more to pay for school. In fact, because of the state’s nation-high tuitions, New Hampshire students graduate with the highest student debt levels in the country.
In 2000, average tuition and fees alone at the average public four-year institution in New Hampshire cost 12 percent of a median household’s income; by 2012 this share had reached 22 percent.
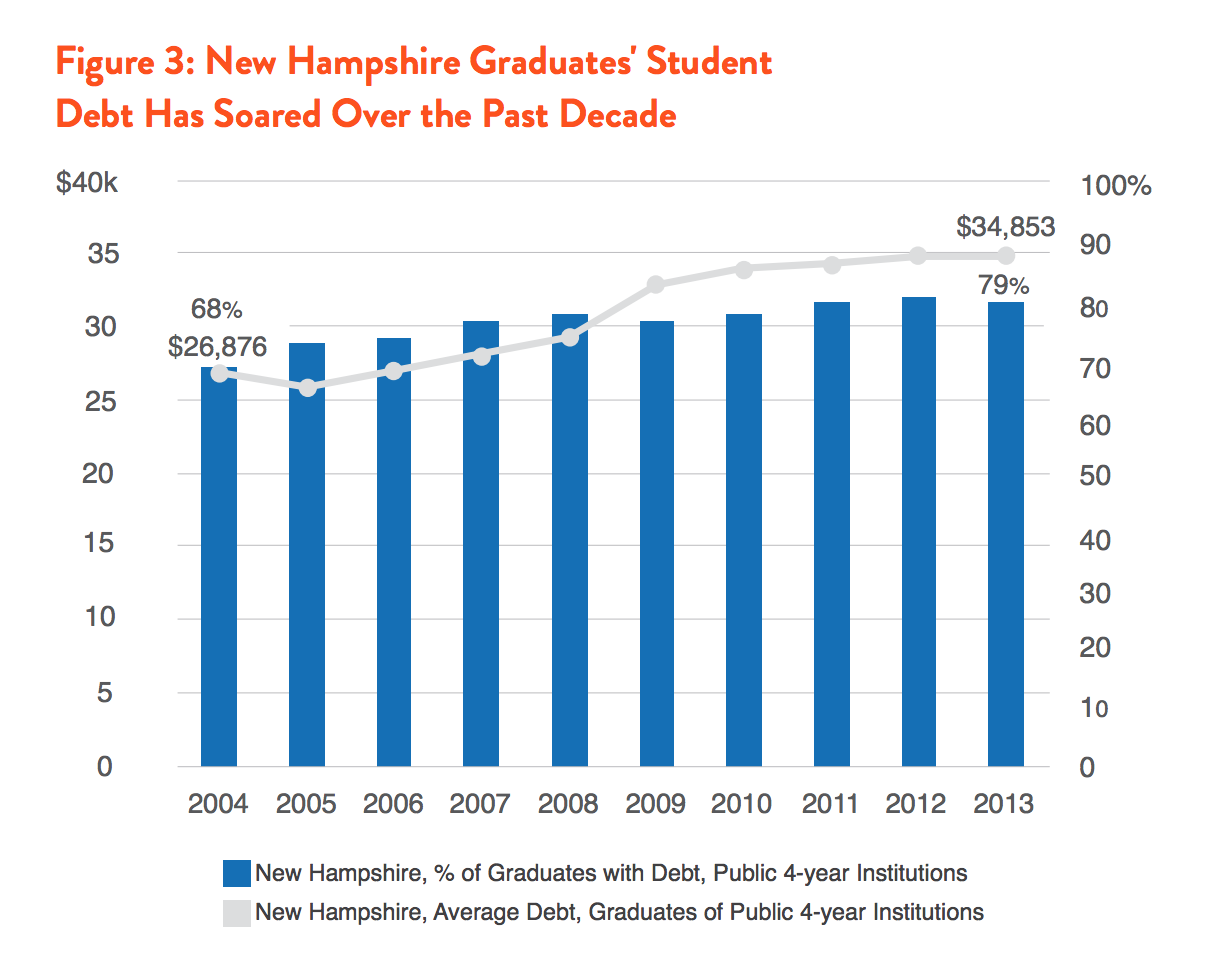
Seventy-nine percent of students graduating from public four-year colleges in New Hampshire in 2013 left with some student debt (see Figure 3 below), the highest share in the nation.
The average debt of indebted graduates has risen precipitously. Indebted students graduated with an average of $34,853 in debt in 2013, a 30% rise since 2004 and again the highest average in the country.
INCREASING ENROLLMENTS, HIGH ENROLLMENT AND COMPLETION RATES
Despite the sky-high cost of a higher education in the state, enrollments at New Hampshire’s colleges and universities have risen steadily over the past two decades, in part due to the high share of New Hampshire’s young people enrolled in college. Additionally, in spite of the tuition burden, graduation rates at both the state’s 4-year and 2-year schools continue to outpace those of the country as a whole.
Total FTE enrollments at New Hampshire’s colleges and universities have risen steadily, increasing 35 percent from 24,948 FTE students in 1991 to 33,665 in 2013.
New Hampshire has a very high enrollment rate: 49.1 percent of New Hampshire’s high school graduates enrolled in higher education in 2013. This is the 4th-highest share of any state in the country, well above the national average of 43 percent.
The graduation rates at New Hampshire’s 4-year colleges and universities also outpace the nation. As of 2013, 70.1% of students at the state’s public 4-year institutions graduated within 6 years, a rate more than 12 percentage points above the national average and the 3rd highest in the nation.
The share of students at the state’s two-year institutions who graduated within 3 years was also higher than the national average: at 21% in 2013, it was 1.5 percentage points above the national average, good for the 21st highest in the country.
WHAT NEEDS TO HAPPEN?
Even though New Hampshire’s graduation rates from its 4-year public colleges and universities are well above the national average, they are still too low to meet the future demands of the state’s labor market, which will increasingly require a postsecondary credential. Additionally, payments on the sky-high student debt of New Hampshire’s graduates will consume large portions of their income, limiting the economic value of their degrees and consequently their contribution to the state’s economy. With the recent cuts in higher education funding, New Hampshire is endangering the quality of its institutions of higher learning, threatening the state’s economic competitiveness and the future of its young people. To reverse course, the state will need to commit to bold solutions that can strengthen and stabilize funding for New Hampshire’s state universities and colleges, and provide greater financial support to working- and middle-class students.
ENDNOTES
1. All years in this brief have been shortened to represent the fiscal year; thus, 2008 represents fiscal 2008, which covers the period between mid 2007 and mid 2008.
2. Data on state higher education funding is from Illinois State’s Grapevine survey: http://education.illinoisstate. edu/grapevine/. Full-time equivalent student data is from the Department of Education’s Digest of Education Statistics: http://nces.ed.gov/programs/digest/.
3. All dollar figures in this brief have been adjusted for inflation to allow a more accurate comparison between different years.
4. National Center for Education Statistics, “Digest of Education Statistics”, various years. http://nces.ed.gov/programs/digest/.
5. The Institute for College Access and Success (TICAS), “College Insight” data, http://collegeinsight.org/#explore/go&h=af0f0e9a70bf890cdfe0d3350e3a0c4b.
6. National Center for Education Statistics, “Digest of Education Statistics, 2012”, Table 302.65, http://nces.ed.gov/programs/digest/d14/tables/dt14_302.65.asp.
7. National Center for Education Statistics, Integrated Postsecondary Education Data System, via The Chronicle of Higher Education: http://collegecompletion.chronicle.com/state/#state=ct§or=public_four