I. Introduction
America’s economy has been an awesome engine of wealth creation over the past two generations, but the new prosperity has disproportionately gone to the wealthiest. Between 1979 and 2010, according to the Congressional Budget Office, American households in the richest one percent of the income distribution saw after-tax income gains of 202 percent —while the 60 percent of the households in the middle saw their incomes grow by only 39 percent over this same period. The CBO also finds that the share of after-tax income going to the richest one percent has increase d from 7.4 percent in 1979 to 12.8 percent in 2010. At the same time, the share going to least well-off 60 percent of Americans has declined, from 36.2 percent in 1979 to 32.5 percent in 2010.
According to much research, social mobility—the very essence of the American idea—has remained stagnant for decades, and many of our global competitors are now performing far better on what we have long considered to be the American Dream. For example, young men are earning ten cents per dollar less than their fathers did 30 years ago, according to research from Demos. Princeton economist Alan Krueger observes that the economic data “challenge the notion that the United States is an exceptionally mobile society. If the United States stands out in comparison with other countries, it is in having a more static distribution of income across generations with fewer opportunities for advancement.”
The rising inequality of wealth and income that threaten shared prosperity and democracy long preceded the financial crash of 2008 and the downturn that followed. As a result of major economic and policy changes over the past three decades, the gap between the richest and the rest of America has become a chasm. Many jobs do not pay enough to cover basic living expenses, much less allow workers to save and build for the future. In fact, a quarter of full-time working-age adults are still not earning enough money to meet basic economic needs like housing, utilities, food, health care, and transportation for themselves or their families.
A host of public policy choices have driven inequality and insecurity—including tax cuts that disproportionately benefitted the wealthy, state divestment in public higher education, financial deregulation, and the weakening of labor protections, to name only a few. Job growth on its own will not reverse inequality: the shift to a low-pay service economy has in fact accelerated during the economic recovery. Over the next two decades, the Department of Labor projects that the largest job growth will be in low-wage jobs offering little opportunity for advancement, few benefits, and not enough pay to allow workers to build wealth. Meanwhile, most of the good jobs that are created will require a post-secondary education that is likely to remain out of reach for millions, as states continue to shift the cost of higher education onto students and families.
Even as inequality has worsened, national action has been lacking. Over recent decades, many political leaders have failed to reckon with a basic fact of the new economic era—for millions of Americans, no amount of individual effort or self-improvement or thrift can guarantee a secure middle-class life. The American social contract—a promise of opportunity and security for those willing to work hard—is fundamentally broken.
Dramatic new public policy initiatives are needed to accomplish two broad interrelated goals: to ensure that all Americans have a chance to move into the middle class and, second, to ensure greater security for those in the middle class. Such initiatives must move far beyond incremental measures, and be of sufficient scale to permanently address the economic insecurities of what is now a vast number of U.S. households.
Patricia Locks and Walmart a case study on inequality
To understand the impact of rapidly rising inequality on the American economy, there is no better place to look than the nation’s largest private employer, the world’s biggest public corporation, and a company whose customers and employees struggle on the opposite side of the economic divide from its owners. Many of Walmart’s 1.3 million U.S. employees raise their families near the poverty line as they contribute to the company’s $16 billion in annual profits. The primary beneficiaries of their efforts are the heirs of Sam Walton, who now hold more than 50 percent of the company’s public shares. Walmart’s business model has flourished over the past 20 years, with the growing economic insecurity leading to more price-conscious customers. However, in recent years, the company’s economic performance has stumbled, as a growing number of its U.S. customers—like its own employees—lack the purchasing power needed for sales to flourish. A company that played a leading role in exacerbating American inequality by compensating its employees meagerly and squeezing suppliers and competitors is now being undermined by the very economy it helped to create. This story is emblematic of the larger state of the American economy. But it also has a very human face.
Patricia Locks has worked at a Seattle Walmart for 11 years and currently earns $13.10 an hour. Among Walmart’s front-line employees, she is far from the bottom, due in part to Washington having a minimum wage 27 percent higher than the federal minimum. A recent study from the National Bureau of Economic Research estimates that Walmart cashiers are paid an average $8.48 an hour, while the company has stated that its average wage is $11.81 for hourly workers.
Yet Patricia Locks struggles. As is increasingly the case with low-paid workers, her schedule is unpredictable but she usually works about 34 hours each week. She struggles to support herself and her 14 year-old daughter, but her unstable schedule prevents her from taking on a second job. Her monthly wage is $1,782, which is supplemented by food stamps ($15 a month) and child support ($371 a month). Many low-paid workers must rely on public benefits because employers pay too little for them to support themselves. Locks spends $780 a month on rent, $105 on personal care, $110 on utilities, $34 for health care and $321 for other expenses. That leaves her only $432 a month for everything else: school, paying off debt, food and doctor’s visits.
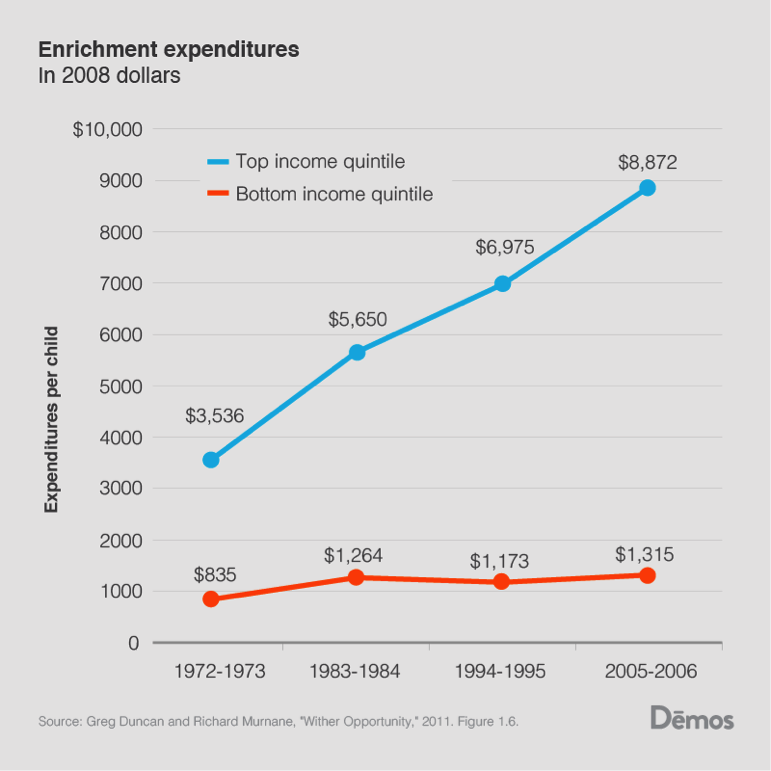
Locks has thousands of dollars in unpaid medical debt, as do millions of Americans—a recent study finds that medical debt was responsible for 62 percent of all bankruptcies in 2007. She often has to skip doctor’s visits even though she’s been diagnosed with diabetes. Here too, her experience is common: a recent Gallup survey finds that three in ten Americans have forgone recommended medical treatment because of costs. Locks’ budget doesn’t leave her with extra funds to supplement her daughter’s education or let her participate in extracurricular activities. A recent study finds that the wealthy spend seven times more on enrichment for their children than the poor. All of these sacrifices are still barely enough to keep Locks from falling further into debt, another new reality for most Americans.
Patricia’s is not the only Walmart story, however. On the other side of the economic divide sit the six richest members of the Walton family, Christy, Jim, Alice, S. Robson, Ann, and Nancy, who have a net worth of $144.7 billion combined. Their great wealth stems not just from money they inherited from company founder Sam Walton, but from the ongoing revenue stream that Walmart’s operations (and workers like Patricia) generate. In the fiscal year ending in January 2014, the Walton heirs took home $3 billion in dividend payments from Walmart, enough to give a $2 an hour raise to the 825,000 company employees who make less than $25,000 a year. In 2010, when the family’s fortune was worth “just” $89.5 billion, it was already greater than the total financial assets of the least-wealthy 41.5 percent of American families combined. That six people could have more wealth than nearly half of American households without working for it is extraordinary—but unearned wealth is increasingly a part of the American story of success: six of the ten wealthiest American are heirs, not entrepreneurs. Recent data from Thomas Piketty finds that the wealthiest 0.1 percent make most of their income from capital ownership, not from labor.
The picture of growing inequality between work and wealth epitomized by Walmart stands in stark contrast to the idea of America. Widely-shared prosperity is a signature promise of American society. It has made ours the most hopeful and dynamic country on earth and it is a foundation of strong democracy. Fortunately, in a democracy, Walmart’s business practices are governed by laws, laws which, if changed, could reshape opportunity for people like Patricia and her family.
II. How Inequality is Experienced at the Household Level
The following sections describe the effect of inequality and the related rise of economic insecurity for most Americans at the household level.
A. Stagnating Real Incomes for All but the Richest
In the years after World War II, as economic growth and productivity increased, the workers contributing to that prosperity saw commensurate gains in wages, across the income spectrum. However, that connection has broken down over the last thirty years: while productivity increased 65 percent in the three decades between 1979 and 2013, the inflation-adjusted wages of the median worker grew just eight percent, and that growth occurred exclusively as a result of the strong economy of the late 1990s, according to analysis by the Economic Policy Institute. Since 2000, the picture of earnings and income has become still more stark: despite a productivity increase of 22 percent between 2000 and 2012, inflation-adjusted median family income in the United States has declined seven percent, from $68,949 to $64,053, over the same period.
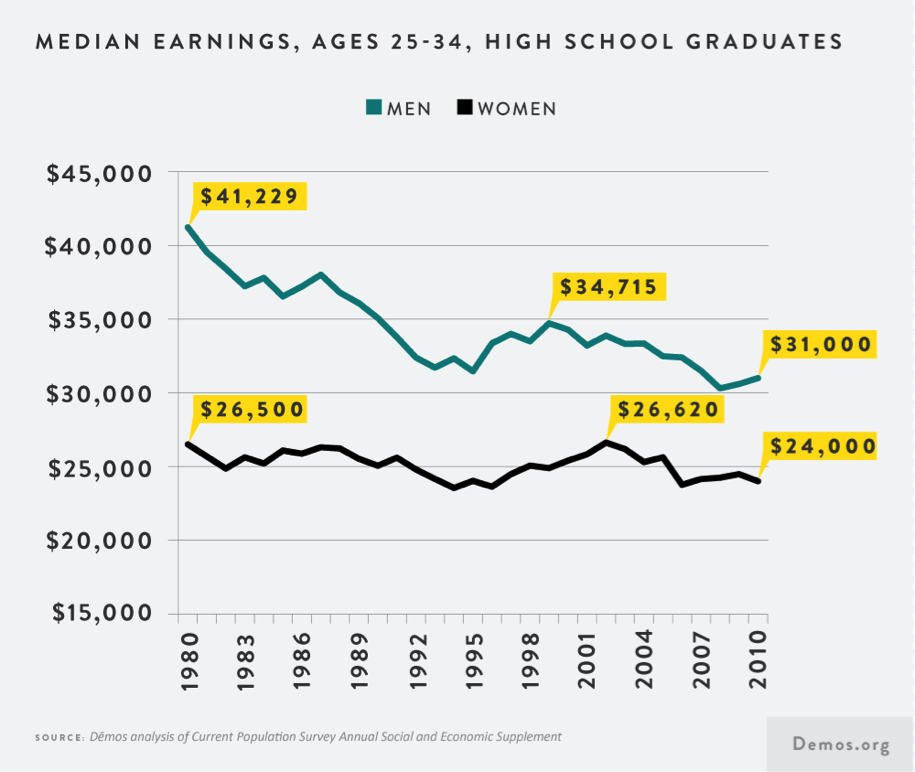
Part of the story is the increasing economic returns to education, which left workers without a college degree lagging further behind in income and employment. For example, as chronicled in Demos’ State of Young America report, in 1980, a young man with a bachelor’s degree earned roughly $9,100 more than a young man with a high school degree. Today, he earns $20,000 more, and the trends are similar among women. However, a college degree has not entirely protected workers from declining wages in the years since 2000. Between 2000 and 2014, the wages of young college graduates fell 7.7 percent, translating into a decline of more than $2,954 for full-time, full-year workers. This suggests that boosting college attainment, while critical, will not be sufficient to reduce inequality or re-establish the link between economic growth and productivity and wage growth.
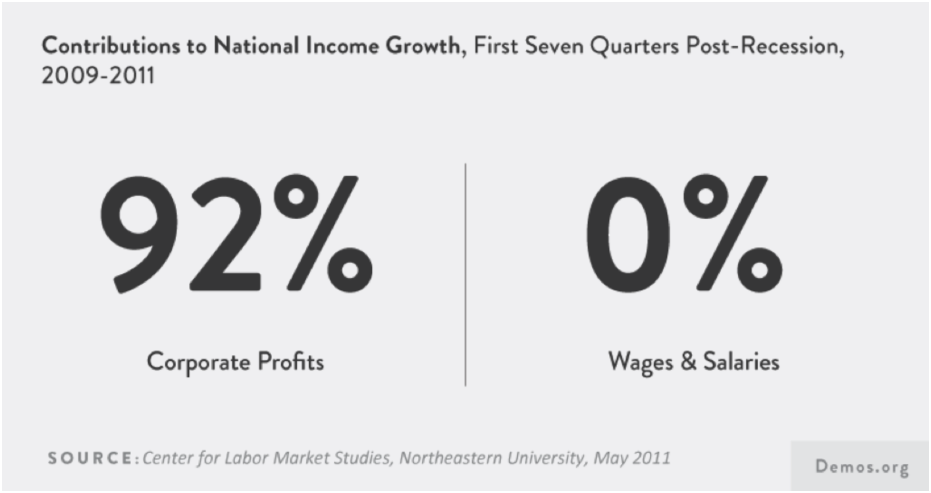
A bigger part of the story has to do with the rising share of the nation’s gross domestic product flowing to corporate profits rather than wages and the larger share of overall income going to the highest one percent of income earners. Until 1975, wages generally accounted for the majority of the nation’s GDP, but by 2013 wages had declined to a record low of 42.2 percent. Research from Northeastern University finds that in the first seven quarters after the end of the Great Recession, American corporations received an astonishing 92 percent of the growth in real national income, while aggregate workers’ wages and salaries actually declined by $22 billion and contributed nothing to national income growth.
Personal income has become far more concentrated among the richest, a trend that has also accelerated rapidly since the end of the Great Recession. Economist Emmanuel Saez finds that between 2009 and 2012, the incomes of the highest-paid one percent of Americans grew by 31.4 percent while the incomes of the rest of Americans grew by only .4 percent. In effect, the top one percent captured 95 percent of the income gains in the first two years of the recovery. Over the full period studied (1993 – 2012), real income growth for the top one percent was 86.1 percent and growth for the bottom 99 percent was only 6.6 percent. In total, the one percent captured 68 percent of income growth.
Finally, while the real wage data above is adjusted for inflation, this story does not fully account for the cost of health care, child care and higher education, which have seen their costs grow far more quickly than the Consumer Price Index. For example, the average annual employee contribution to health premiums has more than tripled since 1999, growing from $1,543 to $4,823 for family coverage and $318 to $1,081 for single coverage. The national average cost for center-based child care in 2011 was $8,900 for full-time care for an infant and $7,150 for full-time care for a preschooler. Center-based child care fees for two children (an infant and a four-year-old) exceeded annual median rent payments in all 50 states and the District of Columbia. This is all the more troubling since according to the Center for Housing Policy, 22.1 percent of all working U.S. households (renters and owners combined) also experienced a severe housing cost burden in 2012, spending more than 50 percent of household income on housing costs, including utilities. Meanwhile, at public four-year universities, average tuition has risen 117 percent (in real terms) since 1993. The American middle class, and workers aspiring to a middle-class standard of living, are squeezed between stagnant and declining wages and higher costs for the fundamentals of a middle-class life. Aside from the major advances in health care coverage and affordability in the Affordable Care Act of 2009, policymakers have done little to address this new reality.
B. Priced Out of Upward Mobility
During the post-war industrial era, a post-secondary education was not required for a single breadwinner to support a family. For example, in 1970 male high school graduates earned a median income equivalent to $45,432 in today’s dollars—32.5 percent more than they earn today. However, just as automation, de-unionization and globalized manufacturing began to put downward pressure on the wages and job opportunities of non-college educated Americans, state and federal policymakers allowed college to become less affordable to non-affluent families. Tuition at public four-year schools has more than tripled in the past three decades, rising faster than either inflation or growth in family income. The United States went from first in the world in degree-holders to 11th in the course of one generation. The enrollment gap between low-income families and high-income families is as high as it was three decades ago. Many hardworking students are priced out of pursuing and completing higher education—a fundamental component to upward mobility and opportunity in American society. And those who do enroll are leaving college with unprecedented levels of debt, often without a degree in hand.
A major factor in the rise of public college costs is declining state support for higher education. Demos’ report The Great Cost Shift finds that, despite appropriating $75.6 billion for higher education in 2010 (from $65.1 billion in 1990), states actually devoted less of their wealth to higher education than they did just 20 years ago. After controlling for inflation, states collectively invested $6.12 per $1,000 in personal income in 2010, down from $8.75 in 1990, despite the fact that personal income increased by 66.2 percent over that period. As a result, between the 1990 and 2009 academic years, the real funding per public full-time equivalent (FTE) student dropped by 26.1 percent, falling from $8,608 to $6,360. Funding levels are failing to keep pace with population growth, as the largest generation since the Baby Boomers has come of college age against the backdrop of a nationwide trend away from taxes and public investment. If states had provided the same level of funding as in 1990, total appropriations in 2009 would have equaled approximately $102 billion, an amount 35.3 percent greater than the actual one.
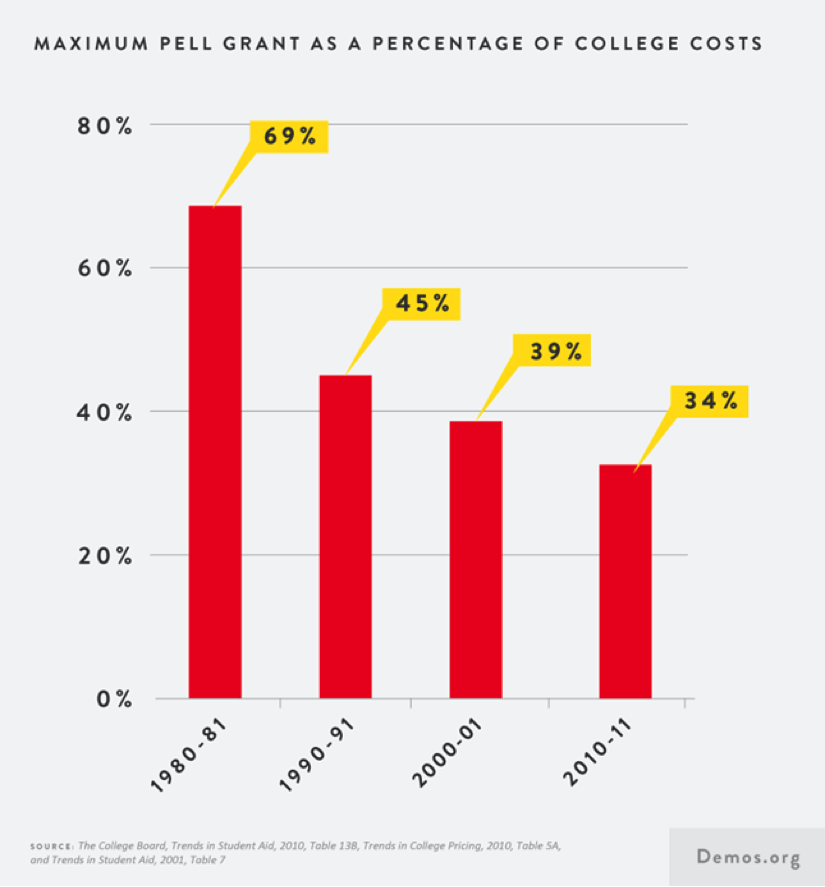
Although increasingly large numbers of high school graduates enroll in some type of college, college completion has stagnated: today more than half of students who begin college never complete their degrees. Financial barriers are the primary reason why students do not finish college. The high cost of college is particularly prohibitive for students from lower-income families, and shifts away from need-based aid are only exacerbating the challenge. In 2013, just 32 percent of all federal student aid was grant-based, down from 55 percent in 1980. Similarly, in 2003-2004, the maximum Pell grant covered 87 percent of the costs of a four-year public college, compared to just 63 percent in 2013-2014.
Rising tuition and limited financial aid has more students than ever financing their college education with debt and at ever-increasing amounts. In addition, students are struggling to meet rising college costs by enrolling part-time and working long hours. Two-thirds of community college students and 46 percent of four-year college students work more than 20 hours a week while attending school, greatly increasing their risk of dropping out.
C. The Debt-for-Diploma System
Student loan debt is another area of growing economic concern. Due to rising college costs and diminishing grant aid, students are increasingly reliant on interest-accruing loans to pay for college, a dramatic shift in norms over the course of a single generation. In 2012, 71 percent of college seniors (at public or non-profit schools) graduated with debt, with borrowers carrying an average burden of $29,400 (up from only 33 percent of students in 1992). Graduates of for-profit schools are even deeper in debt: 88 percent graduated with debt and their average was $39,950 as of 2012. All told, borrowers now owe more than $1.12 trillion in student loan debt, a $124 billion dollar increase from last year. And there are increasing signs that student loan borrowers are becoming unable to repay this debt: 10.9 percent of all student debt is 90 or more days delinquent or in default (worth $122 billion). Already student debt is causing young Americans to delay building the financial assets that are necessary to middle-class security, including purchasing homes and saving for retirement. And the rising rate of defaults on student debt is impairing the credit of many Americans as well, making it more difficult to borrow or find employment among the nearly half of employers who now screen credit histories during hiring.
The consequences of student loan debt can have a profound impact on the economy as a whole. According to Demos study, At What Cost?, $53,000 in education debt (the average amount held by a dual‑headed college educated household) leads to a net worth nearly $208,000 lower than if the household had not been forced to service debt used to pay for their college education. Over time, the indebted household will end up with a net worth 17 percent lower than a similar non-indebted household. Over the economy as a whole, the $1 trillion in total outstanding student loan debt will lead to $4 trillion in lifetime lost assets for indebted households, not even accounting for the heavy impact of defaults.
D. Wealth and Debt
Student debt is just one aspect of the overall divergence between compounding wealth for the rich and compounding debt for the average American. Wealth—home equity and savings nest eggs—provide a buffer against hard times and increase household economic stability, helping to fuel middle-class optimism and self-improvement. Household assets have a particularly powerful effect on how well children will do in their own independent lives.
The wealthiest one percent have seen their share of American assets increase dramatically over the past three decades, and within that one percent, the top 0.1 percent has grown even more rapidly. Thomas Piketty estimates that in the United States, the wealthiest one percent control 33.8 percent of the assets, and the wealthiest 0.1 percent control 14.7 percent. In 1970, the similar figures were 28.2 percent and 11.5 percent. These estimates are likely to understate the wealth of the richest in our society, due to the increasing use of overseas wealth havens. Recent research by Philip Vermeulen of the European Central Bank confirms this. Vermeulen’s estimates would put the share of wealth controlled by the wealthiest one percent at 37 percent of all wealth in the U.S.
On the other side of the equation, most Americans are increasingly burdened by debt. In recent decades, financial deregulation and the aggressive marketing of toxic loans preyed on Americans’ aspirations to build assets, fueling an unsustainable housing bubble that began to deflate in 2006. The bubble and the economic crash that followed decimated the wealth of American families, causing more than 2.7 million homeowners to lose their single largest asset to foreclosure and tens of millions of others to see their homes’ value drop dramatically. The crash hit those who had carefully saved and invested in their homes as well as speculators who gambled on a rising real estate market. Overall, the nation lost more than $6.5 trillion in home equity since the housing market peaked in 2006. At the same time, the value of retirement savings collapsed as the stock market plummeted, destabilizing hopes for a secure retirement. Not having enough money for retirement became Americans’ biggest financial worry. Even as Americans saw their assets diminished, the dramatic and long‑lasting rise in unemployment and underemployment contributed to Americans’ difficulty paying back their debts.
The prevalence of asset poverty in America is dramatic. The Federal Reserve, Report on the Economic Well-Being of U.S. Households in 2013, released in July 2014 details the depth of the problem. Nearly half of survey respondents were not planning for retirement, and 31 percent reported having no retirement savings or a pension. Only 39 percent reported that they had a “rainy day fund” sufficient to pay for three months of expenses, and only half could pay a $400 bill without selling something or borrowing money. The Great Recession was a large factor; 57 percent of those who had savings before the recession said they had used up some or all of their saved money.
This degree of insecurity threatens to reverse one of the great policy victories of the 20th century: the creation of a middle-class senior citizen population. As a result of employers shifting from traditional defined benefit pensions to defined contribution plans, Americans’ retirement security is now more at risk than any time since Social Security was created. Only half of workers currently have any kind of retirement savings accumulated outside of Social Security. The vast majority of those who do are offered only the 401(k)-type plans that are an inadequate solution for retirement for multiple reasons. First, they are inordinately expensive. The fees charged by firms that manage 401(k) accounts can cost workers a quarter or more of their retirement savings. According to a widely-cited 2012 study by Demos, The Retirement Savings Drain, over a lifetime, these fees can add up to more than $155,000 in losses for the average household. In addition, 401(k)s are a poor substitute for traditional pensions because they place the burden of investment risk exclusively on individual workers. After working throughout their lives, older Americans relying on individual retirement plans could lose their life’s savings in a market crash, invest so conservatively that they ensure themselves weak returns, or outlive the funds they have been able to save. Pension-style plans, meanwhile, ensure security by spreading these risks among many plan participants over a long time horizon—no individual puts their entire retirement in danger. Yet in 2012, just 17 percent of private sector workers participated in a traditional pension as employers have opted for the low-cost 401(k) option instead.
Instead of saving for the future, millions of working- and middle-class Americans are struggling just to service their debts. Demos has been chronicling the rapid rise in debt for nearly a decade: as wages stagnated and lagged behind the cost of living, Americans increasingly turned to borrowing—from credit card debt to loans against the value of their homes—to make ends meet and to try to get ahead. The deregulation of consumer lending that began in the 1980s meant that many of these loans included deceptive and predatory terms that were highly profitable for lenders but led to record bankruptcies and debt-to-income ratios. Lenders aggressively marketed high-interest credit cards with hidden fees, exorbitant payday loans, and costly subprime mortgages (even to homebuyers who could have qualified for a better rate—particularly if they were African American or Latino). While some of the worst practices unleashed by deregulation have been curbed by regulatory enforcement, the Credit CARD Act of 2009, and the Dodd-Frank Act of 2010, Americans remain vulnerable to the hangover of the deregulatory experiment: widespread servicer and debt collector abuse.
Even today, as credit card debt has declined post-crash, 40 percent of among low- and middle-income households carrying credit card debt still rely on their cards to pay basic living expenses because they do not have enough money in their checking or savings accounts, according to Demos’ own national household survey, The Plastic Safety Net. Credit cards are also widely used to pay medical bills and cope with spells of unemployment, in effect a high-interest way to make up for gaps in the public safety net.
Another problem arises from the prevalence of employment credit checks. Despite a lack of evidence that personal credit history predicts employee performance or likelihood to steal or commit fraud, nearly half of all employers now conduct credit checks as part of their hiring process. As a result, job seekers with credit damaged as a result of medical debts, divorce, layoffs or identity theft are screened out of jobs they are otherwise qualified for. Employment credit checks disproportionately harm people of color because of damage done by predatory lending that continues to target communities of color, as well as the enduring impact of racial discrimination in employment, lending, education, and housing. The result is a vicious cycle: it’s hard to pay your bills if you can’t get a job, but unpaid bills may also prevent you from getting a job.
Fortunately for these borrowers, smart regulation has recently made credit cards a better, fairer financial product for American consumers. The Credit CARD Act of 2009 has benefited millions of households in ways that directly affect their monthly budgets. A recent study by Sumit Agarwal, Souphala Chomsisengphet, Neale Mahoney and Johannes Stroebel find that the CARD Act has saved U.S. consumers $12.6 billion each year. Demos’ national survey found that the Credit CARD Act has empowered Americans to take control of their finances by increasing the transparency of credit card statements and dramatically reducing excessive fees and penalties. For example, the Act set new standards for clarity and disclosure in monthly billing statements. Credit card statements must now include information on how long it will take to pay off the current balance if consumers pay only the minimum payment amount each month. Ninety percent of households in our survey report they have noticed the change and one‑third say they are responding to the new information included on credit card statements by paying their balances down faster. The CARD Act also offers consumers a reprieve from the assorted charges and fees that accompanied many accounts. In 2012, just 28 percent of households reported paying late fees—a significant decline from the one half of indebted households that accrued these fees in 2008. Of those who experienced late fees, only 29 percent saw interest rates go up on that card as a result, down from 53 percent in 2008, and only 14 percent experienced interest rate increases on their other credit cards. Finally, the Credit CARD Act virtually eliminated over-the-limit fees, previously one of the credit card industry's most abusive and profitable practices. Instead of denying transactions that exceeded a consumer’s credit limit, credit card companies used to process them and then charge consumers a fee—whether the consumers wanted to go above their credit limit or not. The Credit CARD Act requires consumer authorization for exceeding limits, virtually eliminating these fees.
The following section describes the effects of inequality on three economic goals—economic growth, mobility, and opportunity.
III. The Impact of Inequality on Our Economy
A. Inequality and Growth
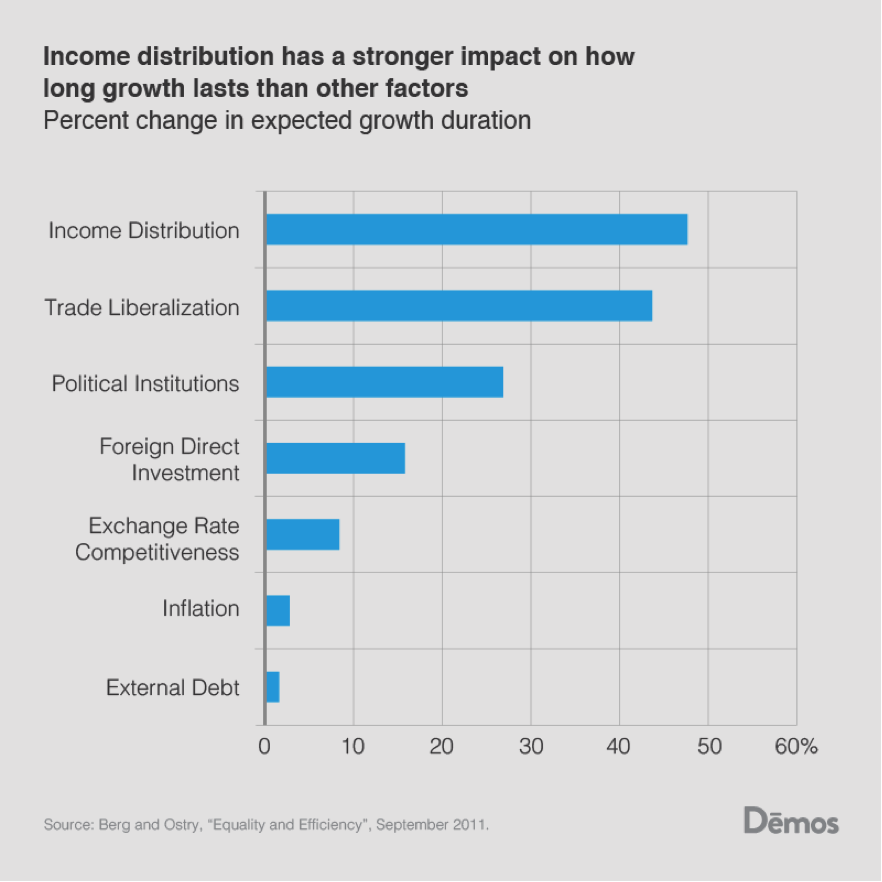
The previous sections have detailed inequality’s effect on households, but it is worthwhile to note that evidence is mounting that inequality harms our nation’s overall GDP growth rates as well. Standard and Poor’s recently reduced its ten year U.S. growth forecast by 0.3 percentage points, citing “extreme” income inequality. A 2011 International Monetary Fund (IMF) study by Andrew Berg and Jonathan Ostry finds that income distribution has a stronger impact on the duration of a country’s growth than trade, external debt and political institutions.
A 2014 IMF follow-up study finds that redistributing income doesn’t have a large effect on growth, and therefore increasing redistribution can be pro-growth (since inequality stifles growth). This supports a growing literature on the subject.
The literature shows that when consumers don’t have money to spend, growth slows. Because the wealthy are more likely to save than the poor and middle class, a higher concentration of wealth in their hands will stifle demand, cutting off the recovery. Even conservative Martin Feldstein, formerly the chief economic advisor to President Ronald Reagan, has recognized that economic growth has been stalled by inadequate demand. Further, two studies have linked increasing debt, driven by inequality, to credit busts. In their book, House of Debt, Atif Mian and Amir Sufi argue that rising debt has reduced consumer spending, weakening the recovery. Growth also reduces the ability of poor and middle-class people to develop important human capital, further endangering growth.
B. Inequality and Mobility
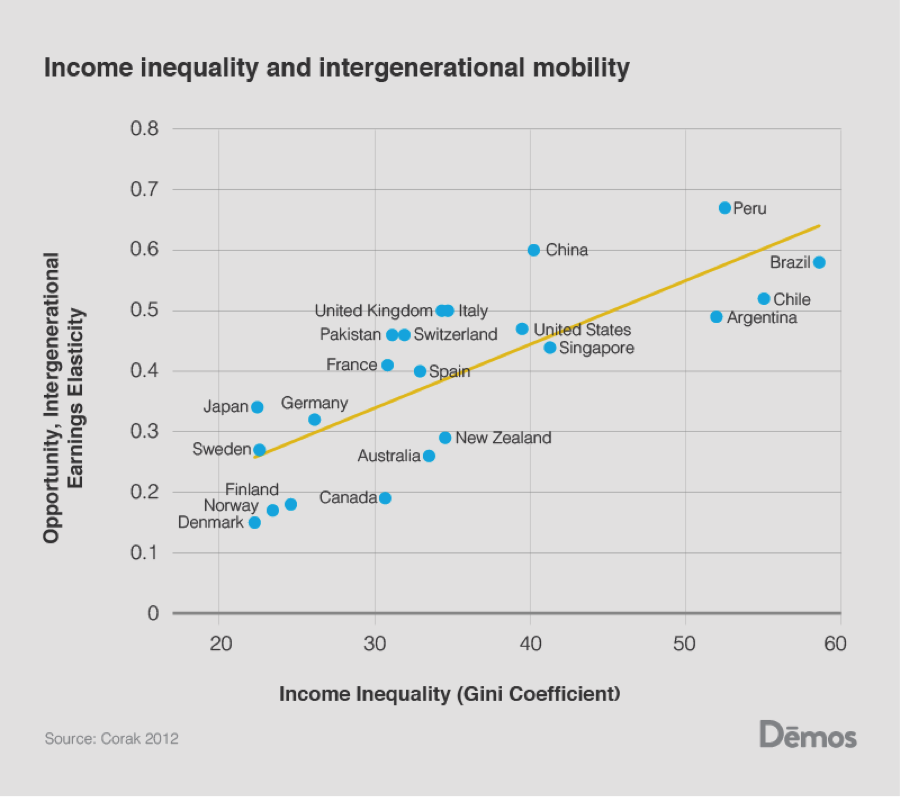
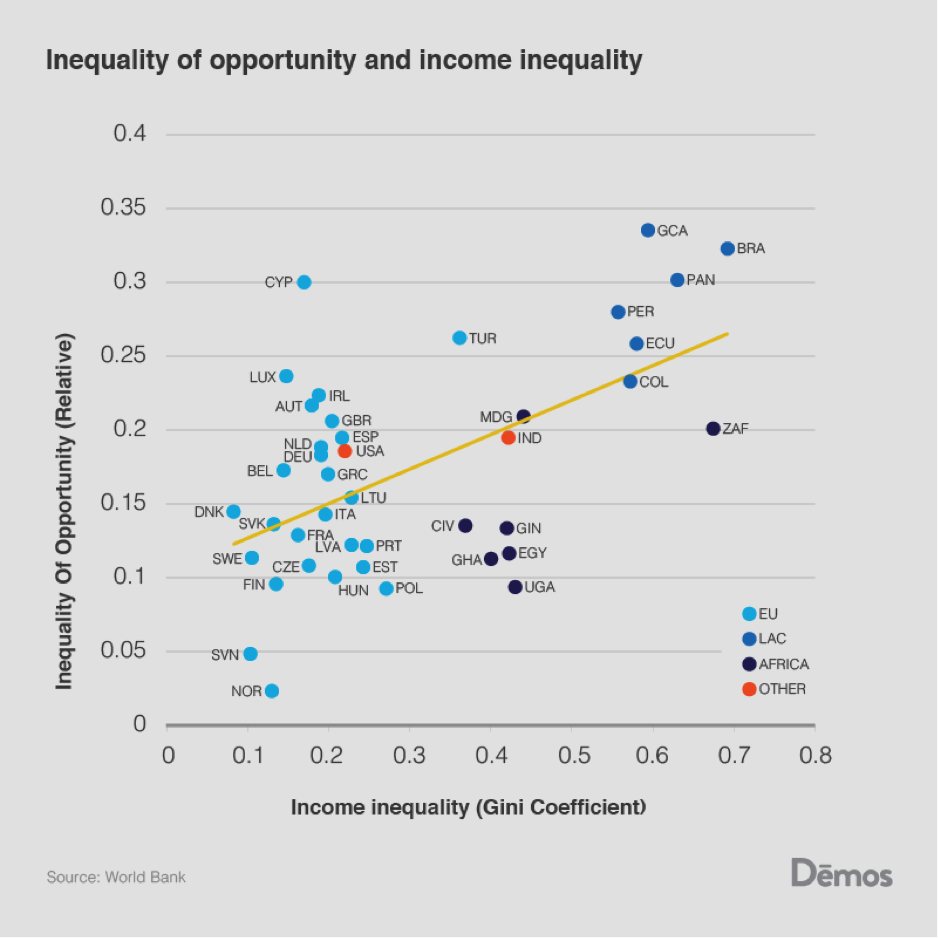
A large literature shows that inequality also reduces upward mobility. In both international comparisons and within the U.S., higher levels of inequality have been tied to lower levels of mobility. Within the U.S., mobility varies widely by census tract, with the lowest levels of mobility in the south. Raj Chetty, Nathaniel Hendren, Patrick Kline and Emmanuel Saez find that within the United States, “areas with more inequality as measured by Gini coefficients have less mobility.” Internationally, countries with higher levels of inequality have lower levels of upward mobility. Miles Corak finds, “the United States stands out as being among the least generationally mobile among the rich countries, and in particular the overall degree of relative earnings mobility across the generations is almost three times greater in Canada, a country to which it might be most apt to make a comparison.” His curve, below, shows that countries with higher levels of inequality have lower levels of upward mobility. Alan Krueger dubbed Corak’s chart the “Great Gatsby Curve,” saying, “The fortunes of one’s parents seem to matter increasingly in American society.”
A 2013 World Bank study examining an even larger sample of countries and using a slightly different metric of opportunity finds that “countries with a higher degree of income inequality are also characterized by greater inequality of opportunity.”
C. Inheriting Opportunity
Inequality hinders mobility in numerous ways. As Alan Kreuger notes,
Children of wealthy parents already have much more access to opportunities to succeed than children of poor families, and this is likely to be increasingly the case in the future unless we take steps to ensure that all children have access to quality education, health care, a safe environment and other opportunities that are necessary to have a fair shot at economic success.
There are myriad reasons why inequality reduces upward mobility. As inequality increases, the cost of falling behind becomes higher, leading parents to invest heavily in their children and possibly discourage public investment in other children through the public education system. Higher income families spend far more money on enrichment (such as tutors, camps or private schools) for their children than can parents with fewer resources. As inequality has increased in the United States, parents have spent an increasingly large share of their income on solidifying wealth.
Parents can also provide children with starter jobs, help pay off debts or support their children during an internship or low-paid starting position. Martha Stinson and Christopher Wignall find that children in higher income deciles are far more likely to be employed by the same company that employs their father. Nicolas Pistolesi finds that inequality of opportunity explains between 20 and 43 percent of earnings inequality in the United States. In America, income distribution data show that it is now better to be born rich and not get a college degree than to be born poor and get one. Additional evidence against the reality of meritocracy is provided by a study by Richard Reeves and Kimberly Howard finding that, “a sizable proportion (43 percent) of those who remain in a higher-income household are of modest skill, and would be expected on the basis of skill to fall.”
IV. Megatrends: How America Became So Unequal
The following sections lay out five megatrends contributing to inequality’s rise: racial inequality, financialization, the loss of collective bargaining, underinvestment, and perhaps the most far-reaching factor: political inequality.
A. Increasing U.S. Diversity Without a Commitment to Equity
A major societal trend with implications for economic policy has been the rapid demographic change over the past four decades. After the Immigration Act of 1965 removed race-restrictive entry quotas, the share of immigrants from non-European countries climbed. The white population was 83 percent in 1970 and 76 percent in 1990; it now stands at 64 percent. By 2043, whites will no longer be a majority in the U.S. Already, 46.6 percent of Americans under the age of 24 are not white.
The country has only grown more diverse since the end of the Civil Rights Movement. American society has been experiencing rapid demographic change with only intermittent leadership attention to the challenges of coalescing a sense of common national purpose and identity out of a people with roots from every nation on the planet. While our discourse has recently embraced the idea that society can be color-blind, the facts belie the notion. In a 2011 Associated Press survey, 51 percent of all Americans expressed explicit anti-black attitudes, and 52 percent of non-Hispanic whites expressed explicit anti‑Hispanic attitudes. The incidence of unconscious prejudice, which can affect decision-making in ways that are hard to detect by the actors themselves, much less those who would enforce anti‑discrimination laws in the courts, are even higher. For example, Harvard University’s Implicit Association Test found that 88 percent of white people had a pro-white or anti-black implicit bias, and more than two-thirds of non-Arab, non-Muslim respondents displayed implicit biases against Arab Muslims.
These implicit and explicit prejudices have real economic consequences for our diverse population. Approximately 3.7 million fair housing violations occur annually against African Americans, Latinos, Native Americans, and Asian Pacific Islanders as they seek to rent and purchase housing—yet HUD processed only 2,123 complaints in 2008. In financial services, after decades of credit unavailability due to private and government redlining, the 1990s and 2000s saw communities of color experience a wealth‑stripping phenomenon known as reverse redlining. Lenders and brokers targeted segregated neighborhoods with under-regulated financial products, particularly mortgages with features such as exploding adjustable rates, deceptive teaser rates, and balloon payments. Households of color were more than three times as likely as white households to end up with riskier loans. Federal policymakers and regulators declined to protect these communities for years as foreclosures rose, even acting to pre-empt state anti-predatory lending efforts in the 2000s. The resulting loss of wealth—66 percent average loss for Latino households, 53 percent for African Americans compared to just 16 percent for white households—stands as a grave and lasting blight on the future of our diverse middle class. For every dollar in assets that the typical white family owns, the typical Latino family has just 12 cents, and the typical African American family has only ten cents. African Americans are twice as likely as whites to have zero or negative net worth.
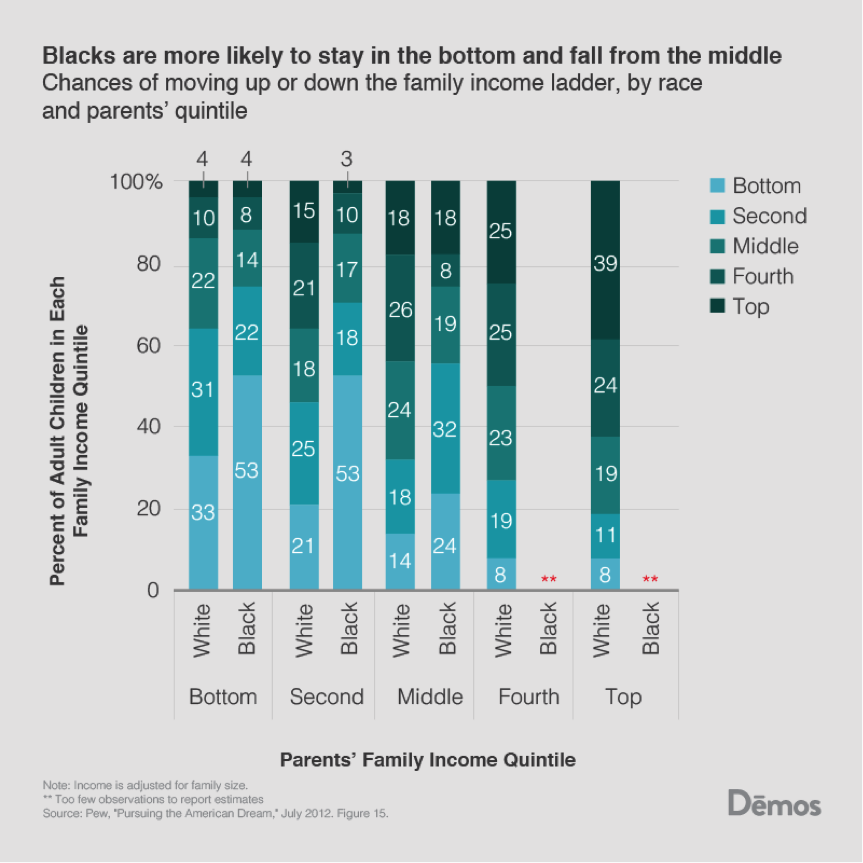
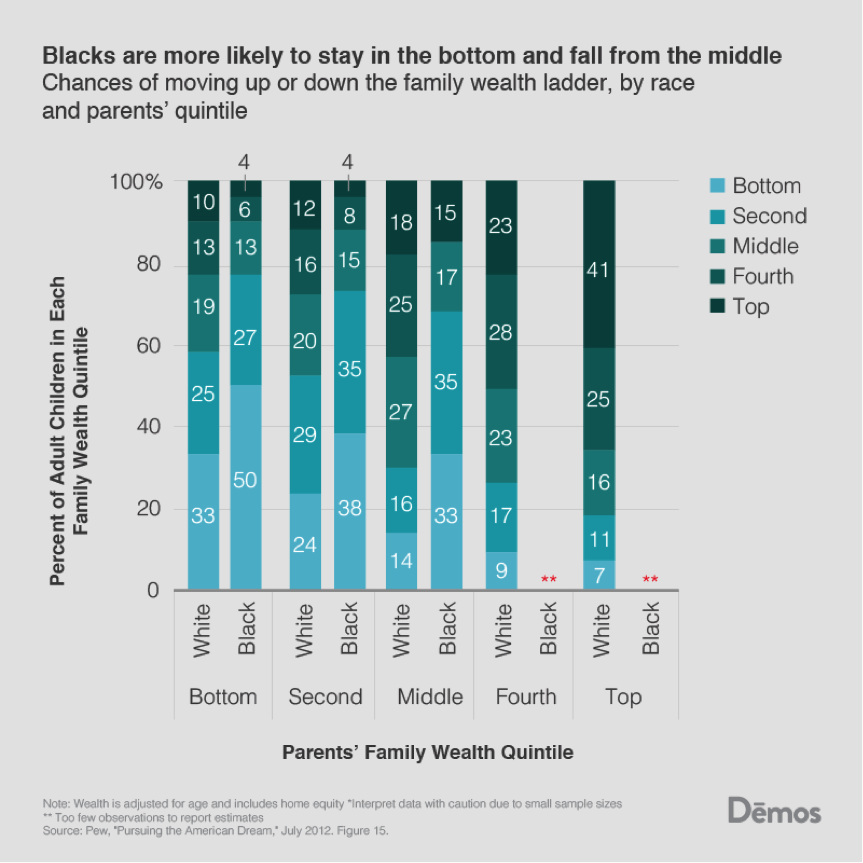
A recent study by Chetty, Raj, Nathaniel Hendren, Patrick Kline, and Emmanuel Saez find that, “income mobility is significantly lower in areas with large African-American populations.” They find that racial segregation predicts lower levels of upward mobility. In a recent study, Bhashkar Mazumber finds that for children born between the late 1950s and early 1980s, 50 percent of black children born into the bottom 20 percent of the income scale remained in the same position while only 26 percent of white children born into the bottom 20 percent of the income scale remained in the same position. This finding is confirmed by a recent Pew study finding that blacks had lower levels of upward mobility of both income and wealth. They also had higher levels of downward mobility.
Education in the United States is increasingly segregated by race. A 2014 study from the Civil Rights Project at UCLA finds that in 2011, only 23 percent of black students in the south attended majority white schools, down from a peak of 44 percent. Although there was progress in the late 1970s and ‘80s after lower courts began enforcing the desegregation holding of Brown v. Board of Education, this progress has stalled in recent years (although not been completely erased). Much of this slowdown in progress can be attributed to the courts removing oversight. A recent study finds that,
Over 200 medium-sized and large districts were released from desegregation court orders from 1991 to 2009. We find that racial school segregation in these districts increased gradually following release from court order, relative to the trends in segregation in districts remaining under court order. These increases are more pronounced in the South, in elementary grades, and in districts where pre-release school segregation levels were low.
The benefits of integration are well established. A seminal study by Rucker C. Johnson finds that desegregation “increased both educational and occupational attainments, college quality and adult earnings, reduced the probability of incarceration, and improved adult health status” for African American students. Importantly, Johnson finds that the benefits primarily come from black students having access to the increased per pupil spending and smaller classrooms that white students enjoy. This is supported by previous studies on the subject, which link higher school spending to future student earnings. The impact on earnings is particularly impressive; Johnson finds that five years in a court-desegregated school leads to a 15 percent increase in wages, an 11 percent decrease in the incidence of poverty and a $5,900 boost in annual family income. For white students, Genevieve Siegel-Hawley finds that diversity does not reduce educational outcomes for white students, but reduces intergroup prejudice and prepares students for a diverse workforce.
A recent Department of Education report finds a large salary disparity for teachers with high proportions of students of color: “Nearly one in four districts with two or more high schools reports a teacher salary gap of more than $5,000 between high schools with the highest and the lowest black and Latino student enrollments.” Another study finds “schools with 90 percent or more students of color spend a full $733 less per student per year than schools with 90 percent or more white students.” These inequities are replicated at the college level. A recent report by Anthony Carnevale and Jeff Strohl find that college education in America consists of “a dual system of racially separate and unequal institutions despite the growing access of minorities to the postsecondary system.” They find that students of color are less likely to end up in the most selective schools than white students with the same qualifications.
Finally, numerous studies have shown that job discrimination plays a role in the higher incidence of unemployment among non-whites (while the seasonally-adjusted unemployment rate for whites is 5.3 percent, it is 11.4 percent for blacks and 7.8 percent for Hispanics). As just one striking example of this literature, a 2005 Princeton University study revealed that employers were more likely to offer a callback to white job applicants with criminal records than to well-qualified African American job-seekers with no criminal history whatsoever.
B. The Rules of Globalization
The way that policymakers have chosen to structure the rules of globalization has contributed significantly to increased inequality over the past three decades. Our trade policies have been written and enforced in ways that advantage multi-national firms seeking lower-cost labor, directly resulting in fewer and lower-paying jobs for the American middle class. Increasingly, white-collar jobs are also moving overseas as China, India, and other nations field more educated workers who can do the jobs now done by U.S. scientists, accountants, lawyers, and doctors. As a historic champion of a more open global economy, the United States has often failed to take a hard look at how this system puts U.S. living standards at risk and develop policies to balance the prerogatives of multi-national corporations and the American middle class. Worse, the U.S. has often done little as other countries, like China and Japan, have played by a different set of trading rules that put the U.S. at a disadvantage. And we have repeatedly been silent in the face of abuses of worker rights, even when these abuses are perpetrated by close trading partners who are bound by Free Trade Agreements to uphold basic labor standards.
Over the past few decades, increased trade with low-wage countries has been responsible for fully a third of the depression in wages of non-bachelors degree holders relative to degree-holders since 1979; tracking just since 1995 (one year after the North American Free Trade Agreement came into force), low-wage country trade accounts for over 90 percent of the wage depression.
The downward pressure on wages affects not just workers who are directly competing with foreign production workers. When multi-national firms layoff American manufacturing workers in favor of less expensive employees in our trading partner countries, these laid-off workers compete for lower-paying jobs in non-offshorable sectors, such as landscaping or food service. Thus the effect of our trade policy ripples throughout the working and middle class, beyond just those directly affected by plant closings.
The broader economic dynamic of high corporate profits amidst weak job growth and declining wages for most Americans is in large part a result of our global trade policies. The North American Free Trade Agreement turned a slight trade surplus with Mexico into the current almost $100 billion deficit, which has cost nearly 682,900 jobs. The permanent normalization of trade relations with China has cost over two million American manufacturing jobs between 2001 and 2011. Two recent studies suggest that globalization has been a major driver of inequality. David H. Autor, David Dorn and Gordon H. Hanson find that “labor markets whose initial industry composition exposes them to rising Chinese import competition experience significant falls in employment, particularly in manufacturing and among non-college workers.” Mike Elsby, Bart Hobijn and Aysegul Sahin find that, “offshoring of the labor-intensive component of the U.S. supply chain as a leading potential explanation of the decline in the U.S. labor share [of national income] over the past 25 years.”
C. The Financialization of the Economy
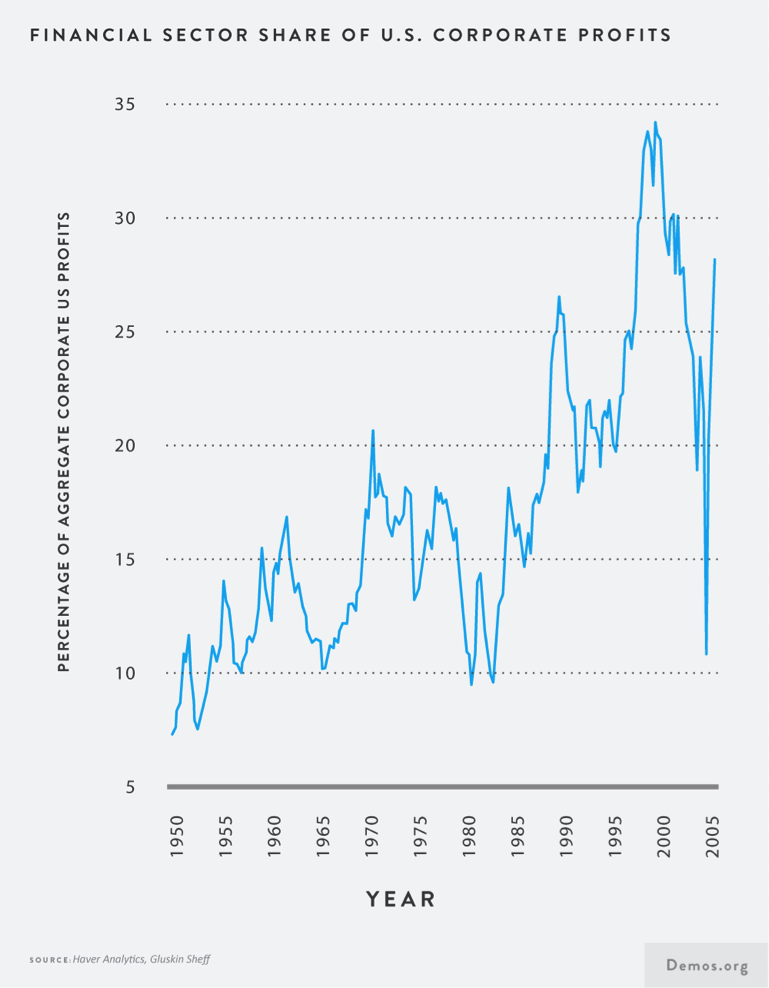
Another, less often-cited megatrend driving inequality has been the financialization of the American economy. The deregulatory movement that transformed consumer finance also revolutionized commercial and investment banking and trading in ways that have dramatically increased finance’s share of the U.S. economy, from 3.8 percent to 8.2 percent of GDP. Financial sector profits have also increased as a share of total corporate profits, with the non-financial business sector transferring increasing income to the financial sector. Research from New York University’s Stern School of Business shows that, contrary to the claims that deregulation would lower costs, the cost of financial intermediation—the critical function of transferring capital from investors to productive uses in the economy—has actually increased since deregulation. This growth of the financial sector was not because of increased demand for financial services, which only grew by four percent in the last decade. The reason appears to be an enormous increase in the sheer volume of trading.
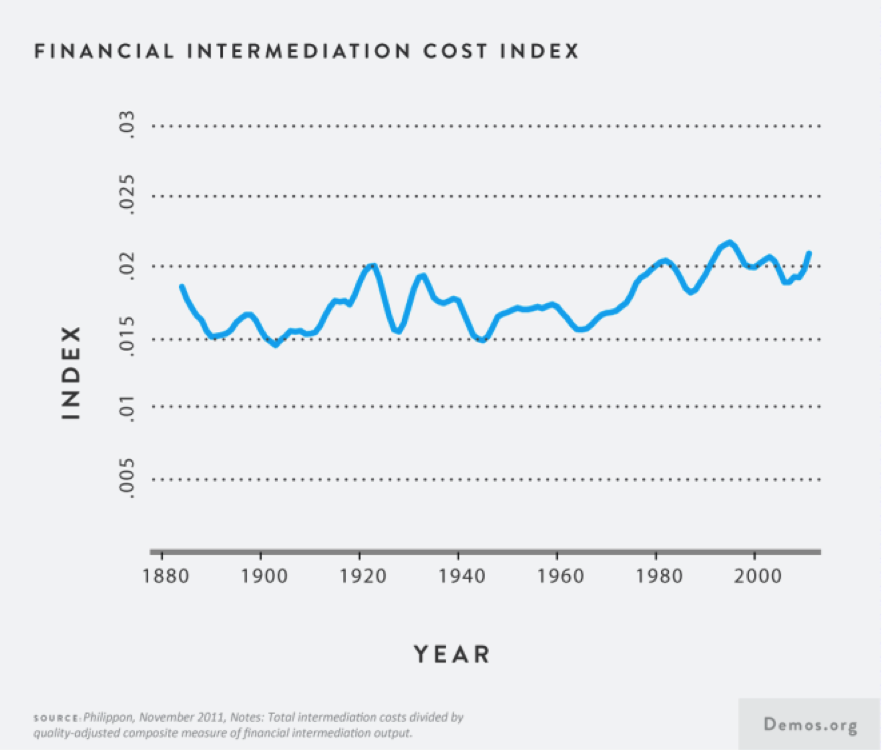
The relative growth of the financial sector is not necessarily a problem if the services provided by the sector add commensurate value to the overall economy. With the cost of intermediation rising despite technological advances that should be increasing efficiency—and with economic performance worsening, particularly as measured by the employment recovery time post-recessions—it is becoming apparent that value is being simply reallocated to the beneficial owners of financial firms. This drains resources that could be put to uses that would increase the productivity of the overall economy and create jobs and wealth. Demos Senior Fellow Wallace Turbeville estimates that the excessive wealth transfer to the financial sector is in the range of $635 billion per year. Numerous studies confirm that financialization mainly serves as a rent-extracting activity, rather than a wealth-creating one.
In fact, the growing financialization of the U.S. economy and its impact on publicly traded corporations has exacerbated inequality in a number of ways. A focus on “shareholder value” has trumped all other goals for the modern corporation since the 1980s—a shift that Wall Street helped usher in through a relentless search for profits that included leveraged buy-outs, mergers and acquisitions, and private equity deals, as well as a more aggressive quest for short-term trading gains. This narrow focus on the short-term bottom line has undermined American workers and the middle class by justifying any cost-cutting measures that can boost quarterly earnings, including layoffs, foreign outsourcing, eliminating benefits, and defeating union drives. Nearly all the forces typically blamed for rising inequality—globalization, new technologies, declining unionization—have had a more devastating impact on U.S. living standards thanks to Wall Street’s imperative to put stock price above all else. Two University of Massachusetts at Amherst economists find that financialization accounts for more than half of the decline in the share of national income accruing to labor. Other studies support this finding.
D. Increased Corporate Resistance to Employee Collective Bargaining
Organized labor has traditionally played a critical role in slowing the tide of rising inequality. Unions bargain collectively for better wages and benefits for their members. But unions also raise compensation for workers they do not represent: a recent study by Bruce Western and Jake Rosenfeld finds that unions substantially boost compensation for non-union employees in addition to their own members by influencing non-union employers to raise wages in order to avoid unionization; by promoting norms of fair pay, and by lobbying for public policies that raise wages. David Jacobs finds that, “the role that union decline has played in growing income inequality may actually be larger than many of the favorite explanations offered by economists, such as the education gap in the United States.” In short, high unionization boosts the share of economic growth going to working people rather than to corporate profits or the very highest earners.
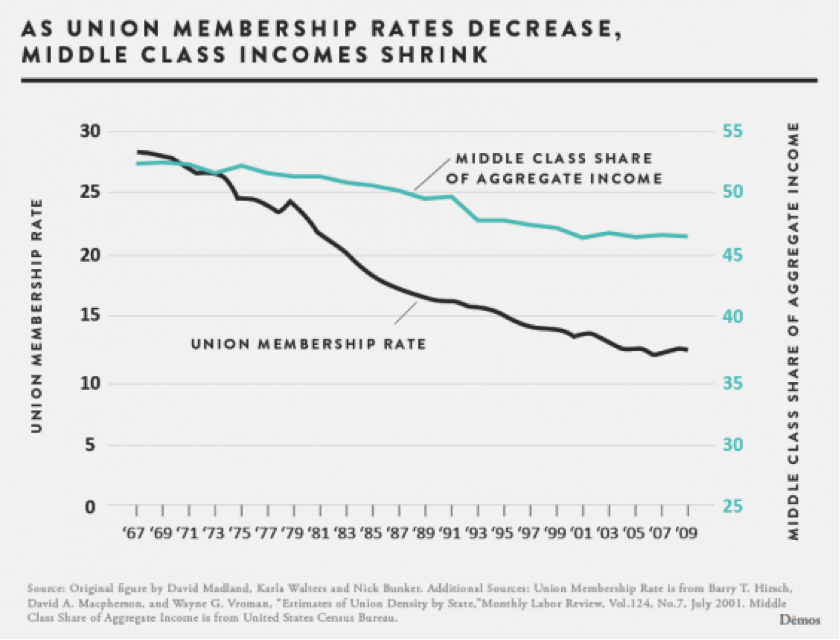
However, the percentage of Americans belonging to unions has declined steadily, falling by 44 percent between 1983 and 2012, so that today, just 6.6 percent of private sector workers belong to unions. Western and Rosenfeld estimate that the decline of unionization has contributed as much as third to the growth of income inequality among working men since 1973.
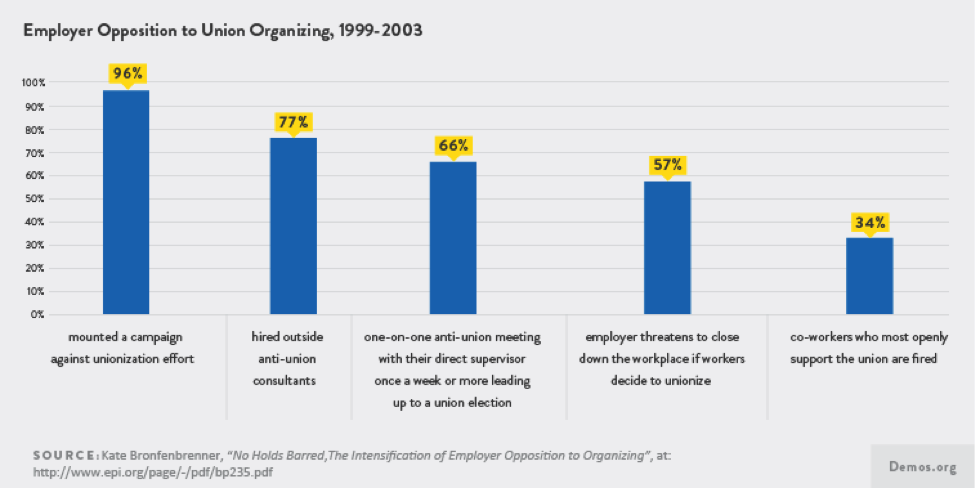
Union decline can be attributed to the growth of corporate opposition to unionization and the weakening of laws intended to protect employees’ right to organize. Today, the system meant to defend the rights of employees to form unions barely functions. Weak and slow-moving enforcement of labor rights allows employers to routinely violate the law by threatening and harassing employees who attempt to organize. An analysis of union elections from 1999 to 2003 revealed that when workers attempted to organize a union, 96 percent of employers mounted a campaign against their effort. Three quarters of employers hired outside anti-union consultants. So while workers might wish to join unions, they often fail to persist in the effort after an intimidating one-on-one anti-union meeting with their direct supervisor once a week or more leading up to a union election (a tactic employers used in 66 percent of organizing campaigns), after their boss threatens to close down the workplace if workers decide to unionize (57 percent of organizing campaigns), or after those co-workers who most openly support the union are fired (34 percent of organizing campaigns).
E. Underinvestment in Infrastructure
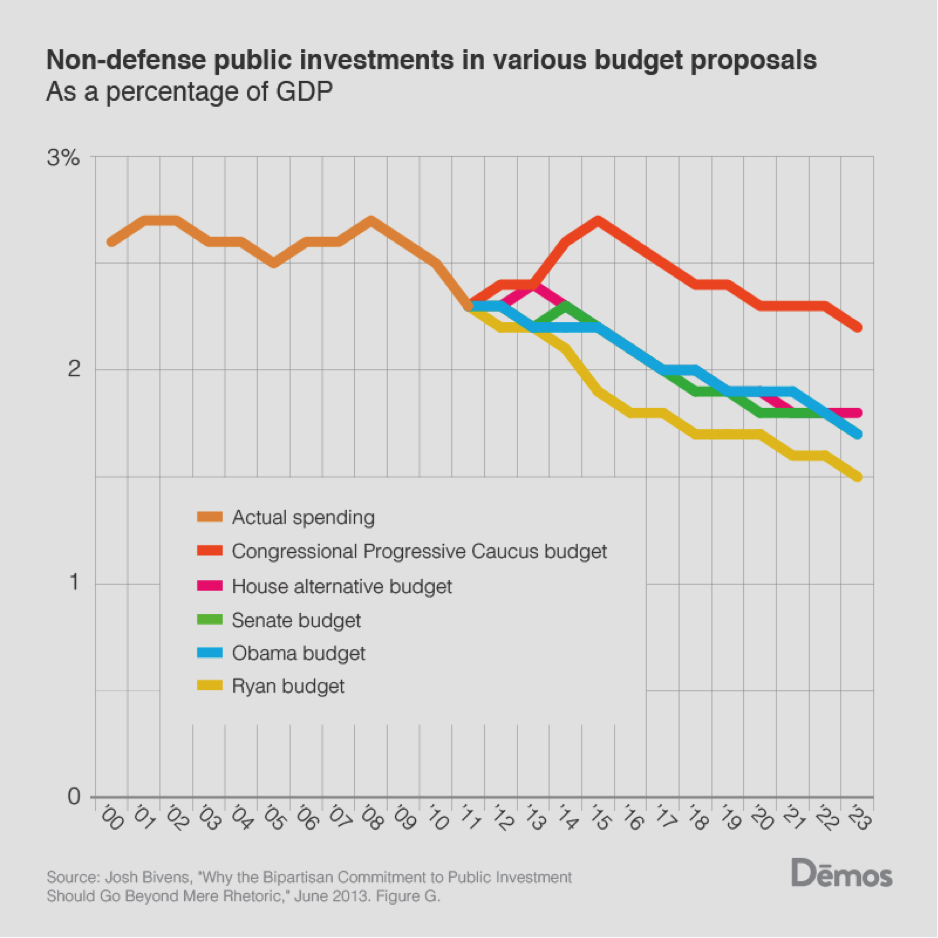
As financialization has sapped resources from the real economy the government has pursued austerity policies that have further reduced national investment. Infrastructure spending has plummeted to levels not seen since World War II and is set to fall even further. Because the poor and middle class rely more on public goods, they suffer the most from our increasingly inadequate infrastructure.
Public investment is crucial to future growth. The economic boom in the 1950s and 60s relied on government investments in education (for example, the G.I. Bill), infrastructure (for example, the National Highway System) and science (NASA, for example). Now, education spending is declining at the state level, infrastructure across the nation is crumbling and scientific researchers worry about the fate of their projects.
Investments in science produce huge benefits, both in terms of well-being and economic growth. The Human Genome Project, for instance, cost $3.8 billion in public funding and has produced economic gains of $796 billion (that’s a return of $140 to $1). The Internet, too, was a product of government research and has produced trillions in increased economic output and growth.
Our infrastructure is aging, and the American Society of Civil Engineers estimates that we will need to invest around $3.6 trillion by 2020 to move from a grade of D + to a B. Numerous studies find that infrastructure investment brings about large economic returns.
Public investment spending provides immediate stimulus and productivity growth in the future. A major Demos/Century Foundation/Economic Policy Institute fiscal analysis, Investing in America’s Economy: A Blueprint for Economic Recovery and Fiscal Responsibility, estimates that if the U.S. had begun investing about $250 billion a year into infrastructure in 2011, GDP growth each year would be one percentage points higher in 2021 and five percentage points higher by 2025. By 2045, nominal GDP would be by 11.6 percent higher than baseline projections.
V. Inequality Undermines Democracy
We have reviewed the data showing that inequality has detrimental effects on our society and how intentional policy shifts, not inevitable contingencies, are primarily responsible. Meanwhile, evidence abounds that the U.S. political system is increasingly dominated by wealthy interests, and strong, bi-partisan majorities of the public believe the deck is stacked against ordinary voters. What is less understood, however, is the interplay between these two problems and how a growing chasm of income and wealth translates into diminished opportunities for most Americans.
As Demos outlines in our foundational report, Stacked Deck: How the Dominance of Politics by the Affluent and Business Undermines Economic Mobility in America, this tilting of political life toward those the well-connected and already-wealthy has served to undermine economic mobility as a whole. As private interests have come to wield more influence over public policy, with ever larger sums of money shaping elections and the policymaking process, our political system has become less responsive to those looking for a shot to improve their lives and move upward. This is in part because wealthy interests are keenly focused on concerns not shared by the rest of the American public and often oppose policies that would foster upward mobility among lower-income citizens, such as raising the minimum wage.
A. Different Incomes, Different Priorities
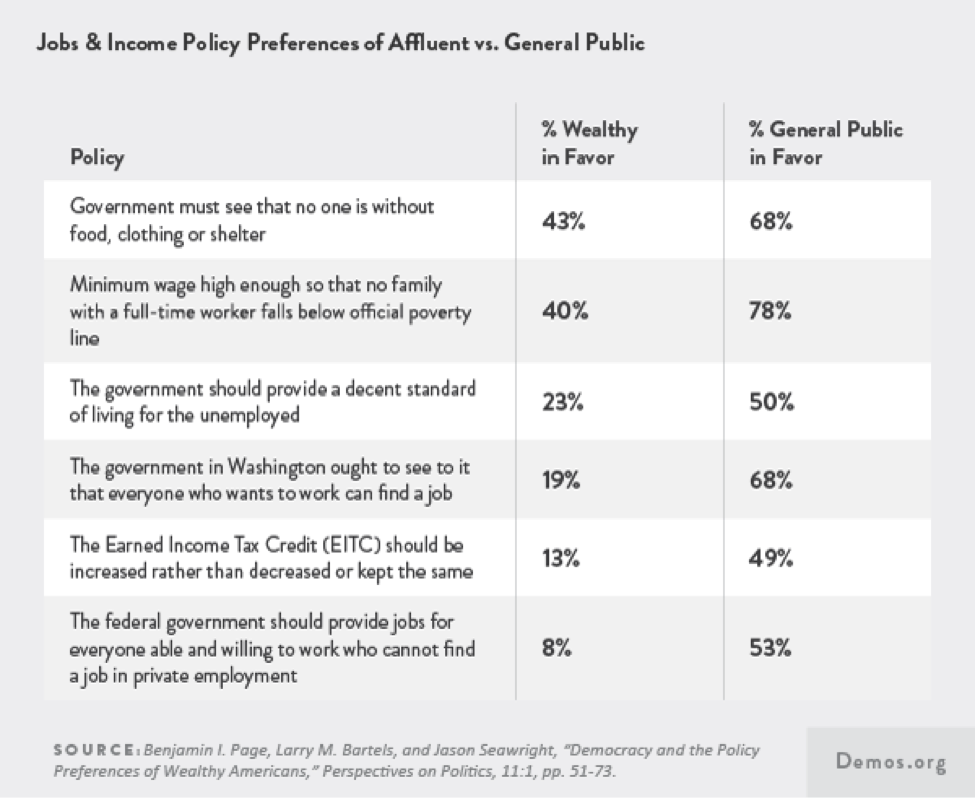
Significant differences between the wealthy and the general public exist in such areas as tax and budget, trade and globalization, regulation of business, labor, the social safety net, and the overall role of government. The general public is more open than the wealthy to a variety of policies designed to reduce inequality and strengthen economic opportunity, including: raising the minimum wage, increasing the Earned Income Tax Credit, providing generous unemployment benefits, and directly creating jobs. For example, as the table below reports, only 40 percent of the wealthy think the minimum wage should be high enough to prevent full-time workers from being in poverty, while 78 percent of the general public holds this view. Affluent voters are also less supportive of labor unions and less likely to support laws that make it easier for workers to join unions—even as research shows that unions are crucial to reducing inequality. Governors elected with strong support from affluent voters and business groups have prioritized tax cuts over funding for primary and secondary public education.
B. Unequal Political Voice
These differences in policy preference by class create distortions in our policymaking precisely because the affluent are over-represented among both donors and voters (not to mention lobbyists, media influencers and other categories with outsized influence in our political system). Working and middle‑class citizens are more susceptible to the disenfranchising effects of our needlessly bureaucratic system of voter registration, a system which leads to 51 million eligible Americans being unregistered to vote.
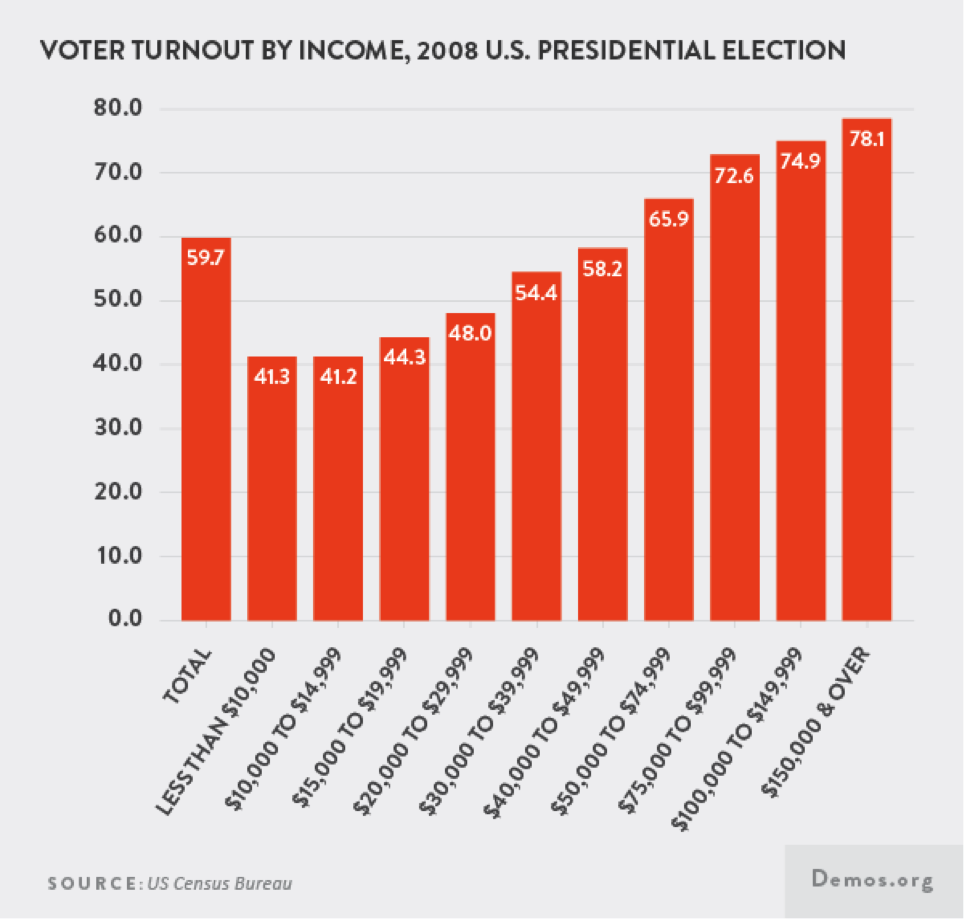
There is a large literature on the how low voter turnout influences policy outcomes. A recent study by William Franko, Nathan J. Kelly and Christopher Witko finds, “that where the poor exercise their voice more in the voting booth relative to higher income groups, inequality is lower.” Policies to increase low-income voter registration— whether through new laws, such as federal Same Day Registration, or through basic enforcement of existing laws such as the National Voter Registration Act—would help increase their voice in the political process. In a different study, Franko examined three policies: minimum wages, anti-predatory lending laws and SCHIP (State Children's Health Insurance Program). Franko compared the adoption of these policies to voter participation rates across incomes and found that states with higher levels of inequality in turnout were less likely to pass legislation beneficial to the poor. Kim Hill and Jan Leighley find that higher class bias in voter turnout reduces social spending. Another study finds, “an enduring relationship between the degree of mobilization of lower-class voters and the generosity of welfare benefits.” These results are predictable: studies show that legislators respond more to voters than to non-voters. A recent study finds that states with recent increases in turnout among voters of color were the most likely to have voter suppression laws proposed. Research shows that these laws bias the electorate towards more upper-class turnout. These findings indicate that voter ID laws are used strategically to reduce the turnout of low-income voters and voters of color.
Non-wealthy Americans are even less likely to contribute to political campaigns. Just 0.07 percent of the U.S. population made campaign donations of $2,500 or more in 2012, yet this group contributed a total of $1.4 billion to both presidential candidates. In contrast, the total of contributions from a much larger pool of donors contributing between $200 and $2,500 was just $485.7 million. The donor pool does not reflect the electorate’s diversity. Over 90 percent of donations in the 2012 election came from majority white neighborhoods while only four, three and less than one percent came from Latino, African‑American and Asian neighborhoods respectively. Money buys access, and recent studies indicate that donors are far more likely to secure a meeting with a congressmember. Access, in fact, is the main motivation of most political spending. This unequal political voice distorts elected officials’ representation of citizens’ actual policy views, given how many non-affluent Americans favor policies to create new pathways to the middle class.
For example, despite the important role a strong minimum wage plays in economic mobility, Congress has allowed the wage to decline steadily in real terms over the past four decades. (Meanwhile, it has repeatedly lowered capital gains tax rates to benefit the wealthy, despite majority opposition to preferential treatment of wealth income over work income). Even with the series of minimum wage increases, adjusting for inflation shows that the real value of the federal minimum wage fell roughly 30 percent since 1968. If the minimum wage increased at the same rate as inflation, it would be equal to $10.69 per hour, far above the current $7.25.
This slide in the minimum wage should be no surprise when one takes a close look at the data on lobbying expenditures. The data suggests that low-wage workers have very few paid advocates in the corridors of Washington. Labor unions often speak up for these Americans, but otherwise, lobbying by groups that explicitly advocate for low-wage workers or non-elderly low-income people is so small that it doesn’t even merit its own category in records compiled by the Center for Responsive Politics. This lobbying imbalance exacerbates the problem of elected officials being accountable to wealthy campaign contributors by ensuring that once in office, these officials are exposed to a constant flow of information supporting the donor class’ views and positions.
The most important study in this area is by the political scientist Martin Gilens, Affluence and Influence: Economic Inequality and Political Power in America. By comparing the policy preferences of different income groups with actual policy outcomes, he was able to determine how much influence different groups have had over policy. In a recent update to his original study, Gilens writes with Benjamin Page, “Not only do ordinary citizens not have uniquely substantial power over policy decisions; they have little or no independent influence on policy at all...By contrast, economic elites are estimated to have a quite substantial, highly significant, independent impact on policy.” Their data suggests that the wealthy have 15 times the influence of the middle class. Larry Bartels, using data from the International Social Survey Programme (ISSP) finds that,
In the other affluent democracies, net support for spending cuts was virtually constant across income groups, from the very poor to the very affluent. In the United States, however, poor people were only slightly more likely to favor than to oppose spending cuts, while affluent people were vastly more likely to favor spending cuts. No other rich country even came close to matching this level of class polarization in budget-cutting preferences.
Gilens shows that, in many cases, public policy outcomes would have been quite different if Congress and the president had been equally responsive to all income groups.
VI. Policy Recommendations
A. Strengthen Upward Mobility
Reversing the trend towards greater inequality in America and shoring up a middle class that fully reflects America’s diversity will require policies that:
- Invest in human capital and education. Investing in education and human development, ensuring that future generations are well cared for and well educated, and that working people have the time they need to be caregivers to the people they love is a key starting point for moving millions of Americans into the middle class. For example, employees who need flexibility in their work lives to care for a child or other family member often face economic hardship. A system of family leave insurance—like the successful model in California—would help insure that the birth of a child no longer leads to poverty. The Schedules That Work Act would give workers the right to request a “flexible, predictable or stable” work schedule without retaliation. The bill stipulates that employers must detail upon employment the number of hours an employee can expect to work each week, and be given two-week notice before any scheduling change. Investing in affordable, high-quality child care and early education would reduce educational gaps and set the groundwork for success long after school. Finally, the nation’s financial aid system should be revamped to ensure that every college‑qualified student has access to higher education without taking on ruinous debt.
- Increase employees’ power in the workplace. Since the 1970s, a growing share of national income has gone to corporate profits while the proportion going to labor compensation has decreased. This shift has greatly accelerated in the last decade. To reverse the trend, employees need more power in the workplace. The bottom of the labor market should be bolstered by raising the minimum wage, guaranteeing paid sick days to working people, and ensuring that worker protections are effective and apply to everyone. At the same time, weakened labor laws should be reconstituted so that Americans can exercise their right to organize unions and negotiate for pay and benefits that will allow them to enter the middle class. Finally, the U.S. should create a short-term public jobs program and long-term public investment plan to promote full employment.
- Use tax policy to strengthen and expand the middle class. Too often, the nation’s tax policy bolsters the already wealthy rather than supporting Americans trying to work their way into the middle class. A more progressive tax system could increase economic mobility and reduce inequality. The Earned Income Tax Credit and the Child Tax Credit, which benefit low-income workers and their families, should be expanded. To ensure that the home mortgage tax credit helps middle-class families rather than subsidizing the super-wealthy, its value should be capped. Meanwhile, taxes on capital gains and dividends—income which disproportionately flows to the wealthiest Americans—should be increased, and corporate tax loopholes should be eliminated. To reduce the transfer of tremendous wealth from one generation to the next, estate taxes should be increased.
- Enable Americans to build assets. Owning assets—from a retirement account, to a home, to an emergency savings fund—is crucial to middle-class security. Yet American families have lost trillions of dollars in home equity as a result of the housing crash, and one in three say that if they lost their jobs, they could not make housing payments for more than a month. To help distressed homeowners, a new public agency should be established to acquire and refinance under-water mortgages. To increase retirement security, Social Security should be safeguarded and supplemented with a system of voluntary annuitized pensions that guarantee a minimum rate of return. And to ensure that the predatory lending that drains pocketbooks is halted, federal usury limits should be established for all forms of lending and bankruptcy laws should be rewritten to provide greater relief to student borrowers and homeowners. To prevent debt from becoming a vicious cycle that shuts qualified job seekers out of employment, The Equal Employment for All Act, banning employment credit checks should also be enacted.
B. Limit the Economic Policy-Distorting Influence of Money in Politics
To achieve and preserve these reforms, we must also limit the influence of money in politics. One critical way to reduce the disproportionate influence of the wealthy on public policy is to create a system for financing election campaigns that lives up to the idea of one-person, one-vote by leveling the playing field between rich and poor and giving every American a strong voice. Such a system requires several key reforms:
- Amend the U.S. Constitution to restore the ability of the people to enact common-sense, content‑neutral restrictions on political contributions and spending to promote political equality. Congress should propose an amendment or package of amendments to the U.S. Constitution to clarify that the First Amendment was never intended as a tool for use by corporations and the wealthy to dominate the political arena.
- Enact strict limits on the amount that wealthy individuals and interests can contribute and spend on U.S. politics. Millionaires, billionaires, and large corporations have no inherent right to drown out the voices of the rest of the population. After amending the Constitution or educating the next generation of Justices, Congress and states should sharply limit contributions and spending to level the playing field for all Americans.
- Match small contributions with public resources to empower small donors and help grassroots candidates run viable campaigns. Under a system of public financing (proposed in the House Government by the People Act or the Senate Fair Elections Now Act), candidates for Congress would be able to successfully run campaigns without relying on large donations. Low-dollar contributions would be matched with public funds. These measures would amplify the voices of non-wealthy citizens, encourage average Americans to participate in campaigns, change candidate incentives, and enable aspiring public servants without access to big-money networks to run viable campaigns for federal office.
- Encourage small political contributions by providing vouchers or tax credits. Encouraging millions of average-earning Americans to make small contributions can help counterbalance the influence of the wealthy few. Several states provide refunds or tax credits for small political contributions, and the federal tax code did the same between 1972 and 1986. Past experience suggests that a well-designed program can motivate more small donors to participate. An ideal program would provide vouchers to citizens up front, eliminating disposable income as a factor in political giving.
- Require greater transparency around political spending. Congress should close existing loopholes in disclosure laws so that all money spent to influence U.S. elections (above a reasonable threshold) can be traced back to its original source. Allowing citizens to “follow the money” would help voters make informed choices and prevent wealthy interests from sponsoring nasty or misleading adds while insulated from public accountability.
- Strengthen rules governing lobbying to reduce the influence of well-heeled special interests. Congress should strengthen disclosure around lobbying and implement stronger revolving door limits that prevent former elected officials from approaching former colleagues for several years.
C. Address Class Gaps in Voting by Expanding the Freedom to Vote
A legitimate government “of the people, by the people, and for the people” must vigorously promote and protect the freedom to vote so that all eligible persons can participate in self-government. But today, too many bureaucratic barriers still block the ability of millions of eligible persons to register and vote, and too many politicians are actively seeking to shrink the electorate with unnecessary and discriminatory restrictions on political participation. Reversing this trend entails:
- Removing barriers to registration and voting. Voter registration is a particularly important target for reform, given that almost one of four eligible Americans was not registered to vote in the period leading up to the 2012 elections. In particular, the following should be adopted:
- Same-Day Registration: Implementing Same Day Voter Registration, which allows eligible individuals to register and vote at the same time, is a proven method to increase participation and turnout among eligible voters. States with Same Day Registration record consistently higher voter turnout and participation than states without it. Same Day Registration has also been shown to reduce class gaps in turnout.
- Expand agency registration and automate the registration process: States should modernize the voter registration system to remove administrative burdens and costs by taking the initiative to place eligible voters on the registration rolls rather than leaving the burden on individual citizens to navigate the voter registration process. Motor Voter has also been linked to reductions in turnout inequality.
- Make registration permanent and portable: Almost 36.5 million U.S. residents moved between 2011 and 2012. Low-income individuals are twice as likely to move as those above the poverty line. Voter registration should become portable and permanent for persons who move within a state, by automatically updating registration records as citizens change their addresses.
- Protections against intimidation and wrongful challenges: States should put measures in place to protect voters from intimidation tactics, including clear rules and procedures to protect voters from improper removal from voting rolls, intimidating behavior at polls, and deceptive practices that discourage voting.