Introduction
Issues of racial inequity are increasingly at the forefront of America’s public debate. In addition to urgent concerns about racial bias in law enforcement and the criminal justice system, activists highlight deeply connected issues of economic exclusion and inequality. No metric more powerfully captures the persistence and growth of economic inequality along racial and ethnic lines than the racial wealth gap. According to data from the Survey of Consumer Finances, the median white household possessed $13 in net wealth for every dollar held by the median black household in 2013. That same year, median white households possessed $10 for each dollar held by the median Latino/a household.
Research probing the causes of the racial wealth gap has traced its origins to historic injustices, from slavery to segregation to redlining. The great expansion of wealth in the years after World War II was fueled by public policies such as the GI Bill, which mostly helped white veterans attend college and purchase homes with guaranteed mortgages, building the foundations of an American middle class that largely excluded people of color. The outcomes of past injustice are carried forward as wealth is handed down across generations and are reinforced by ostensibly “color-blind” practices and policies in effect today. Yet many popular explanations for racial economic inequality overlook these deep roots, asserting that wealth disparities must be solely the result of individual life choices and personal achievements. The misconception that personal responsibility accounts for the racial wealth gap is an obstacle to the policies that could effectively address racial disparities.
This paper explores a number of these popular explanations for the racial wealth gap, looking at individual differences in education, family structure, full- or part-time employment, and consumption habits. In each case, we find that individual choices are not sufficient to erase a century of accumulated wealth: structural racism trumps personal responsibility. Drawing on data from the 2013 Survey of Consumer Finances, we find that white adults who don’t graduate high school, don’t get married before having children, and don’t work full time still have much greater wealth at the median than comparable black and Latino adults—and often have more wealth than black and Latino households that have married, completed more education, or work longer hours. Differences in consumption habits also cannot explain the wealth gap; we look at academic research finding that white households spend more than black households of comparable incomes, yet still have more wealth.
The racial wealth gap matters because of the central role wealth plays in enabling families to both handle current financial challenges and make investments in their future. Families that have accumulated some wealth are better equipped to manage unanticipated expenses like an emergency medical bill, or disruptions in household income such as a layoff, without falling into debt or poverty. Over the longer term, wealth can expand the prospects of the next generation, helping to pay for college, provide a down payment for a first home, or capitalize a new business. As long as a substantial racial wealth gap persists, white households will continue to enjoy greater advantages than their black and Latino neighbors in meeting the financial challenges of everyday life and will be able to make greater investments in their children, passing economic advantages on. We can only create a more equitable future by confronting the racial wealth gap and the public policies that continue to fuel and exacerbate it.
Terminology
This report analyzes data on white, black, and Latino households. The terms black and white are used to refer to the representative respondents of a household who identified as non-Latino black or white in the Survey of Consumer Finances (SCF). Latinos include everyone who identified as Hispanic or Latino and may be of any race.
Throughout this report, we use the term “racial wealth gap” to refer to the absolute differences in wealth (assets minus debt) between the median black and white households as well as between the median Latino and white households. All dollar figures are in 2013 dollars.
Attending college does not close the racial wealth gap.
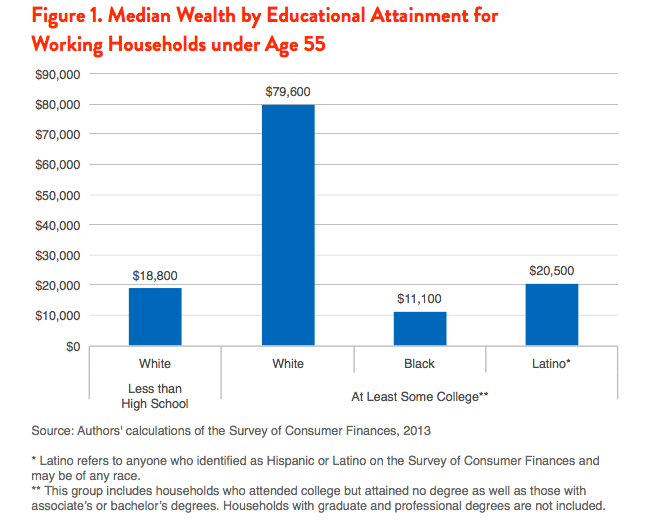
The median white adult who attended college has 7.2 times more wealth than the median black adult who attended college and 3.9 times more wealth than the median Latino adult who attended college.
Higher education is associated with greater household wealth for Americans of every race and ethnicity, yet going to college isn’t enough to overcome racial disparities in wealth. Among households under age 55, the median white high school dropout has similar wealth to the median black adult who graduated high school and attended at least some college, according to data from the Survey of Consumer Finances. Similarly, the median Latino adult who attended college has similar wealth to the median white high school dropout.
As Figure 1 shows, black adults with at least some college—a group that includes any amount of college education, from students who attended college but attained no degree, to those with associate’s or bachelor’s degrees—had $11,100 in wealth at the median, while Latino adults with at least some college had $20,500 in wealth at the median. These figures are dwarfed by the $79,600 in median wealth held by whites who attended at least some college.
In effect, to gain wealth comparable to white high school dropouts, black and Latino students must not only complete high school, but also attend college. Higher education is valuable—but when it comes to wealth, white privilege is equally, if not more valuable.
Attending college is associated with wealth in a number of ways. A college education has long been heralded as a ladder of social mobility: graduates who earn a bachelor’s degree or other college certification are more likely to be employed and generally have higher earning power than high school graduates or dropouts; they can use their higher incomes to build savings and wealth.
Indeed, research consistently finds that college graduates of every race and ethnicity have greater income and wealth than their counterparts who did not graduate college. Yet wealth also plays a role in determining who attends college in the first place, and how much debt students must take on to get a degree. In effect, education can generate a “wealth feedback loop,” as parents’ level of education and wealth significantly predicts the level of education their children will complete. Thus, the educational and wealth-building opportunities directly denied to people of color in past generations continue to reverberate in the lives of their children, even those whose educational achievements open up opportunities for well-paid employment opportunities.
Having left high school without a diploma and never pursued further education, white dropouts do not gain the wealth-building opportunities offered by a college education. Yet, advantages such as greater access to gifts and inheritances offer white households more opportunities to gain and build wealth, even when they have completed less education. Because white families accumulated more wealth over a history in which black and Latino families were excluded from many wealth-building opportunities through discriminatory policies in housing, banking, education and other areas, white families today have, in general, greater resources to pass on to their offspring. As a result, white families are 5 times more likely than black or Latino families to receive large gifts and inheritances, and the amounts they receive are far greater. An analysis of data from the Panel Study of Income Dynamics finds that white recipients collect $5,013 more than black families on average over a two-year period. Not only do these funds add up to a substantial amount over time, but they can also be used to jump-start further wealth accumulation, for example, by enabling white families to buy homes and begin acquiring equity earlier in their lives and to make larger down payments on a first home, reducing interest rates and lending costs.
For black and Latino households with at least some college education, the high cost of college is another reason why pursuing higher education—and even attaining a degree—is not more effective at reducing the racial wealth gap. Our earlier research finds that even if black and Latino students graduated college at the same rate as white students, the reduction in the racial wealth gap would be modest: cut by just 1 to 3 percent at the median. Because of the existing racial wealth gap, white college students disproportionately come from wealthier family backgrounds than black and Latino students. As a result, the research finds that black students borrow at much higher rates, and in higher amounts, to receive the same college degrees as their white counterparts. The higher rate of borrowing may in turn contribute to other disparities, including college dropout and completion rates. With less student loan debt to pay off over their working years, the typical white college graduate has a head start on building wealth compared to their black peers. The picture is different for Latino households, which attend and graduate from college at lower rates than both black and white households. Evidence suggests that Latino students may be more averse to taking on student loans even when they face substantial financial need for school.
The result is that whites with little formal education still benefit disproportionately from social networks that help them to attain jobs, and inheritances and gifts that help them to build wealth. Black and Latino households that have pursued higher education often lack access to these networks and resources, but black college- goers in particular carry a disproportionate burden of student loan debt that saps their resources and diminishes their ability to build wealth. While attending and graduating college is associated with greater wealth for all American households and is a boost to lifetime earnings and wealth, it’s not enough to overcome historic and accumulated white advantages in building wealth. An individual’s striving to get a degree is not sufficient to close the racial wealth gap.
Raising children in a two-parent household does not close the racial wealth gap.
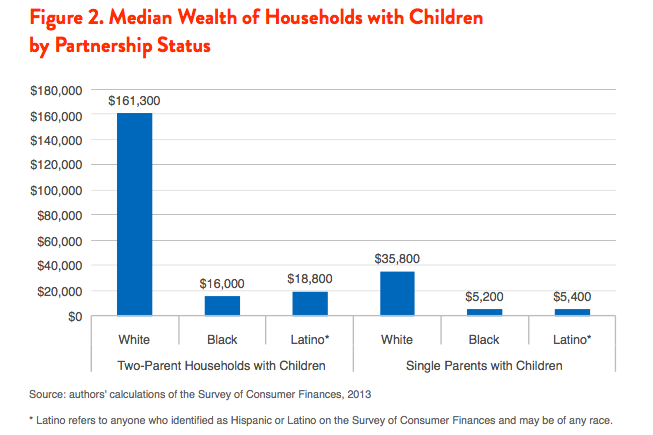
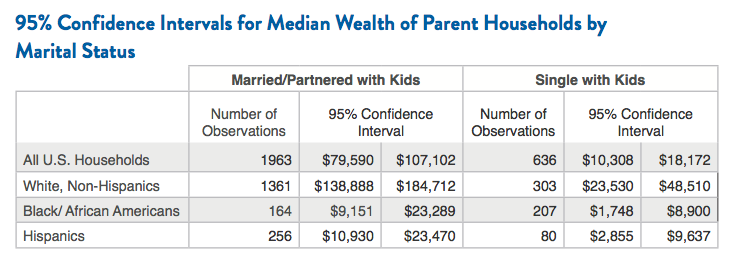
The median white single parent has 2.2 times more wealth than the median black two-parent household and 1.9 times more wealth than the median Latino two-parent household.
Raising children is expensive. The high cost of child care and difficulty of supporting a family on a single income make it particularly difficult for single parents to get by, much less build wealth. Not surprisingly, single parent households have much higher poverty rates and significantly lower wealth than two-parent households. Yet, raising children in a two-parent household isn’t enough to overcome racial disparities in wealth. According to data from the Survey of Consumer Finances, the median white single parent has 2.2 times more wealth than the median black two-parent household and 1.9 times more wealth than the median Latino two-parent household.
As Figure 2 shows, black couples with children had $16,000 in wealth at the median, while Latino couples with children had $18,800 in wealth at the median. For each group, this is significantly more than the wealth of single-parent households. Yet it is a fraction of the $161,300 in median wealth held by white couples with children—and is still significantly less than the $35,800 in median wealth held by white single parents. Despite the financial benefits of marriage and partnership, including the opportunity to share expenses, provide child care within the family, or have two adult earners, the median white single parent is $19,800 wealthier than the median black couple with children, and $17,000 wealthier than the median Latino couple with children. It’s clear that raising children with two parents is not enough to overcome the racial wealth gap—or even to pull families out of poverty. In 2014, black children with married parents were 3 times more likely to be living in poverty than white children with married parents, while Latino children with married parents were 4 times more likely to be living in poverty than their white counterparts.
In 1965, Senator Daniel Patrick Moynihan’s report, The Negro Family: The Case for National Action, attributed racial inequality as well as poverty and crime in the black community to family structure, particularly the prevalence of families headed by single mothers. Not only did research at the time cast doubt on this causality, but evidence over the last the 50 years demonstrates that rates of child poverty, educational attainment, and crime do not track rates of single parenthood. Thus, even though the share of children living with a single mother rose for all racial and ethnic groups through the mid-1990s and has remained high since then, school completion and youth arrests for violent crimes have declined significantly, while poverty rates have fluctuated according to economic conditions. Family structure does not drive racial inequity, and racial inequity persists regardless of family structure. The benefits of intergenerational wealth transfers and other aspects of white privilege discussed above benefit white single mothers, enabling them to build significantly more wealth than married parents of color.
Working full time does not close the racial wealth gap.
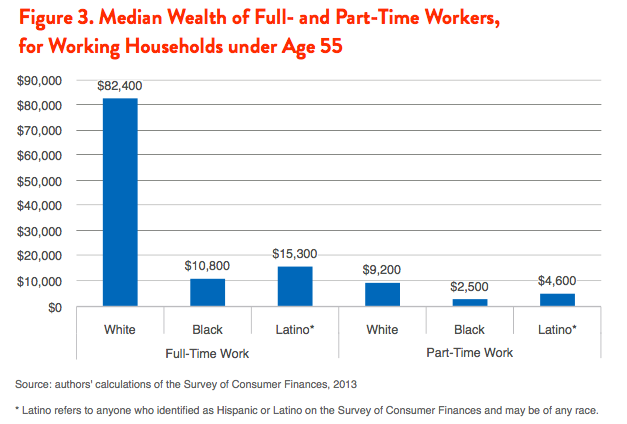
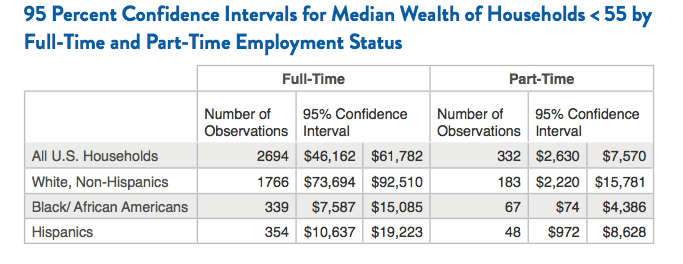
The median white household that includes a full-time worker has 7.6 times more wealth than the median black household with a full-time worker. The median white household that includes a full-time worker also has 5.4 times more wealth than the median Latino household with a full-time worker.
Full-time work is critical to the economic security of most American households. Full-time jobs generally pay more per hour than comparable part-time work and are more likely to offer benefits such as employer-provided health coverage, paid sick time, and workplace retirement plans that can provide greater opportunities for employees to build wealth. At the median, households in which at least 1 member works full time (35 or more hours per week) have greater wealth than households where the only jobs held are part-time positions (less than 35 hours per week). But working full time isn’t enough to close the racial wealth gap. According to data from the Survey of Consumer Finances, the median white household that includes a full-time worker has 7.6 times more wealth than the median black household with a full-time worker. The median white household that includes a full-time worker also has 5.4 times more wealth than the median Latino household with a full-time worker. Even white households that include only part-time workers—with at least 1 person in the household employed but not working more than 35 hours a week—have statistically indistinguishable levels of wealth as black households with a member employed full-time.
As Figure 3 shows, black households with at least 1 worker employed full time had $10,800 in wealth at the median, while Latino households with at least 1 worker employed full time had $15,300 in wealth at the median. For both groups, this is significantly more than the wealth of households where workers held only part-time jobs. Yet it is nowhere near the $82,400 in median wealth held by white households with a full-time worker. Working full time is far from enough for households of color to catch up to white wealth. Despite all the wealth-building benefits of full-time employment, median black and Latino households with full-time workers had essentially the same level of wealth as the median white household with only part-time employment.
Americans of all races and ethnicities work hard: among working white, black, and Latino households with a head under age 55, all work at least 40 hours a week at the median and 80 percent or more have an adult employed full-time. Yet work effort does not pay off equally: in 2012, white workers employed full time earned a median wage of $792 a week, compared to $621 for African Americans and $568 for Latinos. Considering gender makes the pay disparities even more glaring: Latina women employed full time earned median weekly wages equal to just 59 percent of the wages earned by white males, while black women earned just 68 percent as much. However, even if households earned the same income, the racial wealth gap would persist. Previous research from Demos and Institute on Assets and Social Policy at Brandeis University finds that if the distribution of incomes for black and Latino Americans was similar to that of white households (with a median equal to $50,400 in 2011), the wealth gap between black and white households would shrink just 11 percent at the median and the wealth gap between Latino and white households would shrink just 9 percent. An individual’s striving to get a higher paid job or work more hours is not enough to close the racial wealth gap.
Spending less does not close the racial wealth gap.
The average white household spends 1.3 times more than the average black household of the same income group.
Personal finance experts abound with advice on how to build wealth by moderating personal spending and shifting a greater share of income into savings and investment. Yet, evidence from a recent Duke University study suggests that reduced spending is not enough to close the racial wealth gap between black and white households. Drawing on data from the 2013 and 2014 Consumer Expenditure Surveys, researchers find that the average white household spends 1.3 times more than the average black household of the same income group. In general, little research has been published on racial and ethnic differences in spending patterns and no findings were available on consumer spending among Latino households.
The Duke study divided households into low-, medium-, and high-income groups and found that white households in every income group spent more on average than black households in the same group. On average, white households spent $13,700 per quarter, compared to $8,400 for black households. Even after accounting for factors such as family structure, income, occupation, and geography, as well as wealth and homeownership, white households at all income levels continued to spend more than comparable black households, with low-income white households spending $1,200 more per quarter than low-income black households and high-income white households spending $1,400 more than their black counterparts.
The study also looked at specific categories of spending, finding that white households spend about twice as much as black households on entertainment among all income groups and that white households, especially those with low incomes, spend more than black households on cars. The researchers note that “for clothing, jewelry, personal care, entertainment, eating out, and other non- essential spending, our findings show that black consumers in fact spend the same or much less than whites, at all income levels.” The only category in which black households were found to consistently spend more was for utilities, including payments for electricity, heating fuel, water, sewer and telephone service; this may be due to the common utility company practice of risk-based pricing, which requires a deposit or other form of additional payment from customers with low credit scores, without stable employment, or with criminal records. While technically color-blind, risk-based pricing can have a disproportionate impact on black consumers, causing them to be charged more than white households for the same service.
Differences in spending habits cannot explain the racial wealth gap: white households spend more than black households with similar incomes, yet also have more wealth. While spending less and saving more may be excellent advice for individuals, the evidence suggests that personal spending habits are not driving the racial wealth gap and cannot succeed in closing it.
Conclusion
In order for our nation to begin addressing disparities in wealth and opportunity, we must recognize that the racial wealth gap exists and clearly understand its causes. Public polling data suggest that there remains much work to be done. When asked in a 2016 opinion survey to assess “the financial situation of blacks compared with whites today,” just half of Americans (including 47 percent of white respondents, 58 percent of black respondents, and 49 percent of Latino respondents) recognized that white households were better off financially. No comparable question was asked comparing the finances of Latino and white households. Similarly when the same survey asked about “reasons why black people in our country may have a harder time getting ahead than whites,” majorities of black, white and Latino Americans endorsed explanations such as “lack of motivation to work hard” and “family instability”—factors which the data reveal cannot account for the growth and persistence of the racial wealth gap. Although 77 percent of respondents also identified “racial discrimination” as a reason that black Americans might have a harder time economically, 66 percent asserted that “discrimination that is based on the prejudice of individual people” was a greater problem than “discrimination that is built into our laws and institutions.”
Racial inequality in wealth is rooted in historic discrimination and perpetuated by policy: our analyses show that individual behavior is not the driving force behind racial wealth disparities. Typical black and Latino households that attend college and live in two-parent households still have much less wealth than similarly situated white households. Black and Latino households that include a full-time worker have much less wealth than white households with a full-time worker, and only slightly more wealth at the median than white households where the only person employed works part time. Differences in spending habits also fail to explain wealth disparities between black and white households.
Building a more equitable society will require a shift in focus away from individual behavior towards addressing structural and institutional racism. To aid in that effort, the Institute on Assets and Social Policy developed the Racial Wealth AuditTM as a framework to evaluate public policy proposals for their potential to reduce the racial wealth gap. When policymakers explicitly consider the racial wealth gap in developing policy, the Racial Wealth Audit can provide information to achieve greater racial wealth equity.
Methodological Appendix
In this report, we present key descriptive statistics of household wealth for specific subgroups of interest. Data derive from the Survey of Consumer Finances (SCF) from 2013, the most recent available year for the data, which is among the best national sources of data on household wealth in the United States.
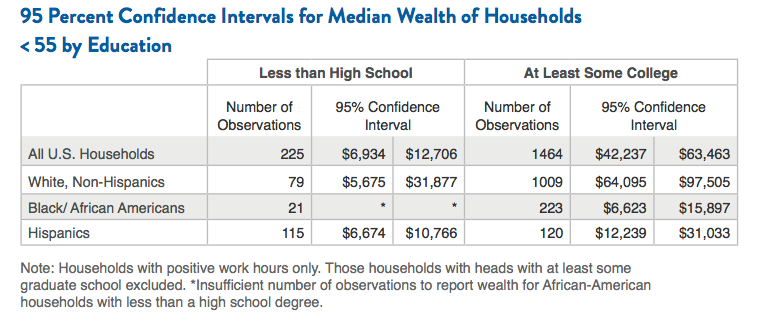
We calculated medians and their confidence intervals for wealth of white, black, and Hispanic [the term used by SCF] households by education, family structure and full-time employment. For the analysis of households by educational level and full-time employment status, only households who reported any positive work hours and whose head was less than 55 years of age were included in the analysis to focus on working households in their prime workforce years.
Because of the highly skewed nature of wealth, the median is
the preferred statistic, as it is not affected by extremely high values. Confidence intervals indicate the range in which we are 95 percent confident the true median value in the population lies. Overlapping confidence intervals between 2 groups indicate that the values for the groups cannot be statistically distinguished; conversely, if the confidence intervals for 2 groups do not overlap, we have sufficient statistical evidence to indicate that the values of the 2 medians are distinct in the true population.
Analysis by race/ethnicity is shaped by the available data in the SCF on the U.S. resident population. Whites are defined for this analysis as non-Hispanic whites. Hispanics may be of any race. There are insufficient data in the SCF to produce this analysis for Native Americans and Asians.
Analysis Results
Education: Median wealth is compared among race/ethnicity subgroups for households whose heads have not completed high school and those whose heads have completed some college or hold an undergraduate degree. Those households with no work hours, with heads greater than 54 years old, and with heads with more than 16 years of education (i.e. those who started or completed graduate school) have been excluded from the analysis.
Since this report focuses on median wealth, 95 percent confidence intervals for all median point estimates are provided. Confidence intervals are calculated using a dataset which averages the data from the 5 implicates that are provided in the SCF data for every survey household in the survey due to multiple imputation (see SCF website for further information on the survey design of the SCF). Median point estimates vary slightly when the dataset is averaged across implicates; however, these confidence intervals provide a conservative estimate of the confidence intervals while adjusting for the structure of the publicly available data.
Family Structure of Parents: Median wealth is compared for parent households—who have children of the head or spouse of any age living
in the household—by marital status of the household head among white, black, and Latino households. Households who are married or living with a partner are included in the married sample.
Full-Time and Part-Time Work of Households: Lastly, median wealth is examined by race/ethnicity for working households categorized by whether a household has an adult employed full time or if the household has only workers employed part time. Households that have at least 1 full-time working adult (at least 35 hours per week) are selected into the group of households working full time, while those with positive work hours but no individual working at least 35 hours per week are included in the group of part-time working households. Households with no work hours and those with heads greater than 54 years old have been excluded from the analysis to focus on working households in their prime years and avoid the inclusion of part-time workers transitioning into retirement.