Executive Summary: How Students Benefit from Reinvestment in Public Higher Education
As a postsecondary degree has become more important than ever in the labor market, and the primary means by which one enters the middle class, the U.S. has simultaneously made it more difficult and more expensive to attain. Over the course of three decades, the cost of public colleges and universities—which educated nearly 3 in 4 students—has risen dramatically. The obvious result of increased cost during a period of stagnant incomes for low-income and middle-class families has been an increased reliance on debt as a way to finance a college education. Just 25 years ago, if a student wanted to attain a bachelor’s degree, it was more likely than not that he or she would be able to do so without borrowing. Now, borrowing is nearly required to graduate with a four-year degree, particularly for low- and middle-income students.
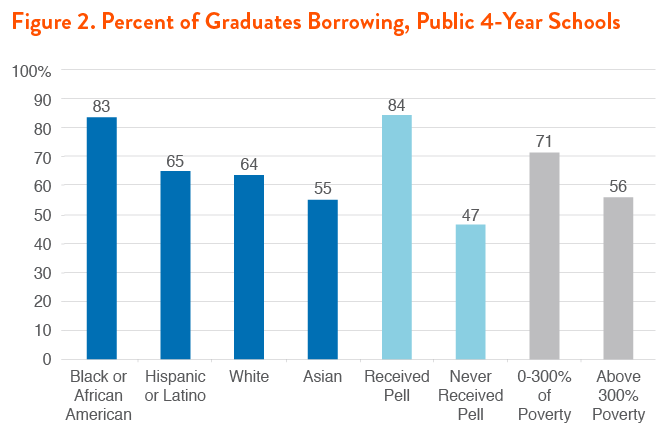
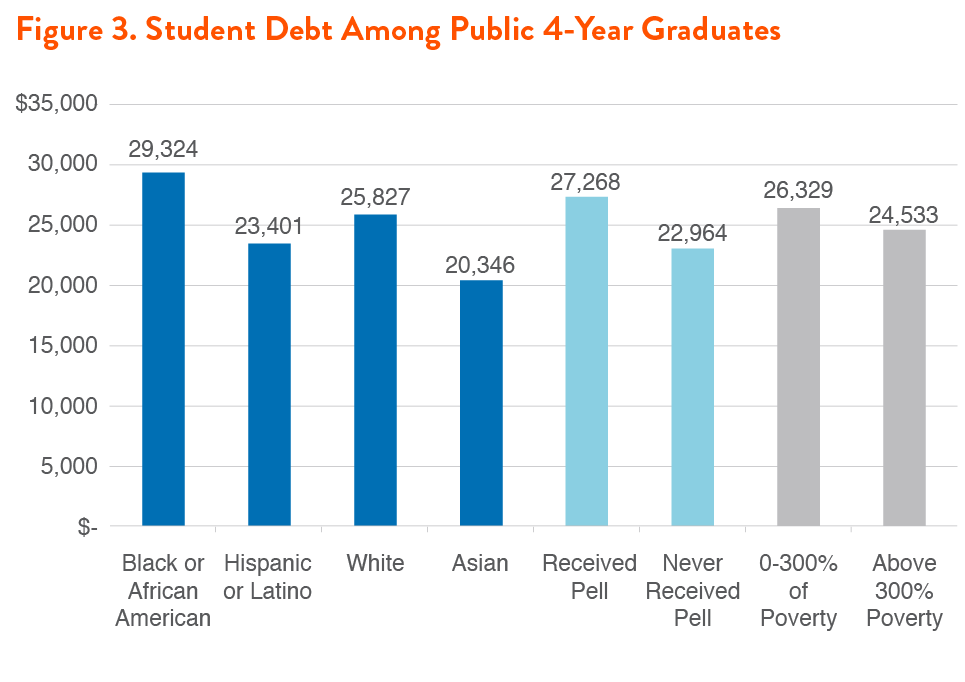
A bachelor’s recipient has a 7-in-10 chance of taking on loans in order to graduate, and 9-in-10 Pell Grant recipients graduate with debt. Average debt at graduation is approaching $30,000 (and is over $30,000 for Pell Grant recipients). Even average borrowing for graduates at public schools—which educate three in four students—is up by nearly a third over the past decade. 64% of bachelor’s degree recipients at public colleges graduate with debt, and even 42% of associate’s degree holders from public schools leave with debt. Black and Hispanic graduates also incur more debt than their white counterparts.
What’s worse, these students may be the best off. Those with credentials are likely to be the best suited to handle student debt, but almost a third—29%—of student borrowers drop out of school, and non-graduates are more likely to face serious trouble repaying loans, becoming delinquent, or defaulting. Students who choose not to take on debt are faced with the choice of working longer hours or enrolling part-time, both of which may decrease the likelihood of graduating.
Reversing these trends matters not just for our economy, but for notions of equity as well. The specter of student debt has the ability to fundamentally change student aspirations, and also raises the stakes of failure with regard to college completion—the rates of which have barely increased just as college costs and debt levels have increased.
How a Federal-State Matching Program Could Work
An incentive grant will allow the federal government to use its leverage to encourage states to develop policies and plans to ensure the majority of poor-, working- and middle class-students can attend college without incurring debt or financial hardship.
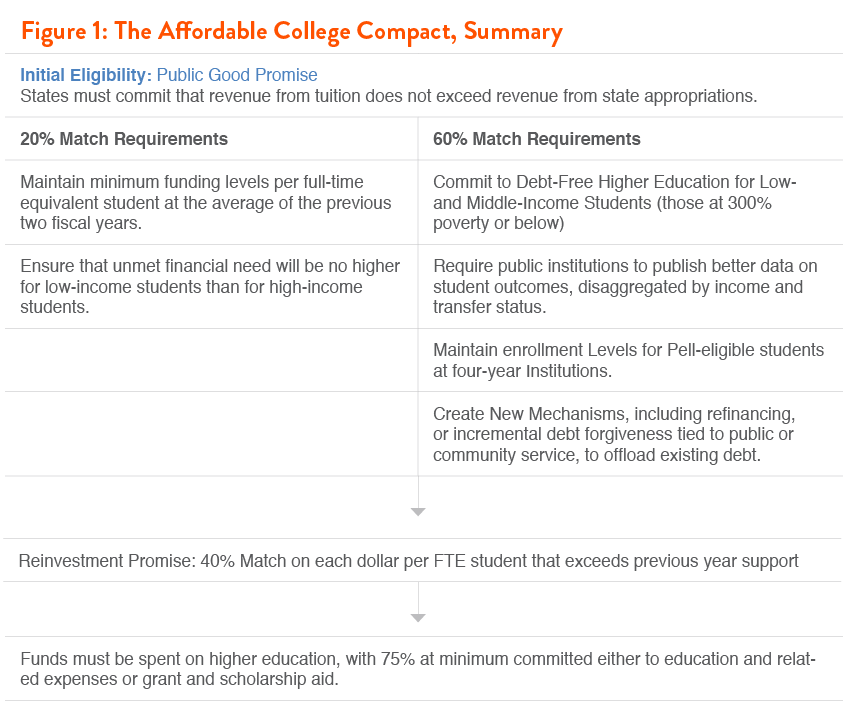
Under the Affordable College Compact, a state’s award—or state match—would be determined by the level of commitment it is willing to provide its students. Eligibility and funding would be determined on an annual basis, and Commitment funds would be required to be spent on higher education.
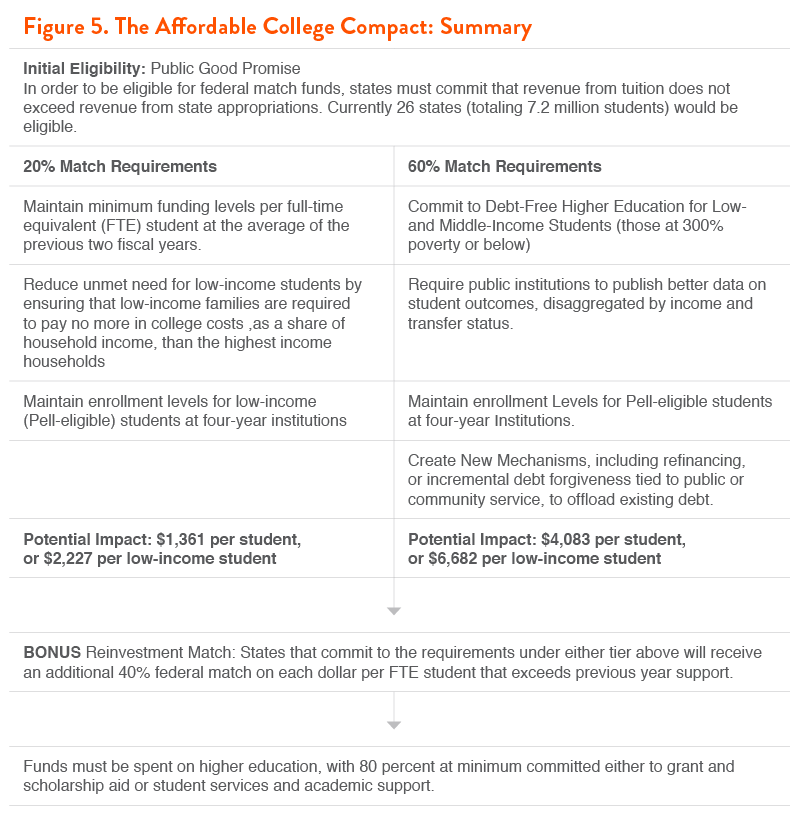
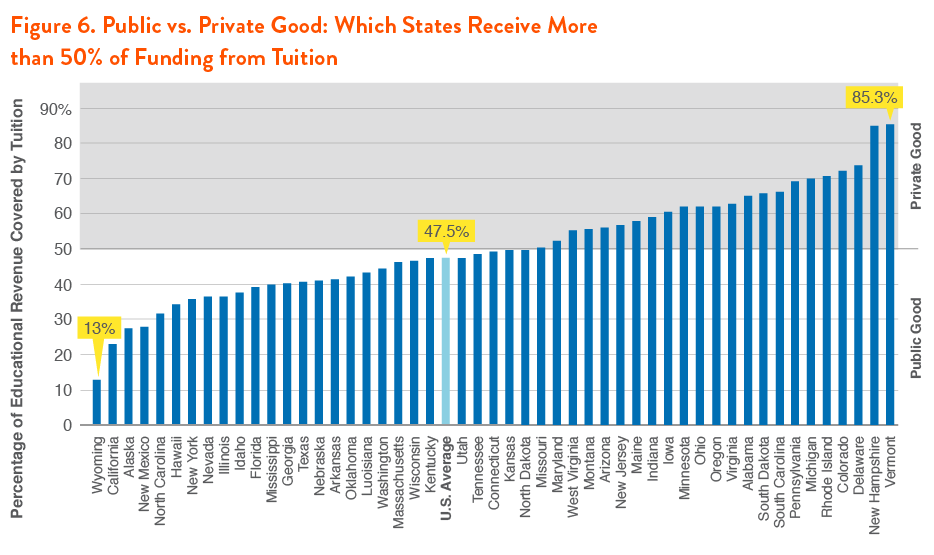
States would first be required to commit that higher education is a public good—in other words, that tuition revenue does not exceed revenue from state appropriations. This is historically consistent with public higher education in the U.S., and will prevent state institutions from excessively increasing tuition in tandem with federal help. Currently, this means that 26 states would be eligible, although any state that committed to higher education as a public good would immediately be eligible for the match.
Depending on the level of state commitment, states would then be eligible for one of two matching grants from the federal government. The first, a 20% match on every dollar spent on public higher education, would require that states maintain minimum per-student funding levels, and promise low-income students that their unmet financial need will make up a manageable portion of family income (or, no higher than the portion of income that high-income families pay).
The second level, a 60% match on every dollar spent on public higher education, would require that states simply commit to debt-free higher education for students at or below 300% of the poverty level, at both two- and four-year institutions. Four-year institutions would also be required to maintain enrollment levels for students eligible for Pell grants, and states would be required to publish better data on student outcomes at state institutions, as well as ensure that struggling borrowers who do take on student debt are provided with debt-relief options, including debt-for-service or refinancing programs.
Finally, any federal-state matching program should encourage more than a minimal effort at returning to a system of robust state investment. Therefore, each dollar committed above and beyond previous per-student funding levels should receive an additional 40% match.
Participating states should be encouraged to message such a commitment as a promise program—modeled off several promising experiments around the U.S.—that notify students and families very early in the educational process about the promise of free tuition and fees. However, this program would go further, promising debt-free higher education—encompassing not just tuition and fees but living expenses as well.
Reinvestment would impact more than just affordability, of course. Higher levels of support for higher education could prevent current phenomenon—particularly at two-year institutions—of not offering classes required for graduation or transfer, or hiring contingent faculty while eliminating full-time teaching positions.
Tackling this problem will require shared responsibility between students, states, and the federal government. Thus, we propose a new federal matching grant program to kickstart reinvestment in a way that makes a fundamental promise to the low- and middle-income students with college aspirations: If you work hard, your state will commit to making the cost of college manageable and prevent the need to take on loans.
State Investment Should Work in Tandem with Federal Financial Aid
A federal-state partnership should work to enhance federal student aid programs—such as the Pell Grant—that have seen their value decrease relative to college costs. Rather than simply increasing federal grant aid in the hopes that it will cover a manageable portion of costs, the Pell Grant should be used as a guide to states for how much to reinvest, and how to target state subsidies.
But a new matching program shouldn’t be an excuse for the federal government to avoid reforming federal financial aid programs. Federal aid programs are often insufficient or inefficient, either not covering a meaningful percentage of college costs or being delivered in a manner that does not help students defray those costs.
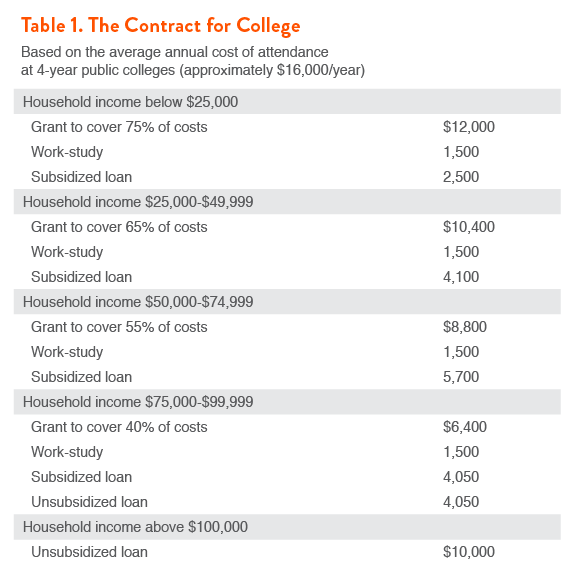
As a guideline, Demos released the Contract for College in 2012, which would align federal student aid programs into one cohesive, guaranteed package for students. This could work in tandem with increased state investment—in fact, states that commit to debt-free college would have an easy guideline by which they could distribute their own support as well as federal subsidies.
The Affordable College Compact: A Federal-State Partnership for Affordable Public Higher Education
The United States has a long and rich history of expanding higher education to an ever greater number of people. Our state universities and colleges have historically been viewed as pillars of our democracy, and lynchpins in our commitment to upward mobility. From the founding of the first land-grant colleges, to the GI bill, to the establishment of community colleges, up through the Higher Education Act of 1965, federal and state policies worked together to make college affordable and increasingly accessible to all Americans. But over the last three decades, policymakers have wavered on this commitment, and our march toward greater college access and completion—by race and by class—has suffered and stalled completely.
Steady and often dramatic decreases in state funding for higher education have resulted in escalating tuition and fees. In the last two decades, published tuition and fees have more than doubled—increasing by 117 percent—at public four-year schools, and increased by 62 percent at two-year schools, even after adjusting for inflation. Federal financial aid has strained to keep up with these rising costs so that today the majority of students must borrow to pay for college, at steadily increasing amounts. Paradoxically, this shift away from higher education being treated as a public good has occurred at the very same time that going to college has become all but required for getting into the middle class. In fact, nearly two-thirds of all new jobs in the next 6 years will require some training beyond high school, and 35 percent will require at least a bachelor’s degree. Yet today, going to college is synonymous with going into debt—a reality that undermines our democracy, our global competitiveness and our promise of equal opportunity.
The burden of taking on debt to enroll in college is borne disproportionately by first-generation, lower-and middle-income students and students of color—all of whom are much more likely to borrow as undergraduates, and to borrow at higher amounts than their wealthier and white counterparts. Today, seven out of ten students graduating from college leave with student debt. The ratio is even higher for the poorest students who receive Pell grants, with nearly nine out of 10 Pell Grant recipients graduating with debt. The average amount of student debt at graduation is just under $30,000 (and is over $30,000 for Pell Grant recipients). This is not simply a problem for students attending pricier, private colleges. Nearly two-thirds of bachelor’s degree recipients from state colleges and universities graduate with student debt and 42 percent of associate’s degree holders from public schools leave with debt. The average amount of debt students accumulate at public schools—which educate three in four students—is up by nearly a third over the past decade.
Our now debt-based system of access is also far more onerous for lower-income and students of color, even at public institutions. These students borrow at much higher rates than white or wealthy counterparts, and must borrow more in order to graduate (see Figures 2 and 3).
Despite the fact that federal student loan programs have been around since the 1950s, the major shift to student debt as a primary way of paying for college unfolded fairly quickly, with sharply escalating average debt burdens over the last decade. As recently as 1993, the majority of graduates did not borrow, and average debt for graduates was under $9,500.
Taking on debt to pay for college is also far from a guarantee that a student will actually graduate. In fact, more than one-quarter (29%) of student borrowers drop out of school, making them much more likely to be delinquent or in default on their loans.
This shift to a debt-based system of higher education has profound implications for our society. Thanks in large part to previous policies designed to make college affordable, our nation ranks highest in the world for college attainment among those over the age of 65. But among the world’s 25-34 year olds, we are only 12th. At a time when our population is becoming increasingly diverse, the gap in college graduation rates by both race and class has widened, despite overall gains in college readiness. For those young people who do graduate, their monthly student debt payments early in their adult life results in substantially less wealth accumulation later in life. Finally, the ubiquity and magnitude of student debt—$1.2 trillion and growing—acts as a damper on our economy as fewer young people can afford the basic but major expenses associated with adulthood—cars, homes and families.
How and Why Have Costs Shifted to Students?
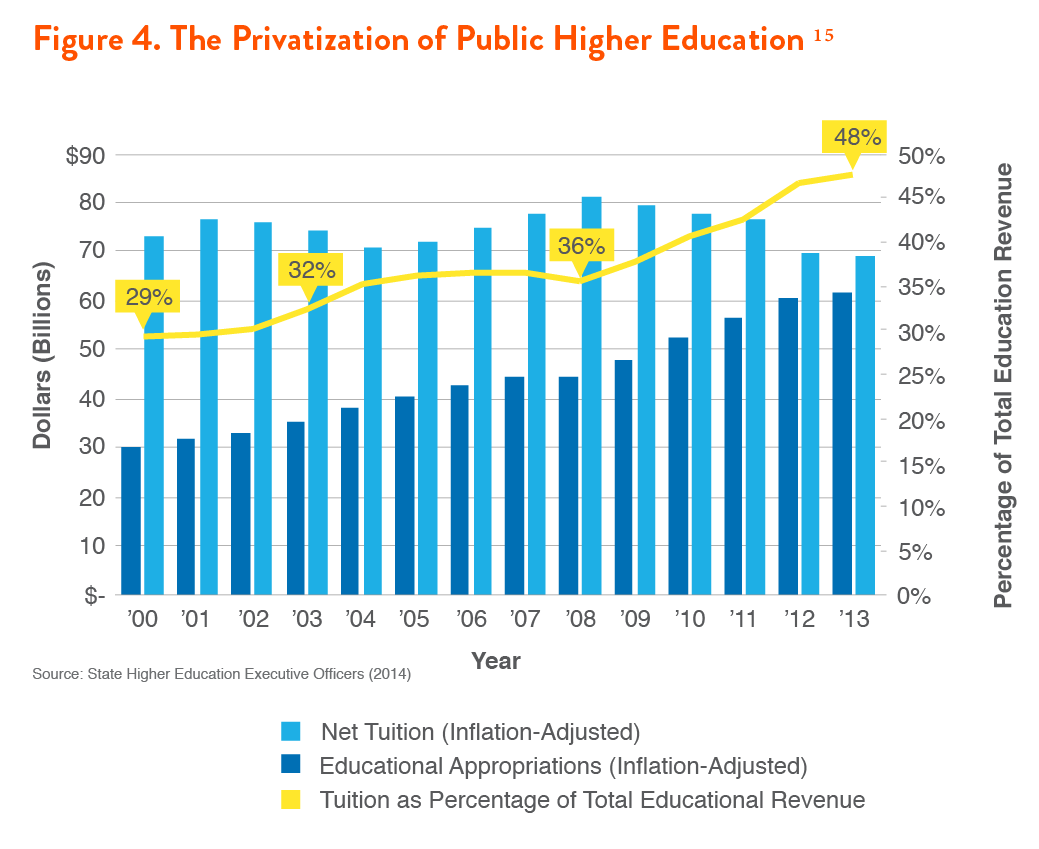
The sharp and consistent increase in college costs and student borrowing at public colleges and universities over the past several decades can be directly linked to a systematic disinvestment by states. Traditionally, state funding has covered the lion’s share of revenues received by state universities—covering the majority of expenses related to operating institutions and educating students. Just 25 years ago, state funding covered three quarters of total educational revenue, with the rest generated by tuition payments and fees.
Yet, state appropriations per student—which make up the primary funding source for state institutions, have dropped by 29 percent over the past 25 years. In order to make up for the loss, institutions have more than doubled the amount in net tuition they receive. We are now close to reaching a “tipping point” in which more educational revenue comes from tuition than from state resources (see Figure 4). Already, in 24 states, public colleges rely more on tuition than state appropriations. This reflects a swift and dramatic shift in how we fund higher education. Just a decade ago, tuition revenue covered less than one third (32%) of total revenue for colleges. Now it covers nearly half (48%). Once public institutions receive more in tuition than they receive in public subsidies, higher education can no longer credibly be called a public good, even as our economy and society demands far more postsecondary credentials.
The recent recession greatly impacted state budgets and exacerbated trends that began a few decades ago. Nearly every state is spending less than it did before the recession, and over half of all states cut per-student funding by at least 25 percent between 2008 and 2013. This past year was the first in which state spending for higher education ticked upward—by a negligible 1.4 percent—but even then, 20 states still cut funding.
The Affordable College Compact: A Tiered Incentive Fund to Support State Higher Education Funding
Our now debt-based system of higher education—fueled by declining state investment—does not serve our democratic or economic interests. With college completion rates stagnating and gaps in degree attainment widening by race and class, there is an urgent need to return to a system of public higher education where student debt is the exception, not the norm. Going back to a debt-free system will require changes in both state funding levels, as well as reformulations of federal financial aid. This proposal aims squarely at restoring state funding for higher education—the first and largest contributor to rising tuition and student debt. The Affordable College Compact would establish a federal incentive grant fund to encourage states to reinvest in their higher education systems so that the majority of poor, working and middle class students can attend and graduate college without incurring debt or financial hardship.
Under the Commitment, a state’s award—or state match—would be determined by the level of commitment it is willing to provide its students. Eligibility and funding would be determined on an annual basis, and Commitment funds would be required to be spent on higher education, with a minimum of 80 percent committed to either grant and scholarship aid, or student and academic services. As a condition of receiving funds, states would also have to distribute funds proportionally across the range of public institutions within the state—including community colleges—and could not, for example, simply spend all federal match funds at a single public flagship institution.
Initial Eligibility Criteria: The Public Good Promise
As recently as 2000, state support exceeded tuition revenue in 47 out of 50 states. Now, this is only the case in 26 states. In order to be eligible for this federal commitment, states would first be required to make public higher education a public good by committing that revenue from tuition will not exceed that from state appropriations at public 2- and 4-year institutions.
The states that make this commitment will be eligible for a federal match in one of three tiers, based on their commitment to various criteria. If this proposal were enacted today, 26 states would be eligible. States in which higher education is currently a public good—in other words, that currently have positive appropriations-to tuition ratios—would be required to not increase the percentage of total educational revenue received from net tuition by more than 3 percent in any given year.i States that are currently ineligible would immediately qualify once they met the “public good” promise, and ensured that revenue from state support exceeded tuition revenue.
Federalism in Education
One concern around federal-state partnerships is that, often due to political concerns, many states may simply not take funding from the federal government, even if the program would provide much needed investment in the state’s higher education system. These concerns are backed by the refusal of several states to take federal funds for other programs, from Medicaid to funds from the American Recovery and Reinvestment Act.
However, there is a long history in education—and higher education specifically, of states partnering with federal incentives to increase per-student support. One such example was the Leveraging Educational Assistance Partnership (LEAP) program, formerly known as the State Student Investment Grant (SSIG) program. Under this program, the federal government incentivized states to create their own need-based grant aid programs, with considerable flexibility. LEAP is widely considered to have achieved its purpose—creating need-based financial aid programs in every state.
Other examples include Race to the Top, the Obama Administration’s incentive grant program for K-12 education. Despite rhetoric at the state level that would indicate otherwise, 41 states submitted applications for the first phase of Race to the Top funding in its first year.
Investment and Equity Promise: 20% Match
The first match tier would provide 20 cents in federal money for every $1 spent on educational appropriations. States would be eligible for this match level if they commit to maintaining minimum funding levels per full-time equivalent (FTE) student, reversing inequitable financial aid policies, and providing students with data on student outcomes.
Requirement 1. Maintain minimum funding levels per FTE at the average of the previous two fiscal years.
To ensure that states are not supplanting internal support with federal dollars, the incentive fund would include strict Maintenance of Effort provisions that require states to keep baseline higher education funding per FTE at current levels. To be eligible for the 20 percent match, states will be required to maintain minimum educational appropriations—not including federal money from either the match or another program—per FTE at the average level of the two previous years. Minimum funding levels per FTE would also be chained to inflation, so states would be required to increase funding levels consistent with an inflation indicator such as the Consumer Price Index (CPI).
Maintenance of Effort (MoE) provisions are commonplace in secondary education, particularly funding formulas that drive the Elementary and Secondary Education Act and Individuals with Disabilities Education Act. Higher education has fewer examples of MoE provisions, but any serious federal-state partnership for higher education should ensure that states are not simply using federal dollars to supplant state resources. One extremely successful example was the Leveraging Educational Assistance Partnerships program, which provided dollar-for-dollar matching funds to states to create need-based aid programs. When LEAP was created (originally as the State Student Incentive Program), nearly half of all states did not have a need-based grant program; now all 50 states do. The incentive was also inexpensive—LEAP was only funded at $64 million in 2010, the last year for which it received funding. Similarly the College Access Challenge Grant (CACG) program (created in 2008) requires that states provide operating support for schools equal to or greater than the average of the previous five years. States proved responsive to the MoE provisions under both CACG as well as the stimulus, maintaining budget levels at or near the minimum threshold under both programs.
Requirement 2: Reduce unmet need for low-income students.
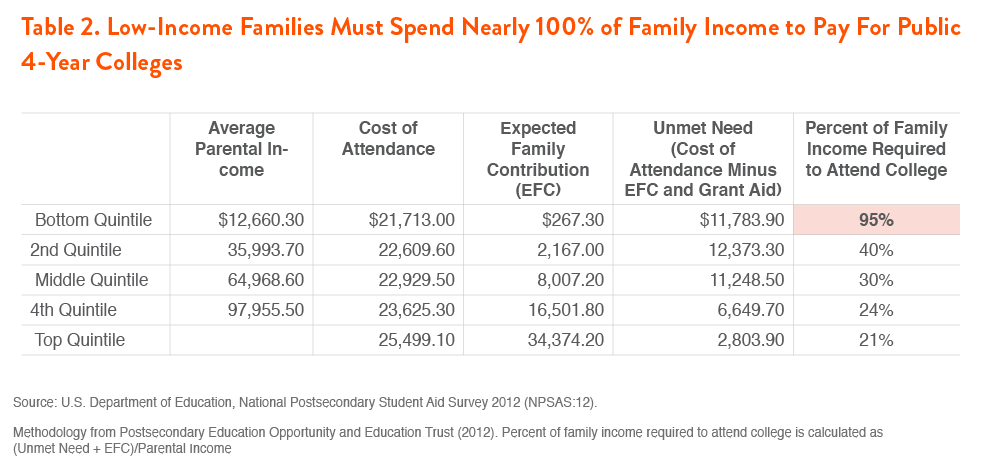
The second requirement would ensure that states and institutions are putting grant aid dollars toward the students who need it the most. Currently, high-income students must pay a very small portion of income, relative to low- and middle-income students, in college costs (see Table 2). After considering total cost of attendance minus any grant and scholarship aid and a family’s Expected Family Contribution, dependent students from high-income families (those in the top quintile), are required to pay 21% of annual income in college costs at public 4-year institutions. By contrast, students from the bottom income quintile must pay 95 percent of annual income in college costs at public four-year schools, and middle-income students must pay 30 percent (see Table 2).
To ensure equitable funding across income levels, states would commit to equalizing the percentage of income required to fund remaining college costs (or, unmet need). An eligible state would have to show that a low-income student—defined as coming from the bottom income quintile, must pay no more in total net costs as a share of household income than high-income students at public 2- and 4-year schools in the state.
The percent of income required would be calculated after accounting for their Expected Family Contribution (EFC), as well as federal (including Pell Grants, SEOG, and Veteran’s Benefits), state, and institutional grant aid. Loans (including federal, state, institutional, or private), or federal higher education tax incentives would not be considered financial aid regardless of the level of subsidy or interest rate on the loan.
Thus, states have flexibility through lowering the cost of attendance, providing and reallocating need-based grant aid, and/or ensuring that students are maximizing the federal grant aid for which they are eligible. States would be allowed to include federal match funds from this tier to achieve this commitment.
Requirement 3: Maintain enrollment levels for Pell-Eligible students at four-year institutions.
In order to receive the 20 percent match, institutions would be required to maintain levels of enrollment for students eligible for Pell Grants. This would ensure that institutions with a public mission are not excluding low-income students, and that those students choice of institution expands beyond “low-cost” or open-access institutions. Given that the total percentage of the student body receiving Pell Grants each year fluctuates, institutions could be given a minimal amount of flexibility in Pell enrollment. For example, if the total percentage of students nationally receiving Pell Grants falls by 5 percent in a given year (perhaps due to a recovering economy), an institution could be provided with a small reprieve if their Pell enrollment falls slightly. However, in order to ensure that institutions are not using a decrease in total Pell enrollment as an excuse, the Department of Education could use its discretion to apply a second metric—such as the percentage of students whose families make below 200 percent of the poverty level—to ensure institutions are maintaining a minimum level of access for low-income students.
How the Investment and Equity Promise (20% Match) Could Work: New York
To illustrate how the 20 percent match tier would work in practice, consider the state of New York, which spends $8,656 in educational appropriations per student, and has a full-time equivalent enrollment of 578,144.
If New York were to commit to the Investment and Equity Promise by maintaining current funding levels, and ensuring that low-income students do not pay more as a percentage of income than high-income students, it would receive an additional $1 billion, or $1,731 per student, if it were to maintain the same funding level as the previous year. At four-year institutions in New York, this federal match alone would cover almost a quarter (22.9%) of the average current net price for low-income students at public 4-year institutions. In other words, this federal match would cover a quarter of the remaining portion of college costs that are not currently covered by grant aid.
If the entirety of the subsidy were funneled to low- and middle-income students in New York, low-income students would stand to benefit by $2,833 per student, which would cover 37.6% of the net cost of attending public four-year institutions in New York for low-income students.
Overall Impact of Investment and Equity Promise
Under the initial Public Good Promise criteria, 26 states would be eligible for matching funds. If all 26 states were to commit to the Investment and Equity promise, states would receive a total of $9.75 billion in matching funds. At current enrollment levels, approximately 7.2 million students—or 63.5 percent of all full-time students at public schools—would stand to benefit, by an average of $1,361 per student. Even if each state kept overall educational appropriations at the same level, this match alone would increase per-student funding above pre-recession levels.
In addition to this subsidy, however, states would be required to ensure that low-income students pay no more than higher income students in college costs, accounting for Expected Family Contribution and grant aid. Consider this provision at the average public 4-year institution (costing $21,713) for a family making $30,000 annually, in a state in which families from the top income quintile pay 30 percent of income in college costs. In addition to the maximum Pell Grant ($5,645) and an EFC of $850, the state would have to ensure that an additional $2,505 were spent to subsidize this student’s college expenses. If a state distributed all federal match money equally with no regard to income, over half ($1,361) of this would come from the federal match, and the other could from state or institutional need-based aid, or by reallocating grant programs that are not currently based on need.
Alternately, the state could use the bulk of the federal match toward need-based aid or other programs to lower the cost for low-income students. If the match funds were entirely used on those making under 300 percent of the federal poverty level, nearly 4.4 million students would stand to benefit, at an average of $2,227 per student. This would represent almost a quarter (23.9%) of the average net cost after grant aid for low-income students at public 4-year institutions.
Defining "Debt-Free"
For the purposes of matching funds under the Affordable College Compact, we define “debt free” to mean reasonably afforded by working 10 hours a week and enrolled full-time in school. Research has shown that students who work 10 hours a week stand to benefit academically, while those who work more than 20 hours and enroll part-time are more likely to drop out.
Codified, “debt free” means that unmet financial need at a public four-year school does not exceed the amount a student can earn from a job at the state minimum wage, working 10 hours a week throughout the academic year. Assuming a 35 week academic year, at the current federal minimum wage ($7.25/hour), this would mean that unmet need could not exceed $2,537 for any low- and middle-income student at a public four-year institution. This is nearly the same amount in unmet need that students from the top income quintile ($2,803) face each year (see Table 2, above).
Debt-Free Higher Education Guarantee: 60% Match
The largest match tier under the Affordable College Compact would be reserved for those states that are truly willing to return college to a debt-free system for low- and middle-income students. States that make this and additional commitments would receive $.60 for every dollar spent on educational appropriations per FTE. Given that the commitments in this tier overlap with those in the Investment and Equity (20% match) tier, states would not be required to fulfill those criteria, but would be required to commit to the following:
Requirement 1: Commit to debt-free higher education for low- and middle-income students.
In exchange for the highest match tier, states would promise that low- and middle-income students would receive enough support from federal, state, and institutional resources to cover the cost of attendance, minus a family’s Expected Family Contribution. This Affordable College Compact would include all four-year public institutions within the state in addition to lower cost public 2-year institutions should a student decide to attend. Students must be eligible for debt-free higher education for up to 10 non-consecutive semesters.
The definition of middle-income—the limit at which states must assure debt-free college—would be defined as up to 300 percent of the poverty level. Assuming a household size of three, this would include all families making under $59,370.
For a matter of perspective, 61 percent of all full-time students at public schools are between 0-300 percent of the poverty level(compared to 47 percent of those attending private non-profit schools), so this commitment would cover most students, returning public higher education to a debt-free proposition in states that are eligible. Making this commitment would certainly cover most of the 64 percent of public 4-year graduates (and 42 percent of the associate’s degree recipients from public schools) who borrow to attain a degree.
Requirement 2: Require public institutions to publish better data on student outcomes, disaggregated by income and transfer status.
Currently, institutions report graduation outcomes for first-time, full-time undergraduate students, and are only required to disclose graduation rates for Pell Grant students upon request. Requirements for reporting employment and labor market outcomes for students are minimal as well. As a condition for receiving at least 60 percent of their annual funding for higher education, states would commit to collecting and publishing outcome data for low-income students, as well as data on part-time and transfer students (disaggregated by the type of degree or credential received). This would provide a minimum level of accountability, allowing students to better understand potential differences in quality between state institutions. In addition to graduation data, states should link institutional data with state Unemployment Insurance databases in order to publish information on labor market outcomes.
Requirement 3: Maintain enrollment levels for Pell-Eligible students at four-year institutions.
As with the 20 percent match, in order to receive the 60 percent match, public four-year institutions would be required to maintain (or increase) levels of enrollment for students eligible for Pell Grants. This would ensure that institutions with a public mission are not excluding low-income students, and that those students choice of institution expands beyond “low-cost” or open-access institutions. Given that the total percentage of the student body receiving Pell Grants each year fluctuates, institutions could be given a minimal amount of flexibility in Pell enrollment. For example, if the total percentage of students nationally receiving Pell Grants falls by 5 percent in a given year (perhaps due to a recovering economy), an institution could be provided with a small reprieve if their Pell enrollment falls slightly. However, in order to ensure that institutions are not using a decrease in total Pell enrollment as an excuse, the Department of Education could use its discretion to apply a second metric—such as the percentage of students whose families make below 200 percent of the poverty level—to ensure institutions are maintaining a minimum level of access for low-income students.
Requirement 4: Create new mechanisms, including refinancing and service, to offload debt.
For students who are required to (or choose to) borrow to finance higher education under the commitment, states would be required to create new state authorities that allow students to reduce debt burdens, either through refinancing student loans to take advantage of low interest rates, or by providing incremental loan forgiveness for students who commit to working in public or community service within the state. Students with undergraduate debt who work in public service for 3 or more years within the state and continue to make loan payments could receive a portion of their balance forgiven, with the percentage being determined by the state authority.
Overall Impact of the Debt-Free Guarantee: A Good Deal for States
The average net price for low-income students at public 4-year institutions across the United States is $9,319. However, this hides considerable variation across states—from a low of $5,920 (Hawaii) to a high of $14,167 (Delaware).
As above, assume 26 states would be eligible to participate in the Debt-Free Guarantee. If all were to participate, we estimate the total federal match would come out to $29.2 billion. Assuming current enrollment levels in all 26 states, approximately 7.2 million students would stand to benefit by an average of $4,083 per student across participating states.
Currently, 61.1 percent of students at public institutions are between 0 and 300 percent of the federal poverty level. Assuming current enrollment levels, participating states would require a debt-free guarantee for roughly 4.4 million students. Given the total federal match, this would come out to roughly $6,682 per low- or middle-income student if all eligible states participated. This number represents nearly three-fourths (72%) of the net price low-income students face after all grant aid at four-year schools. Suffice it to say, this represents a considerable benefit to participating states, which could fund the additional unmet need through a combination of new state or institutional aid, existing merit-based aid, and other sources.
BONUS Reinvestment Match: 40% Federal Match on Each Dollar Exceeding Current Funding
Of course, the goal of this incentive fund is not merely to return state higher education funding to pre-recession levels, but to encourage states to continually increase investment for public institutions. Thus, states who commit to all of the requirements under either the 20 percent match level or 60 percent match level, would receive a 40 percent match on every dollar per FTE student (excluding federal funds) that exceeds previous funding levels.
As an example of how this might work, consider a participating state that spent $1,000 per FTE in 2013, and spends $1,500 per FTE in 2014. If the state were participating in the 20 percent match tier, the federal government would provide a 20 percent match on the first $1,000 (totaling $200), and a 40 percent match on the additional $500 (totaling $200). Thus, total support per student, including federal matching funds, would equal $1,900. If the state were participating in the 60 percent match tier, the federal government would provide a 60 percent match on the first $1,000 (totaling $600), and a 40 percent match on the additional $500 (totaling $200). Thus, total support per student, including federal matching funds, would equal $2,300.
The 40 percent match would apply to each dollar above the average of the previous two years’ funding levels, adjusted for inflation, to incentivize continual increases in state appropriations.
The Compounding Benefit of Reinvestment
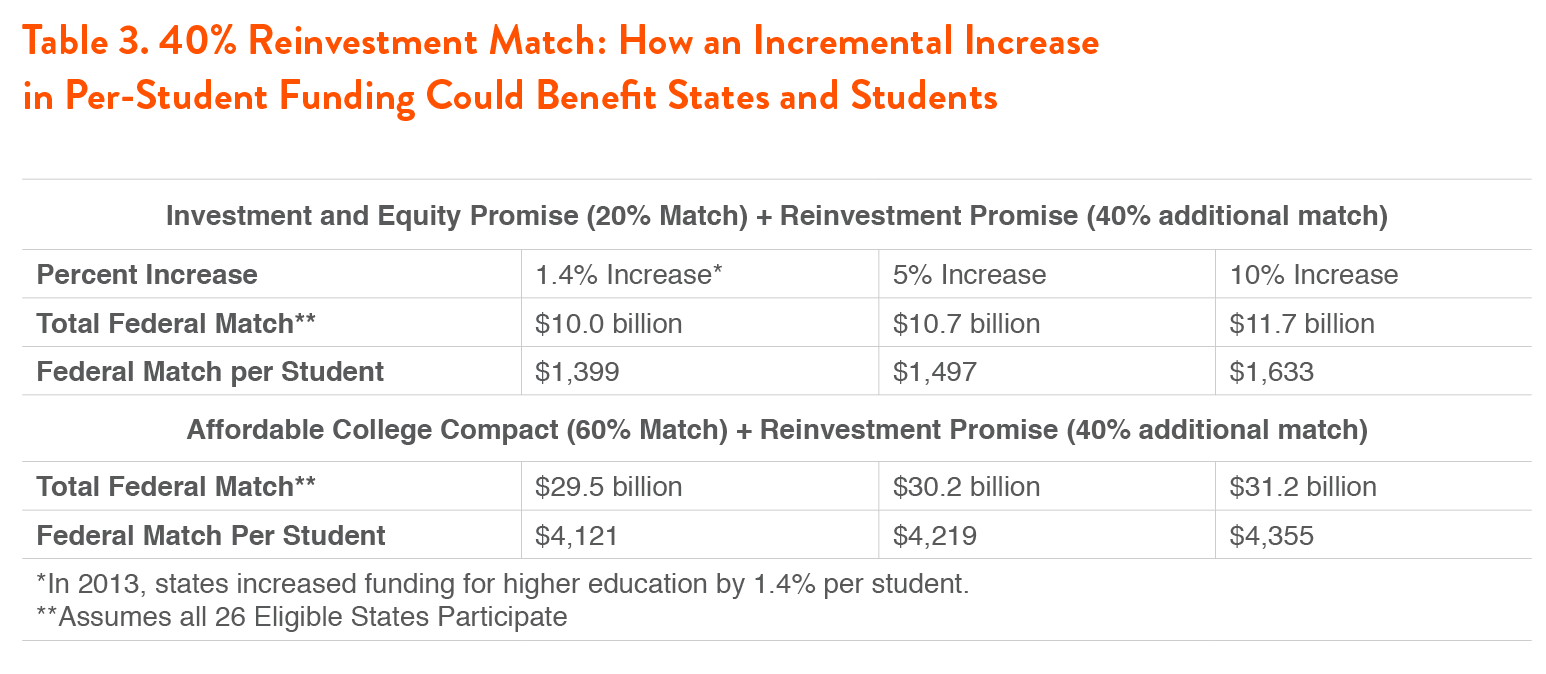
In 2013, states increased per-student funding by an average of 1.4 percent. Among the 26 states that are eligible by way of the initial Public Good Promise criteria, 18 increased appropriations per student between 2012 and 2013.
Eligible states spent a total of $48.7 billion on educational appropriations in 2013. If all these states increased funding again by 1.4 percent, the total reinvestment match would equal nearly $273 million on top of the 20 percent match already received. If each of the 26 eligible states participated in the 20 percent match level and increased appropriations by 1.4 percent, this would mean a total of $10.0 billion in matching funds for states, or $1,399 per student (see Table 3).
Contract for College: State Investment in Tandem with Federal Financial Aid
A federal-state partnership should work to enhance federal student aid programs—such as the Pell Grant—that have seen their value decrease relative to college costs. Rather than simply increasing federal grant aid in the hopes that it will cover a manageable portion of costs, the Pell Grant should be used as a guide to states for how much to reinvest, and how to target state subsidies.
To highlight this, students in the bottom quintile at public 4-year schools, according to federal methodology, are “expected” to contribute an average of $267 for college. However, these students face a net cost of college of nearly $12,000, which is the equivalent of poverty-level wages.
States for whom the Pell Grant does not sufficiently meet the needs of low-income students should increase subsidies and target grant aid to ensure that unmet need is reduced and debt-free college is a possibility.
But nor should a new matching program be an excuse for the federal government to avoid reforming federal financial aid programs. Federal aid programs are often insufficient or inefficient, either not covering a meaningful percentage of college costs or being delivered in a manner that does not help students defray those costs.
As a guideline, Demos released the Contract for College in 2012, which would align federal student aid programs into one cohesive, guaranteed package for students. This could work in tandem with increased state investment—in fact, states that commit to debt-free college would have an easy guideline by which they could distribute their own support as well as federal subsidies.
How Do We Pay for Debt-Free College?
For perspective, the proposed investment in debt-free college—approximately $29.5 billion if all currently eligible states participated at current funding levels and increased state funding by 1.4 percent—is almost equal to the amount of federal undergraduate loans (including Direct subsidized and unsubsidized loans) disbursed at public schools in 2012-13, which totaled $30.7 billion. It also is less than the federal government spends on Pell Grants each year. Outside of higher education, the Debt Free College Commitment would cost less than 20 percent of what the government loses each year on preferential tax rates on capital gains and dividends.
Congress could fund this proposal through a variety of mechanisms—both inside and outside the higher education budget. Within the higher education realm, the federal government issues $34 billion annually in tax-based student aid—including the American Opportunity Tax Credit, tuition tax deduction, Lifetime Learning Credit, and other benefits. These forms of aid do not reach students in time to pay tuition or other bills related to college, nor are they targeted at low-income students. Repurposing most or all of this aid—either by phasing out eligibility for tax filers making over $100,000, or eliminating ineffective tax expenditures—would entirely fund this Debt-Free college proposal.
In addition, Congress could consider an institutional risk-sharing program (or “Student Loan Default Fee”), in which institutions—including for-profit, private, and public—with high cohort default rates (CDRs) on student loans are required to pay a portion of the defaulted loan balances from their institutions into a fund that would go toward borrower relief as well as preventing students from needing to borrow in the future. In 2014, Sens. Reed (D-RI), Warren (D-MA), and Durbin (D-IL) introduced a bill that would require risk-sharing payments by institutions with default rates of 15 percent or higher. While this proposal has not been costed out, the total balance (including interest) of defaulted federal student loans was $97.5 billion in the second quarter of 2014. Capturing just a portion of that balance from the institutions students attended before defaulting could fund a portion of the Affordable College Compact, as well as incentivize improvement from institutions with very high default rates.
However, it may not be wise to fund such a program entirely through a federal higher education budget that has been consistently short on funding itself. In addition, the entire function of this Affordable College Compact is to reduce the need to borrow. Given current accounting rules, fewer borrowers would reduce the amount the federal government makes on student loans. However, states, corporations, and financial institutions all stand to gain from a better-skilled population, and thus could be a part of funding a proposal that would undoubtedly make that a reality.
Conclusion
The normalization of debt as the primary way to finance college threatens both our conception of education as a worthy public investment, while committing a generation of young people to a level of debt that often constrains their life choices and hampers their ability to become financially stable. As postsecondary education has become necessary for upward economic mobility, we have made the risks of failing at that education higher than ever—through a lifetime of debt or the catastrophic consequences of default. States have an opportunity to reverse this trend and provide real opportunity for students—particularly those underserved students who are going to make up a substantial portion of our future workforce. Disinvesting in public education has been catastrophic—reversing it will require the federal government and states to work together to make college more affordable, and return it to the debt-free promise it once was.
Appendix
Appendix Table 1. Educational Appropriations, Tuition, and Tuition as a Percent of All Education Revenue
| State |
Educational Appropriations |
Net Tuition |
Tuition as a Percent of All Education Revenue |
|
Alabama
|
$1,001,364,017
|
$1,650,863,201
|
65.0%
|
|
Alaska
|
$335,346,800
|
$127,752,000
|
27.6%
|
|
Arizona
|
$1,383,366,300
|
$1,658,979,500
|
56.2%
|
|
Arkansas
|
$670,846,982
|
$408,887,504
|
41.5%
|
|
California
|
$10,800,858,000
|
$3,256,057,682
|
23.2%
|
|
Colorado
|
$582,727,485
|
$1,511,706,976
|
72.2%
|
|
Connecticut
|
$756,887,141
|
$731,909,952
|
49.2%
|
|
Delaware
|
$202,886,697
|
$559,488,627
|
73.5%
|
|
Florida
|
$2,787,329,057
|
$1,804,494,398
|
39.3%
|
|
Georgia
|
$2,291,564,868
|
$1,532,718,053
|
40.1%
|
|
Hawaii
|
$425,703,405
|
$221,464,166
|
34.2%
|
|
Idaho
|
$347,801,088
|
$208,839,010
|
37.5%
|
|
Illinois
|
$3,576,392,031
|
$2,013,654,100
|
36.7%
|
|
Indiana
|
$1,282,128,783
|
$1,860,971,938
|
59.2%
|
|
Iowa
|
$683,894,842
|
$1,042,082,712
|
60.4%
|
|
Kansas
|
$793,332,707
|
$778,486,369
|
49.5%
|
|
Kentucky
|
$973,363,255
|
$874,506,843
|
47.3%
|
|
Louisiana
|
$880,494,332
|
$672,197,554
|
43.3%
|
|
Maine
|
$231,417,606
|
$318,438,429
|
57.9%
|
|
Maryland
|
$1,596,291,890
|
$1,754,029,406
|
52.4%
|
|
Massachusetts
|
$1,171,537,382
|
$1,004,739,170
|
46.2%
|
|
Michigan
|
$1,969,787,412
|
$4,558,718,031
|
69.8%
|
|
Minnesota
|
$1,023,167,040
|
$1,670,056,875
|
62.0%
|
|
Mississippi
|
$700,741,735
|
$462,695,023
|
39.8%
|
|
Missouri
|
$1,035,672,104
|
$1,056,792,316
|
50.5%
|
|
Montana
|
$182,151,670
|
$227,989,504
|
55.6%
|
|
Nebraska
|
$630,872,986
|
$436,446,204
|
40.9%
|
|
Nevada
|
$420,908,477
|
$242,573,993
|
36.6%
|
|
New Hampshire
|
$73,983,294
|
$414,831,186
|
84.9%
|
|
New Jersey
|
$1,761,082,000
|
$2,312,115,980
|
56.8%
|
|
New Mexico
|
$835,767,933
|
$324,711,803
|
28.0%
|
|
New York
|
$5,004,442,819
|
$2,764,283,840
|
35.6%
|
|
North Carolina
|
$3,248,566,752
|
$1,490,728,267
|
31.5%
|
|
North Dakota
|
$269,558,538
|
$266,607,433
|
49.7%
|
|
Ohio
|
$1,863,131,337
|
$3,065,747,624
|
62.2%
|
|
Oklahoma
|
$888,129,338
|
$644,369,783
|
42.0%
|
|
Oregon
|
$673,405,735
|
$1,109,895,178
|
62.2%
|
|
Pennsylvania
|
$1,600,341,869
|
$3,599,042,396
|
69.2%
|
|
Rhode Island
|
$155,158,564
|
$376,135,149
|
70.8%
|
|
South Carolina
|
$764,222,416
|
$1,283,364,069
|
66.1%
|
|
South Dakota
|
$157,146,708
|
$257,472,533
|
65.7%
|
|
Tennessee
|
$1,083,519,309
|
$988,779,202
|
48.4%
|
|
Texas
|
$6,181,597,222
|
$4,212,514,131
|
40.5%
|
|
Utah
|
$663,684,400
|
$602,423,454
|
47.6%
|
|
Vermont
|
$63,551,475
|
$307,098,044
|
85.3%
|
|
Virginia
|
$1,454,296,199
|
$2,409,965,534
|
62.8%
|
|
Washington
|
$1,246,580,100
|
$993,828,360
|
44.4%
|
|
West Virginia
|
$392,711,991
|
$420,616,885
|
55.4%
|
|
Wisconsin
|
$1,388,697,951
|
$1,218,321,064
|
46.7%
|
|
Wyoming
|
$370,009,335
|
$55,138,576
|
13.0%
|
|
United States
|
$68,878,421,378
|
$61,765,530,027
|
47.5%
|
Appendix Table 2. Impact of Investment and Equity (20% Match for Eligible States)
| State |
Net Price
for Low-Income Students
|
FTE
Enrollment
|
Estimated
FTE Enrollment,
Low- and Middle-
Income Students
|
Educational Appropriations Per Student |
20% Match |
20% Match per FTE Student
|
20% Match Per Low-Income Student
|
Targeted 20% Match as Percent of Net Price for Low-Income Students
|
|
Alaska
|
$10,465
|
21,131
|
12,911
|
$15,870
|
$67,069,360
|
$ 3,174
|
$ 5,195
|
49.6%
|
|
Arkansas
|
$8,395
|
122,418
|
74,797
|
$ 5,480
|
$134,169,396
|
$ 1,096
|
$ 1,794
|
21.4%
|
|
California
|
$7,423
|
1,478,928
|
903,625
|
$ 7,303
|
$2,160,171,600
|
$ 1,461
|
$ 2,391
|
32.2%
|
|
Connecticut
|
$9,552
|
87,810
|
53,652
|
$8,620
|
$151,377,428
|
$ 1,724
|
$ 2,821
|
29.5%
|
|
Florida
|
$7,186
|
619,195
|
378,328
|
$ 4,502
|
$557,465,811
|
$ 900
|
$ 1,473
|
20.5%
|
|
Georgia
|
$9,281
|
354,989
|
216,898
|
$6,455
|
$458,312,974
|
$ 1,291
|
$ 2,113
|
22.8%
|
|
Hawaii
|
$5,920
|
41,088
|
25,105
|
$10,361
|
$85,140,681
|
$ 2,072
|
$ 3,391
|
57.3%
|
|
Idaho
|
$11,583
|
57,837
|
35,338
|
$6,013
|
$69,560,218
|
$ 1,203
|
$ 1,968
|
17.0%
|
|
Illinois
|
$11,805
|
375,190
|
229,241
|
$9,532
|
$715,278,406
|
$ 1,906
|
$ 3,120
|
26.4%
|
|
Kansas
|
$ 9,770
|
140,182
|
85,651
|
$5,659
|
$158,666,541
|
$ 1,132
|
$ 1,852
|
19.0%
|
|
Kentucky
|
$ 8,809
|
155,586
|
95,063
|
$6,256
|
$194,672,651
|
$ 1,251
|
$ 2,048
|
23.2%
|
|
Louisiana
|
$7,007
|
174,552
|
106,651
|
$5,044
|
$176,098,866
|
$ 1,009
|
$ 1,651
|
23.6%
|
|
Massachusetts
|
$10,351
|
171,974
|
105,076
|
$6,812
|
$234,307,476
|
$ 1,362
|
$ 2,230
|
21.5%
|
|
Mississippi
|
$10,635
|
133,501
|
81,569
|
$5,249
|
$140,148,347
|
$ 1,050
|
$ 1,718
|
16.2%
|
|
Nebraska
|
$9,091
|
81,175
|
49,598
|
$7,772
|
$126,174,597
|
$ 1,554
|
$ 2,544
|
28.0%
|
|
Nevada
|
$8,339
|
65,917
|
40,275
|
$6,385
|
$84,181,695
|
$ 1,277
|
$ 2,090
|
25.1%
|
|
New Mexico
|
$ 7,243
|
101,239
|
61,857
|
$8,255
|
$ 167,153,587
|
$ 1,651
|
$ 2,702
|
37.3%
|
|
New York
|
$7,545
|
578,144
|
353,246
|
$8,656
|
$1,000,888,564
|
$ 1,731
|
$ 2,833
|
37.6%
|
|
North Carolina
|
$6,511
|
410,622
|
250,890
|
$7,911
|
$ 649,713,350
|
$ 1,582
|
$ 2,590
|
39.8%
|
|
North Dakota
|
$7,382
|
37,108
|
22,673
|
$7,264
|
$53,911,708
|
$ 1,453
|
$ 2,378
|
32.2%
|
|
Oklahoma
|
$7,660
|
144,138
|
88,068
|
$6,162
|
$177,625,868
|
$ 1,232
|
$ 2,017
|
26.3%
|
|
Tennessee
|
$8,260
|
196,097
|
119,815
|
$5,525
|
$216,703,862
|
$ 1,105
|
$ 1,809
|
21.9%
|
|
Texas
|
$ 7,839
|
987,506
|
603,366
|
$6,260
|
$1,236,319,444
|
$ 1,252
|
$ 2,049
|
26.1%
|
|
Utah
|
$ 9,995
|
123,851
|
75,673
|
$5,359
|
$132,736,880
|
$ 1,072
|
$ 1,754
|
17.5%
|
|
Washington
|
$6,227
|
248,273
|
151,695
|
$5,021
|
$249,316,020
|
$ 1,004
|
$ 1,644
|
26.4%
|
|
Wisconsin
|
$ 8,759
|
229,463
|
140,202
|
$6,052
|
$277,739,590
|
$ 1,210
|
$ 1,981
|
22.6%
|
|
Wyoming
|
$ 7,490
|
25,669
|
15,684
|
$14,415
|
$74,001,867
|
$ 2,883
|
$ 4,718
|
63.0%
|
|
All Eligible States
|
$9,319
|
7,163,584
|
4,376,950
|
$ 6,804
|
$9,748,906,789
|
$ 1,361
|
$ 2,227
|
23.9%
|
Appendix Table 3 Impact of Debt-Free (60%) Match for Eligible States
| State |
Net Price for Low-
Income Students
|
FTE Enrollment |
Estimated FTE
Enrollment, Low-
and Middle-
Income Students
|
Educational Appropriations Per Student
|
60% Match
|
60% Match per FTE Student
|
60%
Match
Per Low-Income Student
|
Targeted 60%
Match as Percent of Net Price
for Low-Income Students
|
|
Alaska
|
$10,465
|
21,131
|
12,911
|
$15,870
|
$201,208,080
|
$9,522
|
$15,584
|
148.9%
|
|
Arkansas
|
$8,395
|
122,418
|
74,797
|
$ 5,480
|
$402,508,189
|
$3,288
|
$5,381
|
64.1%
|
|
California
|
$7,423
|
1,478,928
|
903,625
|
$ 7,303
|
$6,480,514,800
|
$4,382
|
$7,172
|
96.6%
|
|
Connecticut
|
$9,552
|
87,810
|
53,652
|
$8,620
|
$454,132,285
|
$5,172
|
$8,464
|
88.6%
|
|
Florida
|
$7,186
|
619,195
|
378,328
|
$ 4,502
|
$1,672,397,434
|
$2,701
|
$4,420
|
61.5%
|
|
Georgia
|
$9,281
|
354,989
|
216,898
|
$6,455
|
$1,374,938,921
|
$3,873
|
$6,339
|
68.3%
|
|
Hawaii
|
$5,920
|
41,088
|
25,105
|
$10,361
|
$255,422,043
|
$6,216
|
$10,174
|
171.9%
|
|
Idaho
|
$11,583
|
57,837
|
35,338
|
$6,013
|
$208,680,653
|
$3,608
|
$5,905
|
51.0%
|
|
Illinois
|
$11,805
|
375,190
|
229,241
|
$9,532
|
$2,145,835,219
|
$5,719
|
$9,361
|
79.3%
|
|
Kansas
|
$ 9,770
|
140,182
|
85,651
|
$5,659
|
$475,999,624
|
$3,396
|
$5,557
|
56.9%
|
|
Kentucky
|
$ 8,809
|
155,586
|
95,063
|
$6,256
|
$584,017,953
|
$3,754
|
$6,143
|
69.7%
|
|
Louisiana
|
$7,007
|
174,552
|
106,651
|
$5,044
|
$528,296,599
|
$3,027
|
$4,953
|
70.7%
|
|
Massachusetts
|
$10,351
|
171,974
|
105,076
|
$6,812
|
$702,922,429
|
$4,087
|
$6,690
|
64.6%
|
|
Mississippi
|
$10,635
|
133,501
|
81,569
|
$5,249
|
$420,445,041
|
$3,149
|
$5,154
|
48.5%
|
|
Nebraska
|
$9,091
|
81,175
|
49,598
|
$7,772
|
$378,523,792
|
$4,663
|
$7,632
|
83.9%
|
|
Nevada
|
$8,339
|
65,917
|
40,275
|
$6,385
|
$252,545,086
|
$3,831
|
$6,270
|
75.2%
|
|
New Mexico
|
$ 7,243
|
101,239
|
61,857
|
$8,255
|
$501,460,760
|
$4,953
|
$8,107
|
111.9%
|
|
New York
|
$7,545
|
578,144
|
353,246
|
$8,656
|
$3,002,665,691
|
$5,194
|
$8,500
|
112.7%
|
|
North Carolina
|
$6,511
|
410,622
|
250,890
|
$7,911
|
$1,949,140,051
|
$4,747
|
$7,769
|
119.3%
|
|
North Dakota
|
$7,382
|
37,108
|
22,673
|
$7,264
|
$161,735,123
|
$4,358
|
$7,133
|
96.6%
|
|
Oklahoma
|
$7,660
|
144,138
|
88,068
|
$6,162
|
$532,877,603
|
$3,697
|
$6,051
|
79.0%
|
|
Tennessee
|
$8,260
|
196,097
|
119,815
|
$5,525
|
$650,111,585
|
$3,315
|
$5,426
|
65.7%
|
|
Texas
|
$ 7,839
|
987,506
|
603,366
|
$6,260
|
$3,708,958,333
|
$3,756
|
$6,147
|
78.4%
|
|
Utah
|
$ 9,995
|
123,851
|
75,673
|
$5,359
|
$398,210,640
|
$3,215
|
$5,262
|
52.6%
|
|
Washington
|
$6,227
|
248,273
|
151,695
|
$5,021
|
$747,948,060
|
$3,013
|
$4,931
|
79.2%
|
|
Wisconsin
|
$ 8,759
|
229,463
|
140,202
|
$6,052
|
$833,218,771
|
$3,631
|
$5,943
|
67.9%
|
|
Wyoming
|
$ 7,490
|
25,669
|
15,684
|
$14,415
|
$222,005,601
|
$8,649
|
$14,155
|
189.0%
|
|
All Eligible States
|
$9,319
|
7,163,584
|
4,376,950
|
$ 6,804
|
$29,246,720,366
|
$4,083
|
$6,682
|
71.7%
|
This publication was funded in part by the Kresge Foundation