Blog
Rise in Inequality Projected to Continue Until 2035
That's depressing.
There's no end in sight to our era of rising inequality for the forseeable future, absent a big policy or economic shift. That's the big takeaway from a new Congressional Budget Office working paper that finds that under current policy and past income trends, income inequality will continue to rise until 2035, before levelling off.
By that point, incomes will have steadily diverged for nearly sixty years.
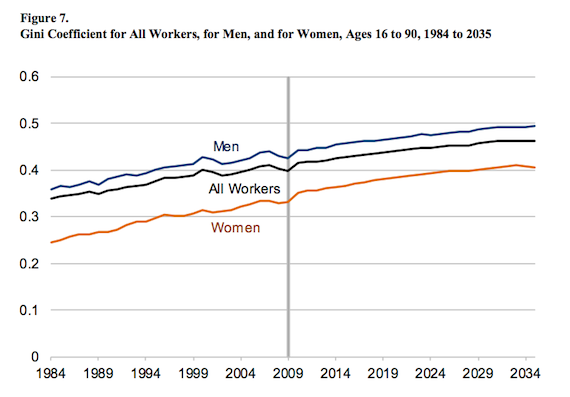
The CBO provides a stunning chart of the rise of inequality, measured by the Gini coefficient ratio between the after-tax income, from 1984 to 2035.
The CBO's summary of the changes in inequality (as measured by the Gini coefficient):
Between 1984 and 2000, the Gini coefficient is estimated to have risen from 0.34 to 0.40, an increase of 18 percent. Over the next decade, inequality appears to have remained roughly unchanged, and, by 2009, the Gini coefficient was at the same level as in 2000. Through 2035, CBOLT projects that inequality will continue to rise, but at a slower rate. Between 2009 and 2035, the Gini coefficient for all workers is projected to rise by 17 percent, from 0.40 in 2009 to 0.46 in 2035.
Income is notoriously difficult to calculate, particularly given the new trend of stagnation in the face of GDP growth. The CBO’s model, called CBOLT, takes a conservative approach: it looks at the prior thirty-five years of data on Social Security recipients broken down by age, race, and marital status, before income growth stagnated.
CBOLT's accuracy lies in its unique dataset, micro-data from the Social Security administration. Essentially, the model looks at a representative sample of individuals based on income, race, and sex and extrapolates until 2035 based on past trends. This makes the model uniquely accurate in projecting income trends because it uses data at the individual level, relying on a robust amount of information provided to the government through Social Security information, instead of rough averages provided by tax data.
Here's all the various factors, and assumptions, implicit in CBOLT's projection:
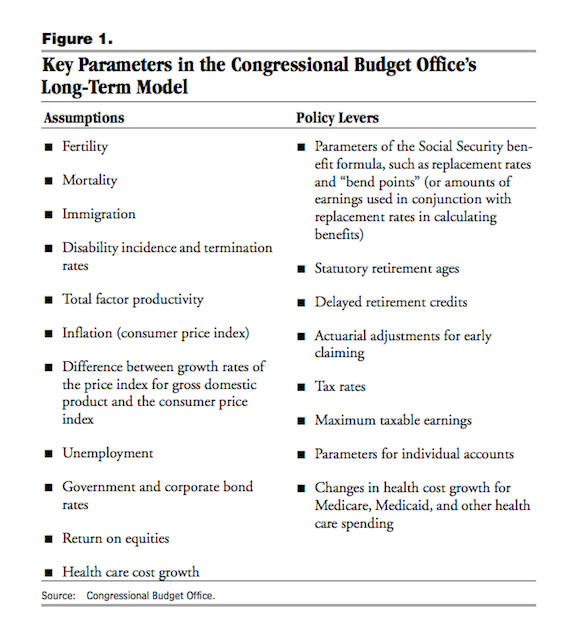
As Matthew Klein at Bloomberg summarizes well, modeling inequality trends is very difficult. There are many assumptions worked into an income distribution projection, particularly whether the author believes that lagging social insurance or insufficient educational attainment is more important for rising inequality.
Those assumptions remain in the CBO's model. But we can safely assume this is the conservative projection: As CBOLT relies on trends from the past two decades, should income continue its ahistorical stagnation and capital markets their unchecked growth, the gap between rich and poor will outstrip their predictions.
We've entered the new Gilded Age. Like before, it won't be stopped absent robust intervention.
Image

Image

Policy Briefs
