Blog
Need Last-Minute Bracket Help? These Schools Would Win if March Madness were About Affordability and Mobility
Today marks an annual rite of spring for American workers, who across the country are joining in solidarity for a massive work slowdown, sending a strong message to employers that the decoupling of productivity and worker pay has resulted in a pretty raw deal for everyone but those at the very top of the economic ladder.
I’m speaking of course about the NCAA Men’s Basketball Tournament, which by some estimates hoovers $2 billion in lost productivity due to the all-day menu of first round games on Thursday and Friday.
Employee output isn't everything of course. There are less-quantifiable benefits to act as a bulwark against all the casual work stoppages, like the goodwill generated when employees can congregate for a little downtime and talk smack about their alma mater.
For colleges and universities, making an on-court splash can have all kinds of effects on the institution. The “Cinderella Effect,” in which little-known schools upset the traditionally dominant programs and see student interest and applications spike as a result, is well documented. Another study found that advancing to the Sweet 16, Elite Eight, and Final Four, increases applications significantly. The eventual National Champion tends to see the number of applicants increase by 6-7% the following academic year.
All this (effectively free) advertising is certainly powerful for potential students, especially those from working-class families whose exposure to the world of higher education may come less from a college counselor and more from CBS Sports. These are students for whom information about college is opaque, who face difficulty even determining an institution's price, how much they may have to borrow, or whether students like them are able to graduate and gain a foothold of economic security.
With that in mind, we’ve created our own bracket here, matching up colleges not by the number of McDonald’s High School All-Americans on their roster, but by whether or not they provide access to an affordable education and whether they are engines of upward mobility for working-class students.
Hey, it beats picking teams based on mascots (sorry, Jackrabbits).
A Bit about Methodology
The winner of each matchup is determined by three factors. The most important determinant of a team moving on is the net price charged to those low-income students (from families making under $30,000 annually) who receive federal grant or loan aid, using data from the U.S. Department of Education’s Integrated Postsecondary Education Data System in 2014-15 (the most recent year available). As Robert Kelchen, professor at Seton Hall – a #9 seed in this year’s South Region – noted in his own “Net Price Madness” brackets, these figures are a decent if imperfect guide for affordability. So, for colleges whose net prices are within the amount that could be earned with a full-time summer job at the state minimum wage, weight was given to colleges who enroll a greater percentage of low-income students (those receiving Pell Grants). And finally, using new data from Stanford Professor Raj Chetty and his colleagues with the Equality of Opportunity Project on colleges and upward mobility, we matched schools up on their mobility rate, or the percentage of their student body that both came from the bottom quintile of income and reach the top income quintile in adulthood. Obviously the percent of a student body coming from low-income backgrounds will influence a school’s mobility rate, so these variables were used as more of a tiebreaker when net prices were in a similar range. Some colleges, like the Universities of Arizona, Wisconsin, and Minnesota, are linked in the Chetty data with other colleges in their state system.
The Picks
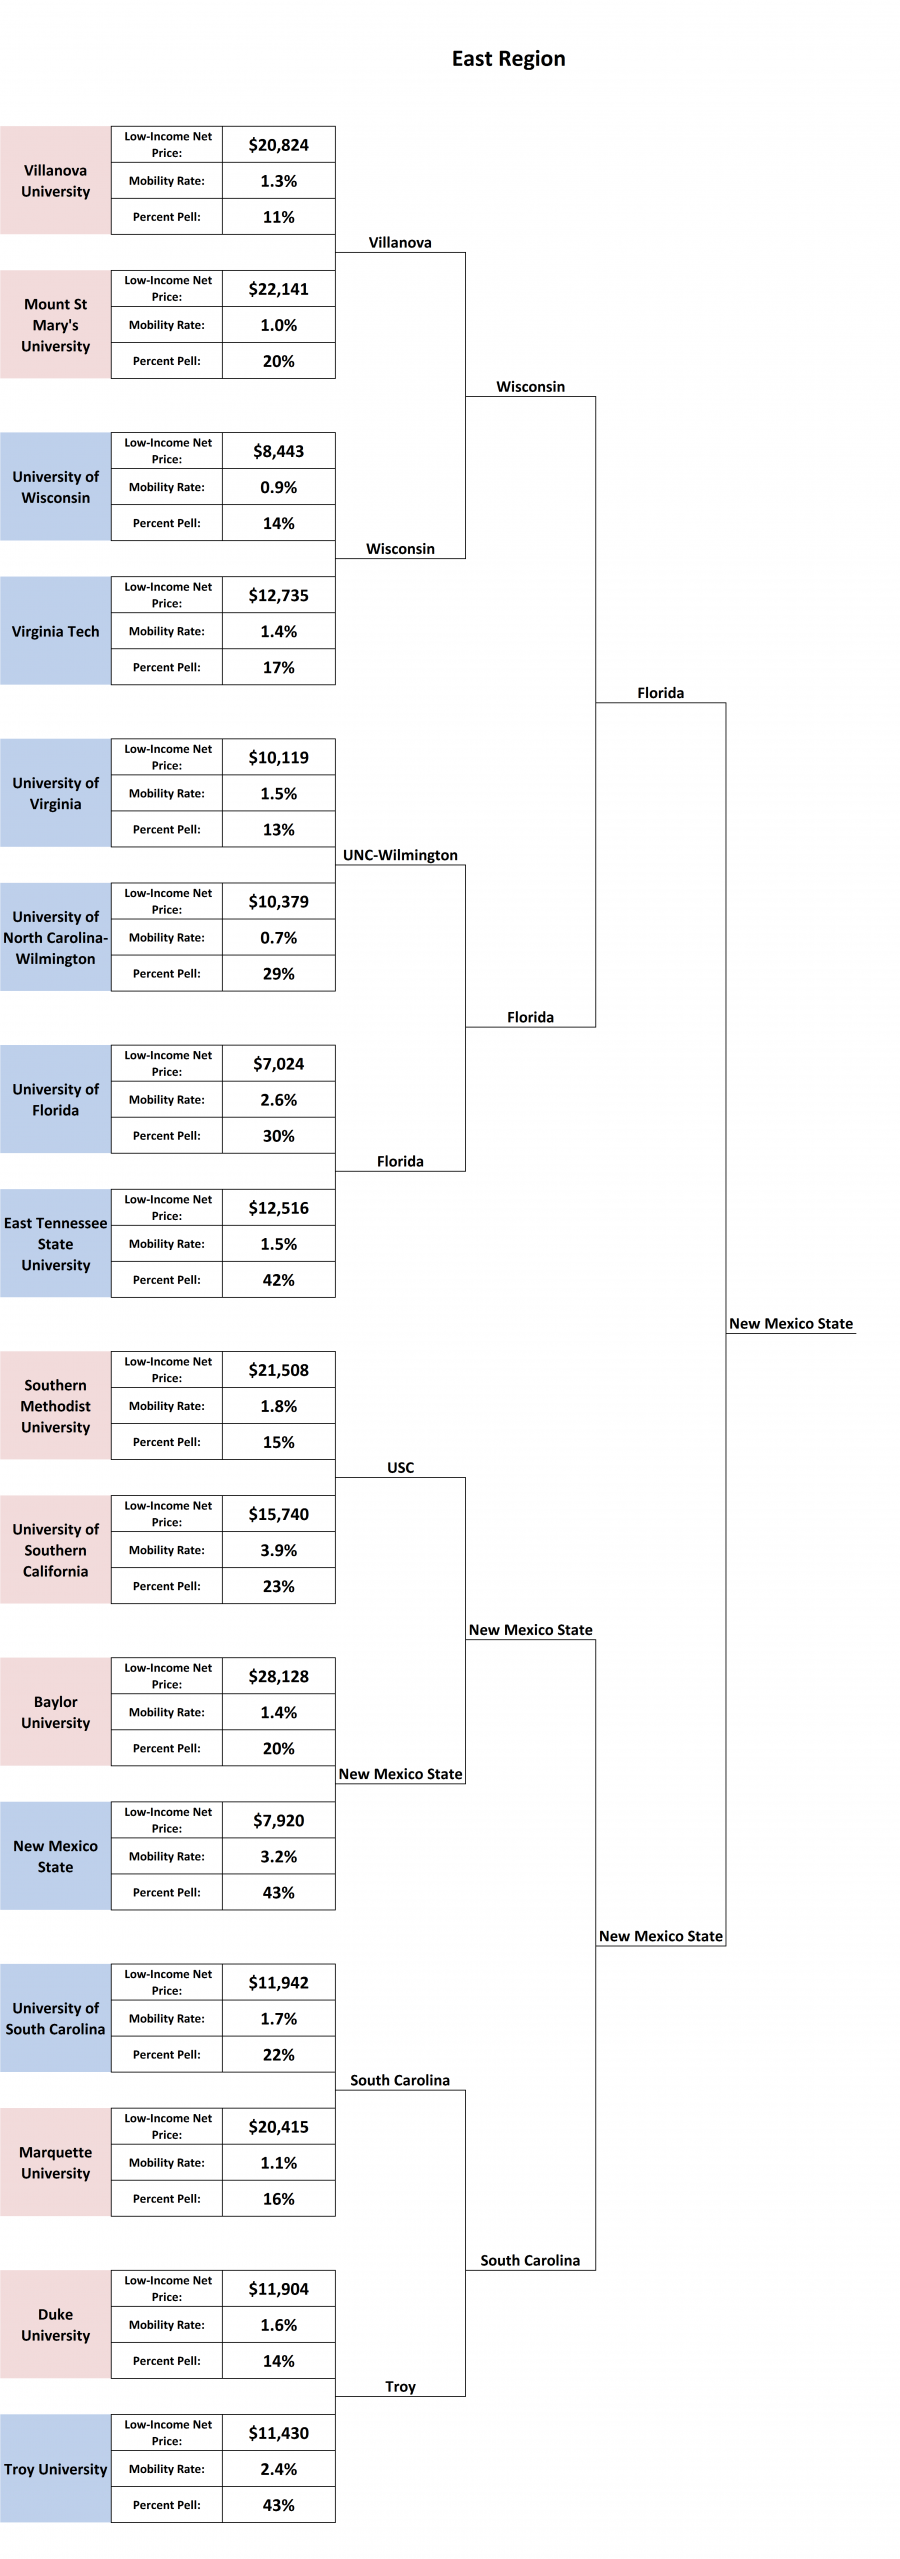
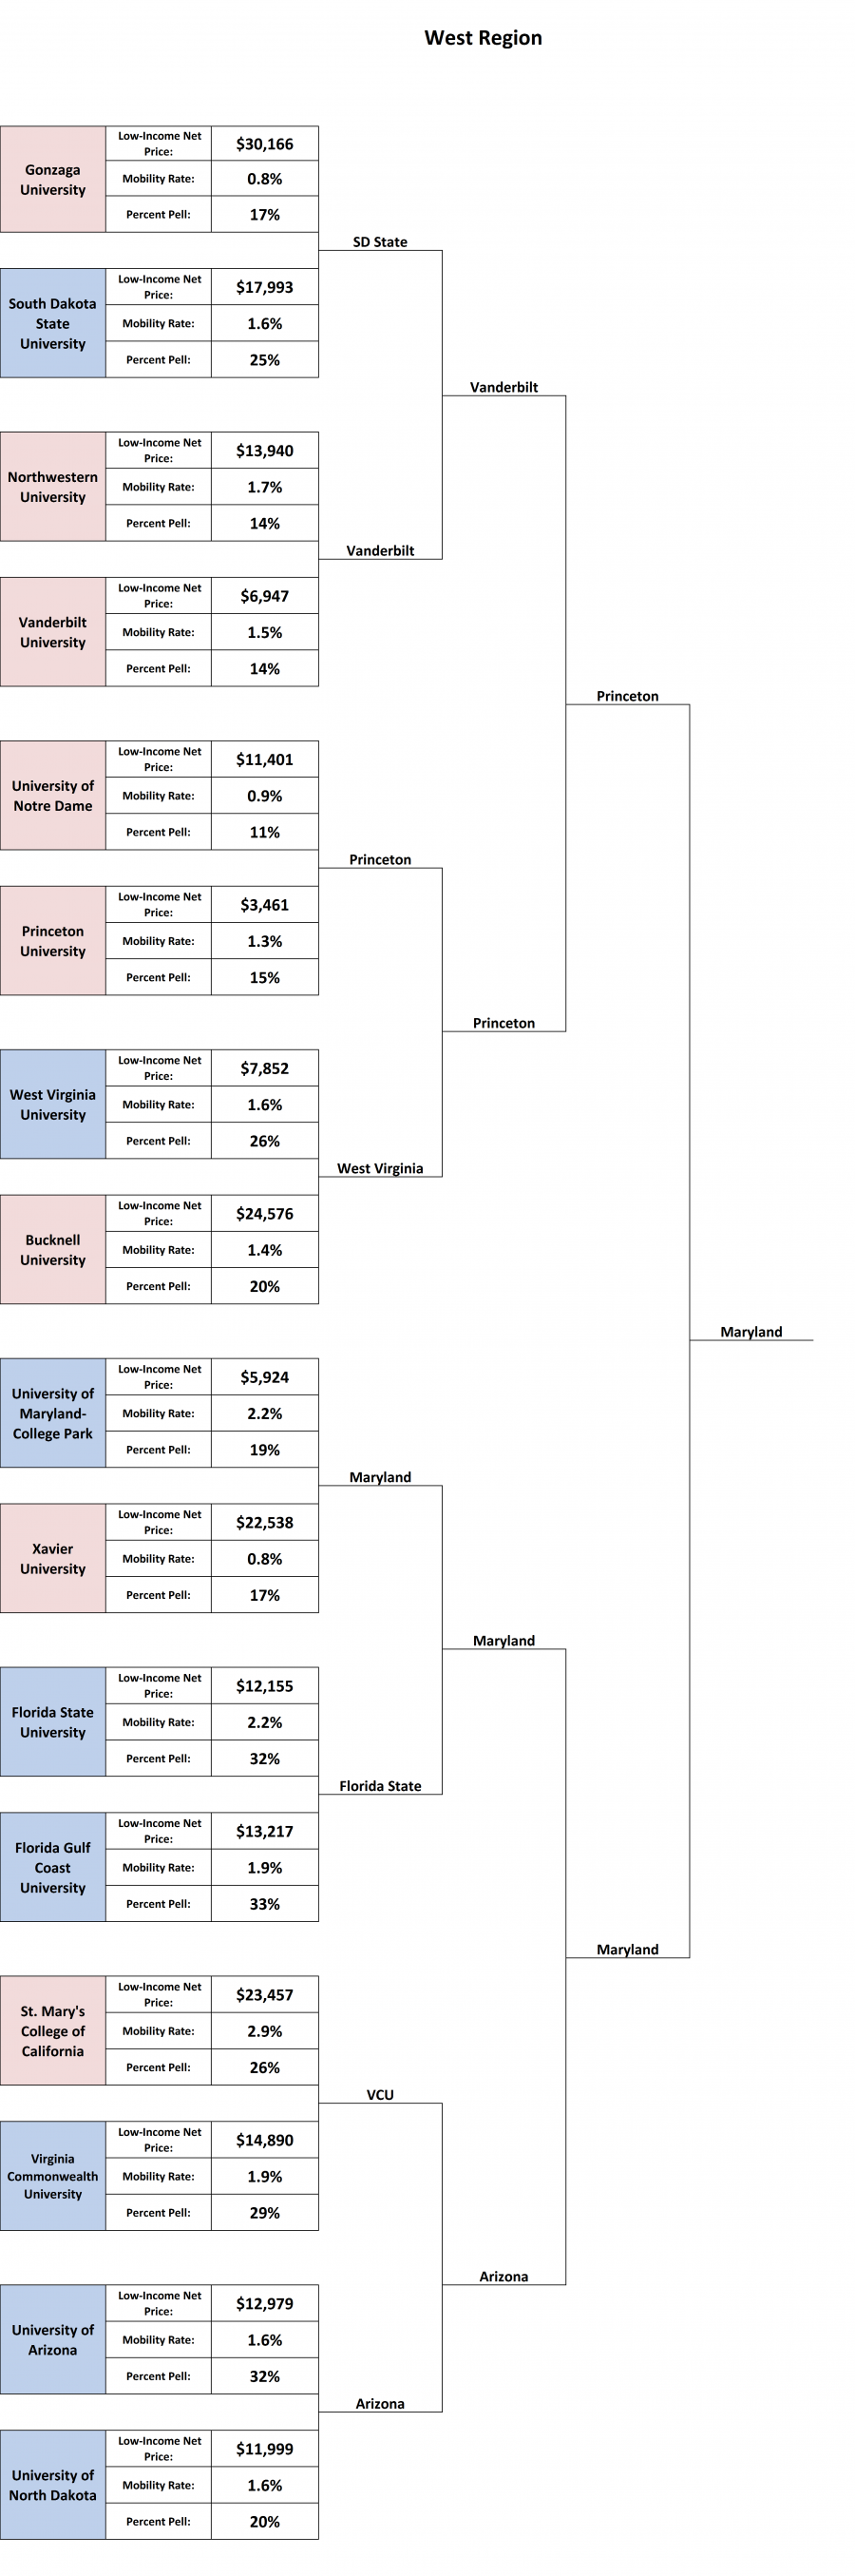
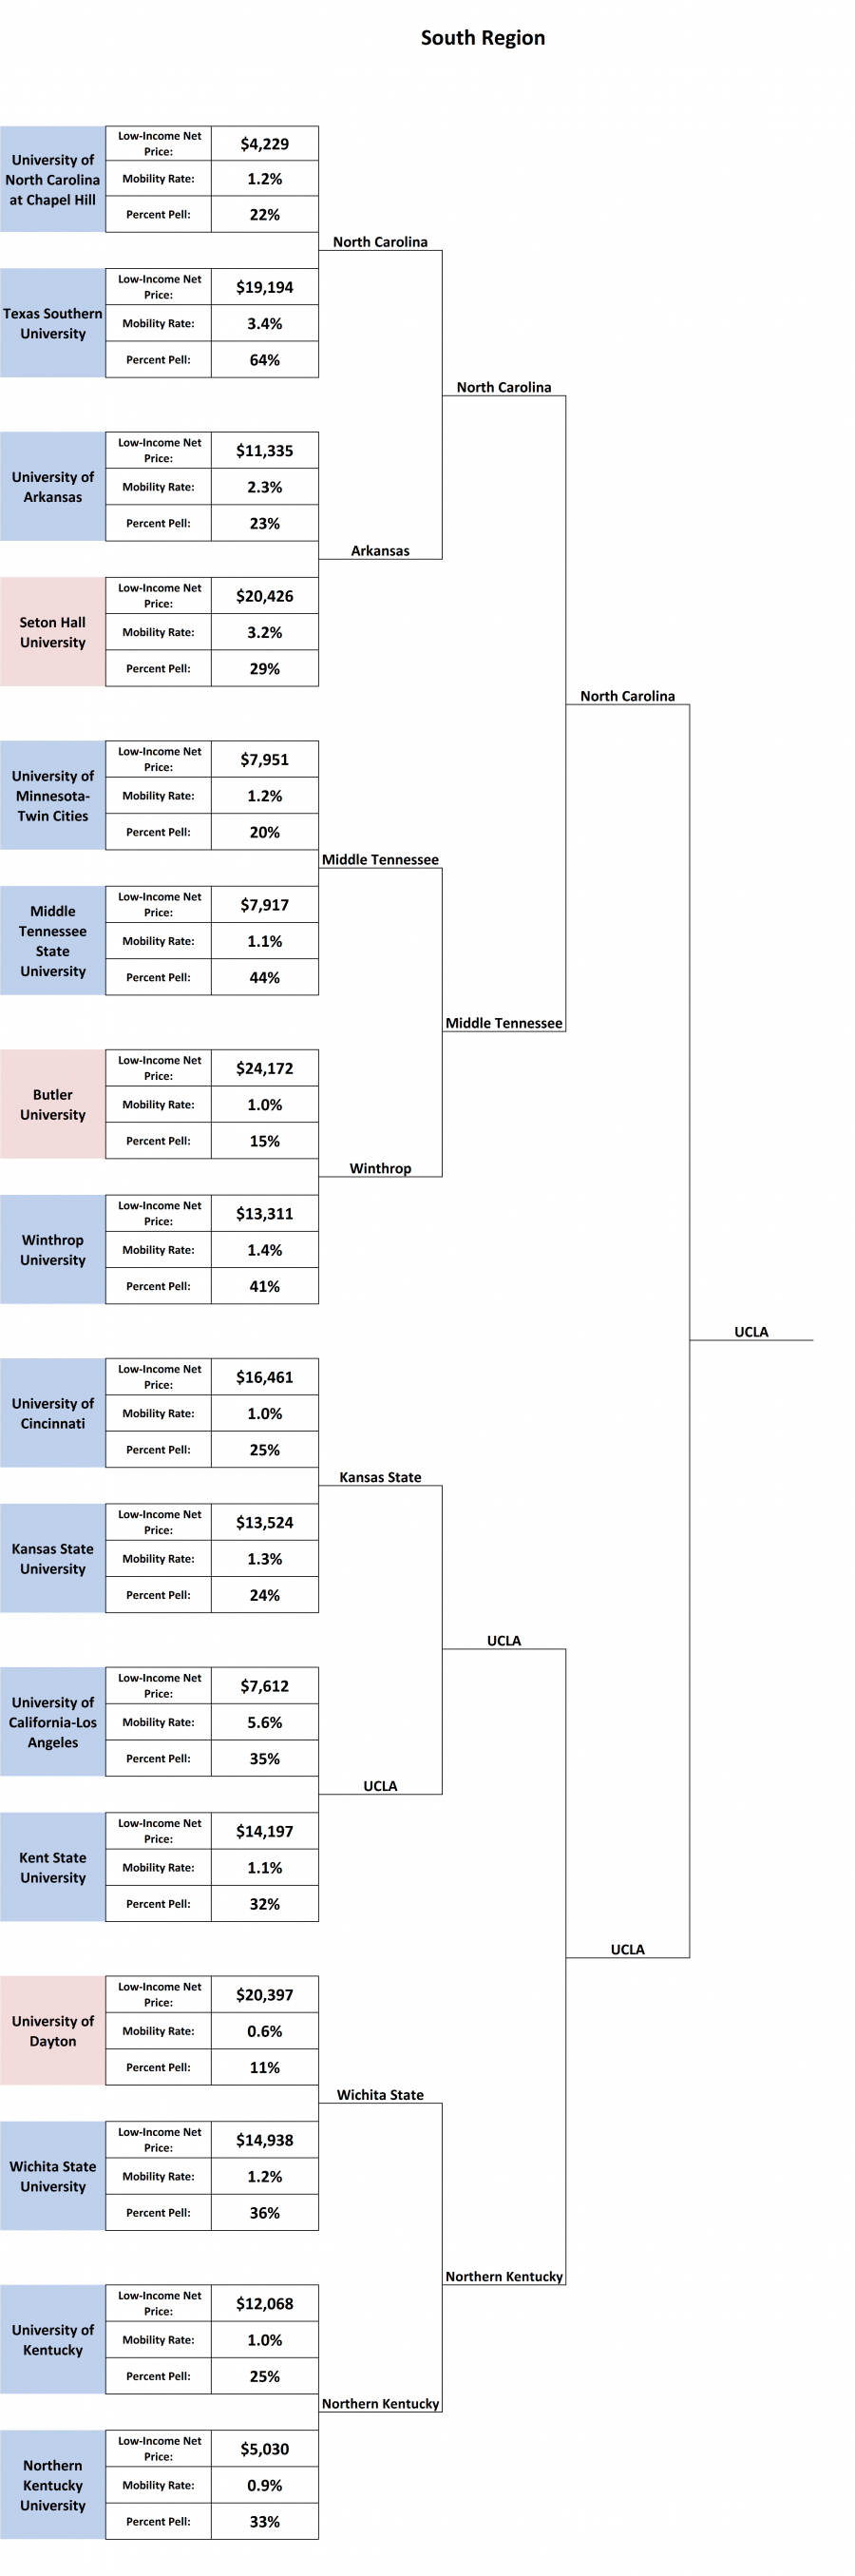
Without further ado, here is your March Madness of Affordability, Access, and Mobility. Public colleges are shaded in blue, and private colleges are shaded in pink.

Even though these colleges represent a small – and elite – slice of American higher education, this exercise demonstrates the massive variation in price and student body at each institution. Take tomorrow’s matchup between 3-seed Baylor and 14-seed New Mexico State. Low-income students at the private non-profit Baylor University face a net price of $28,000 annually compared to just under $8,000 at New Mexico State. New Mexico State’s percent of Pell Grant recipients, and mobility rate, are over twice that of Baylor’s as well.
Or take the matchup between two public institutions: Purdue and the University of Vermont. Purdue’s net price for low-income students hovers just under $4,500 compared to over $11,000 a year at Vermont, no doubt in part due to the dismal effort of funding public higher education by legislators in the Green Mountain State. Other colleges, like the University of Virginia and North Carolina-Wilmington, have similar net prices, but vastly different student bodies: UNC-Wilmington’s Pell Percentage is more than double that of UVA.
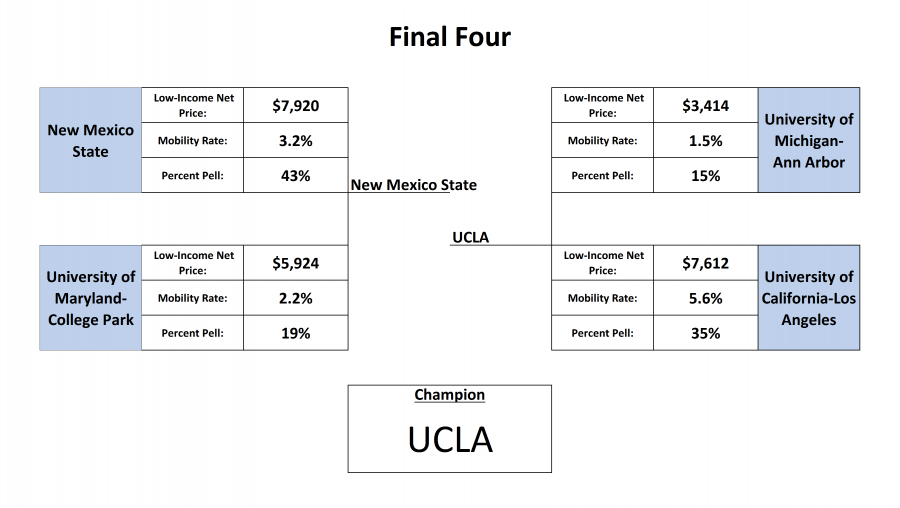
In the end, our Final Four featured four regionally diverse public institutions – New Mexico State, UCLA, the University of Michigan, and the University of Maryland (full disclosure: my alma mater). None of these institutions provide perfect opportunity – Michigan and Maryland, for example, could stand to enroll greater numbers of low-income students – but the combination of low prices and decent-to-good mobility scores guided them through the field.
And among this year’s participants, UCLA stands out. Their net price of $7,612, after grant and scholarship aid, is far more reasonable than many other institutions – and somewhat more palatable in a state with a $10.50 minimum wage, allowing student work to stretch a bit further. And no state system matches the University of California in enrolling Pell Grant recipients; over 1/3 of students at UCLA received Pell in 2014-15, compared to just 1 in 6 at Michigan. Finally, UCLA – like many of the public institutions in the Golden State – scores exceedingly well in terms of student economic mobility. Its 5.6% mobility rate was by far the highest in this year’s field. It seems that the California Master Plan is showing its worth, half a century on.
Congratulations to the Bruins, who incidentally might not be the worst pick on the court either given the play of freshman phenom Lonzo Ball. And to all the others who didn’t quite make it into the Field of 68 this year, there are other ways to show your worth – namely, how you contribute to making college accessible and affordable to those who need it the most.