Introduction
While many Americans continue to struggle with unemployment and financial distress in the aftermath of the Wall Street crisis of the late 2000s, it is increasingly recognized that these acute problems are symptomatic of deeper negative trends in our economy, decades in the making. Amid widening inequalities, little or no wage growth except for the most affluent, and rising fixed costs for education, health, and other key stepping stones for upward mobility, America’s once solid and expanding middle class is increasingly fragile and, for too many Americans, increasingly inaccessible. The financial meltdown only accelerated these trends, bringing new urgency to the challenge of restoring and expanding middle-class living standards in the twenty-first century economy.
The challenges facing ordinary working Americans are sharply etched in public opinion surveys, the news media, and everyday life in our communities, but our political leaders remain deeply divided about how to solve the problems. At the heart of this debate, there is a basic question: What is the role of government in our economy? Should government be doing more, or less, in a time of serious economic challenges?
On one side of this debate, an extreme anti-government view has taken hold, and leaders who embrace this view are working to radically reduce public investment, social spending, and regulatory oversight in our economy. In this view, big business and affluent households are considered the driving forces of prosperity, but they are victimized and weakened by taxes and regulation, causing the economy to falter.
On the other side of this debate, a more balanced approach is advocated, with a mix of public and private solutions designed to expand opportunity and develop needed resources for growth and prosperity. Central to this view is the need for robust public investment in important common assets, especially our workforce and families; our infrastructure, innovation, and education systems; and our health and natural environment. In other words, to rebuild and revitalize our private economy, we need to strengthen our public economy, by reinvesting in common needs. We also need sufficient regulation to limit risk in our economy and to reduce social costs in high-risk areas, such as the financial sector and the environment.
These major aspects of our public economy—reinvesting in common needs and reducing social risk and social costs—are not only vital for maintaining productive activities; in a competitive global economy where collective advantages are just as important as individual contributions, they are essential conditions for renewing American prosperity.
The importance of public economic contributions is evident in a number of fields, such as economic history, technology and innovation studies, and benefit-cost analysis. From these angles and others, it is easy to agree with the political economist Peter Evans’s assertion that “even a cursory acquaintance with U.S. history [reveals] the U.S. government’s central role in fostering the country’s exceptional economic growth….”
Or, as Warren Buffett put it, more broadly: “Society is responsible for a very significant percentage of what I’ve earned.”
The evidence behind these broad assertions points to the need for defining and measuring what might be termed our “public GDP.” Public GDP can be described in several ways—as value-added from government activities in our economy; as the economic yield of public investments, services, and regulation over time; or, more broadly, as public contributions to individual and social well-being. Critically, however, our national accounting system, centered on Gross Domestic Product (GDP) and other market measures, does not adequately capture the value of government, in any possible description. Public contributions are poorly measured or not measured at all; what sociologist Fred Block aptly terms the “invisible hand of government” is indeed mostly invisible in the way we measure economic growth.
As a result, we are ill-equipped to develop a public policy structure and growth strategy that aligns with what we know, in the broad evidence, about government’s positive economic role. More broadly, for lack of a full and accurate understanding of the public sources of economic growth and of relevant trends in the composition of growth, both public and private decision-making are increasingly ineffective even as our economic challenges intensify.
In this report, we introduce a new vantage point in the debate between austerity and reinvestment: the problem of unmeasured public value in our economy. At the heart of this problem, we assess the serious measurement problems surrounding government and why unmeasured public value is a significant barrier for policy development. We also discuss alternative measurement principles that can be implemented in our statistical agencies, and examine one key sector—education—as a focal point for measurement reforms. Demos offers this analysis because we believe that careful improvements in how we “account” for government—how we measure government activities and their economic value—are important for a more balanced debate about the role of government. Such improvements are also important for effective policy development and decision-making in a competitive global economy, where public contributions, properly measured, can make a very big difference in our economic performance and social outcomes. Finally, better measures of government output and its value can help us grasp, with more precision, potentially damaging tradeoffs between fiscal austerity and collective needs, between reducing government and investing in our people and society.
This report has four parts. First we outline the context for understanding why measuring public value is a critical issue today. Second, we outline a large body of evidence from several related fields that broadly supports the idea of a positive economic role for government and points to the need for improving how we measure government activity. Third, we provide a brief overview of the broader methodological critique of GDP and a more detailed examination of the particular problems with how we measure government activity. A first set of problems is evident in the very structure of GDP, creating a distorted perception of the sources of growth in our economy. A second set of problems originates in accounting principles that exclude non-market goods and services from our national product and wealth, not least public goods and services. Finally, as an example, we examine how national accounting falls short in the education sector, and we review leading ideas for improvements in this critical area. In conclusion, we offer four propositions on national accounting reform to guide a more robust public discussion of this issue, toward feasible changes in line with important emerging needs in our society.
I. Public Value and Political Divides
You Get What You Measure
From the Reagan years on, political leaders of all stripes have been rushing to proclaim, as Bill Clinton put it, that “the era of big government is over.” But as the evidence of the last three decades makes clear, the “free-market” alternatives—de-regulation, tax cuts for the wealthy, domestic spending cuts, trade liberalization, privatization—have not worked. Median earnings have stagnated and, for many workers, wages have fallen.
Personal saving has plummeted and economic insecurity has intensified, putting families at greater risk of falling out of the middle class.
Extreme inequalities of income and wealth are unraveling our social fabric and weakening our democracy.
We have lost our national competitive advantages in education, innovation, and infrastructure.
Fiscal problems loom even as federal revenue has fallen to 1950s’ levels.
Already, today’s young people, burdened with debt and struggling with high unemployment, may be the first generation in American history to be worse off than their parents were. On current wage, employment, and cost-of-living trends—not to mention potentially catastrophic trends such as climate change—future generations very likely will be worse off, perhaps dramatically so.
Whether looking at tax rates, regulation, public investment, or social assistance, it is hard to conclude that today’s economic challenges are due to excessive government involvement in our economy. In all of these areas, and in other key areas such as trade policy and labor law enforcement, government has either retreated significantly or failed to keep up with growing needs. A better explanation focuses, instead, precisely on the weakening of government support in these areas, which has debilitated our public economy as we’ve reduced social investment and failed to manage growing risks in our economy.
Current trajectories of social disinvestment and expanding social risk and social costs pose serious dangers for our economy in the medium- and long-term. Conversely, by many accounts of the highly socialized, “knowledge-based progress” we are likely to see in the twenty-first century, strengthening our public economy is the key to regaining competitive advantages and long-term prosperity in our society.
But in today’s polarizing conflict about the role of government, we seem to have lost sight of our public economy and are witnessing, instead, a downward spiral in living standards and national competitiveness.
Among the many factors that have shaped and often distorted the debate about government’s role in the economy, one that has not received enough attention is the issue of measurement. In fact, there are serious problems in how we measure our economy and particularly in how we measure government activity as part of our economy. Essentially, the way we calculate economic growth precludes accurate measurement, indeed any measurement, of the output and value of government activities. The budget, policy, and regulatory decisions that structure and finance our public economy are readily seen as spending choices and political choices, but we do not have the tools we need to measure the output of government in a way that is consistent with how we measure output in the private economy. The bottom line is that we measure what government is spending, and thus we know the cost of government, but we do not measure what government is producing, or the value of this production in its many forms.
For example, human capital, an output of families and the education sector (and also learning on the job), is nowhere reflected in our national accounting system, despite its centrality in nearly all contemporary models of economic growth. In one alternative accounting model, drawing on income, demographic, and educational data for the whole U.S. population, year-to-year estimates of human capital formation were calculated for the period between 1998 and 2009.
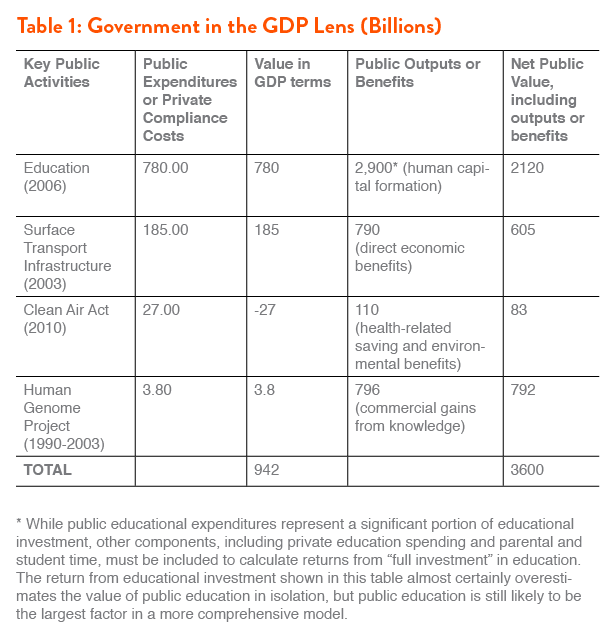
To take one year as an example, in 2009, human capital gains from educational investment added $3.7 trillion to our national wealth—equal to roughly 25 percent of GDP, more than double our gross private investment in structures and equipment, and more than four times larger than public educational expenditures as measured in GDP. In the competitive global economy of the twenty-first century, where human capital is the main source of growth and education is essential for upward mobility, a national accounting system that excludes our educational wealth and, effectively, about three quarters of our total national wealth, cannot be sufficient—whether for public understanding of the challenges we face or for policy development to revitalize our economy.
Other examples abound across our public economy. Take infrastructure: By one recent and very conservative estimate, individuals and businesses in the United States enjoy nearly $800 billion in direct economic benefits from our surface transportation infrastructure every year, compared to annual costs of $185 billion.
GDP may capture the value of these benefits in aggregate growth, but the value is a yield from public assets and more accurately and usefully measured as an output of government. Economic yields from public assets should not be measured as private consumption.
Likewise, regulatory controls contribute positively to our economy in many areas. By reducing loss of life, improving people’s health, instilling consumer, business, and investor confidence, and preserving large environmental support systems in communities and regions, among other things, regulation clearly contributes to economic and social welfare and should be measured in these terms. Indeed, one could argue that regulation is part of our wealth: we have regulatory “saving” along with other forms of saving. For example, in its first twenty years, from 1970 to 1990, the Clean Air Act contributed health savings and other benefits worth a mean estimate of $22 trillion, compared to compliance costs of $500 billion over the same period.
This is a large-scale impact, with a very high ratio of benefits to costs. It is also very large compared to other forms of saving: over the period from 1970 to 1990, we had $1.1 trillion in average annual regulatory saving due to cleaner air, compared to roughly $1 trillion annually in official national saving. In other words, our clean air saving alone in this period was roughly equal to our total national saving as measured in the national accounts. Yet, despite the obvious scale of the savings and the highly positive benefit-cost ratio, economic performance conventionally measured bears no trace of such regulatory value in our economy. Regulatory benefits are subsumed in aggregate growth and passively attributed to the workings of the free market.
Fixing GDP’s inadequate treatment of government brings significant challenges, mostly relating to quantifying the outputs and value of government activities in the absence of conventional volume units and market prices. But the status quo on this issue also has ideological and political roots, which have only grown deeper as the problem has become clearer. While our focus here is on the measurement issues and their significance for policy development, it is important to recognize how the problems surrounding public measurement are embedded in a larger political narrative about growth and progress. This problem, too, needs to be recognized and challenged as part of a broader strategy to renew and transform our economy.
As Paul Studenski noted in his landmark study of the history of national accounting, economic measurement has always been shaped by ideas about what is economically important, and sometimes by political objectives related to those ideas. In late eighteenth-century France, for example, the Physiocrats’ ideas about agrarian wealth and virtue fostered an economic model based on the extension and improvement of productive natural assets, which in turn stimulated important early developments in capital measurement.
In the more commercial English tradition that we have inherited in the United States, national accounting was shaped by another distinctive and still-recognizable theory, that of the “non-productivity of government.” As Studenski explains,
Toward the end of the eighteenth century...under the influence of the industrial revolution, a sudden revulsion took place in the political and economic thinking of the time. The entrepreneurial class, in its quest for freedom from restrictive governmental regulation, attacked the ability of government to attend to the economic affairs of its citizens. Political economists took the view that business enterprise was the sole productive agency in society and that government was a passive, nonproductive, wealth-destroying organization.
This idea has not only persisted, it has grown stronger in recent years. As Ronald Reagan famously put it in 1981, “Government is not the solution to our problem; government is the problem.” But the theory of government non-productivity, as Studenski could already assert with confidence more than seventy years ago, has not held up against the historical reality of “collective economic effort,” as he termed it. This was obvious in the many large areas that are subject to market failures or welfare-depleting inequalities, including public safety and health, and national security.
By the 1960s, as the idea of human capital took center stage in economics, it was also increasingly clear that government support for education, among other collective goods, was essential for economic growth and shared prosperity. But the way we measure growth was not adapted for these new economic realities, and so the non-productivity of government continued to be a prevalent theory.
As the ideas and agenda of public austerity push us away from a collective, human wealth-oriented economic model, we are turning our back not only on our past success but on our children’s future. Reducing government on the scale that some of our leaders are proposing could bring potentially huge, crippling tradeoffs in our economy as public investments shrink and collective risks expand. At such a crossroads, continuing to rely on an accounting system that ignores public output and other important non-market aspects of our economy is like “flying…without a compass,” as Joseph Stiglitz and Amartya Sen put it in the 2009 report of France’s Commission on the Measurement of Economic Performance and Social Progress. Clearly, real prosperity—shared and sustainable prosperity—cannot be reflected in, or guided by, market-output levels alone.
In a democracy, providing accurate information about the performance of our economy is a fundamental responsibility of government. It is also critically important for effective decision-making by our elected leaders and for holding them accountable if they support the wrong things. Ultimately, these considerations and the real-world challenges we face provide an urgent opportunity to take action on improving our national accounting system for the twenty-first century economy. At the core of this opportunity, the problem of unmeasured public value looms large as a focal point for concrete changes in national accounting and for improving our understanding of the sources of future prosperity.
II. Government, Growth, and Shared Prosperity
The Twentieth-Century Growth Miracle
The need to improve how we measure and value government activities is magnified by consistent findings in economic history, innovation studies, and other more technical fields such as growth accounting and benefit-cost analysis. There is plentiful evidence that government has played an important role in economic growth and rising living standards, but the way we measure government activity in the national accounting system does not equip us to improve regular decision-making in line with the large, positive effects that we’ve seen over time. From what we know about the long-term pattern connecting government growth and economic growth, there is much at stake in rectifying this problem.
In the twentieth century, the United States experienced a revolution in average living standards, becoming the world’s first predominantly middle-class country and a beacon of progress for the rest of the world. By the 1970s, average life expectancy had risen by 40 percent and average real wages had roughly tripled. Prosperity was broadly shared: in the high-growth decades after World War II, average wages rose nearly one-to-one with productivity gains and the size of the economy, and the poverty rate was essentially cut in half after 1950. Serious poverty and racial disparities remained, of course. But, in significant measure, America was living proof of a certain ideal way of life, marked by decent pay for solid work, security for raising a family, and a fair division of economic gains.
Another major change in the twentieth century was the growth of government, with public spending expanding from about 7 percent of the U.S. economy to roughly 35 percent. The parallel growth of government and the economy was not a coincidence. It is a consistent pattern in all advanced countries, and, indeed, no stable middle-class society has ever been established without a large, active (and democratic) public sector.
Moreover, contrary to free-market theories about the harmful economic effects of social spending, over the course of the twentieth century countries with larger public sectors have not had poorer growth performance than those with smaller public sectors. In his exhaustive study of the statistical evidence, Peter Lindert concludes that “the net national costs of social transfers, and of the taxes that finance them, are essentially zero.”
In other words, the welfare state is something close to a “free lunch,” bringing improvements in social well-being without compromising growth. This is the case in the larger welfare states because they tend to have a mix of taxes and spending that is well-designed for promoting growth and welfare together.
In contrast to today’s libertarian mythologies of heroic entrepreneurship and “supply side” job creation, public investment for economic development has been a staple of American policy since the founding era. Perhaps the earliest major example is the Louisiana Purchase in 1803, which added nearly 530 million acres to U.S. territory, doubling the size of the country and establishing the essential geographic conditions for large-scale economic development and an integrated national economy. As a share of GDP, the equivalent outlay today would be about $452 billion, or roughly what we spent on our entire federal social safety net in 2012. Continuing structural investment, including further territorial expansion and subsidized settlement (through the Homestead Act), as well as extensive public support for canal and railroad systems, agriculture, education, and technological innovation, catapulted the United States into the forefront of the global economy by the end of the nineteenth century. In 1820, U.S. GDP was $12.5 billion, compared to $38 billion for France, $26 billion for Germany, and $36 billion for Great Britain. By World War I, the U.S. economy was bigger than all three combined.
Looking at the decades after World War II, hundreds of examples of productive public investment and regulation would fill many volumes, in many areas. Transportation infrastructure, for example, has been vitally important. Leading economic historians such as Alexander Field and John Fernald argue that the strong productivity gains of the 1950s and 1960s were mainly generated from transportation infrastructure investments that began in 1930s.
As referenced in the Introduction, a recent state-of-the-art analysis by Robert Shapiro and Kevin Hassett, employing a very conservative methodology, finds a 4-to-1 benefit-cost ratio for our surface transportation infrastructure—nearly $800 billion annually in direct benefits for individuals and businesses, compared to $185 billion in public spending.
In large part, as well, environmental regulation and health and safety regulation have been beneficial for our economy over time. The twentieth century “mortality revolution,” bringing large gains in life expectancy and corresponding productivity gains and output growth, was largely the result of public sanitation systems, public health rules, and vaccination programs that reduced or eliminated infectious diseases.
Environmental regulation for cleaner air and water has generated benefits over costs at very high rates.
So, too, government-funded research in agriculture, health, industrial materials, and information technology was indispensable for technological development in those fields. Eighteen of the twenty-five most important breakthroughs in computer technology between 1950 and 1962, for example, were funded by the federal government, and often the first buyer of the new technology was also the government.
The Apollo Space Program of the 1960s created the original markets for solid-state circuitry, and the Defense Department-origins of the internet are well-known.
In 2006, 77 out of R & D Magazine’s 88 award-winning innovations in the United States (awarded to commercially developed innovations) were supported by federal research investments.
A Case Study in Public Investment and Market Returns: The Human Genome Project
In 1990, the U.S. government launched the Human Genome Project, a scientific research program coordinated by the Department of Energy and the National Institutes of Health with the aim of decoding the entire human genome. According to a major study by the Battelle Memorial Institute, the Human Genome Project’s total public investment of $3.8 billion over more than a decade has generated over $796 billion in economic gains, not least by providing the chief intellectual capital for the emerging industry of genomics. In 2010 alone, this investment returned $20 billion in personal income for American families, 310,000 public and private sector jobs, and GDP growth of $67 billion. In fact, the tax revenues generated by the genomics industry in 2010 surpassed the value of the entire 13-year investment in the project. Overall, the project has returned $140 for every $1 invested by the public. Along with such market returns, perhaps even more important are the potential social returns, as advances in genetic knowledge contribute to other fields of activity with potentially large impacts on human welfare, such as renewable energy and nutrition.
From Case Studies to Aggregate Measures
Economic history, public policy history, and programmatic case studies have contributed to a general understanding that government can play a positive role in the economy. Increasingly, policy-makers rely on case studies, using benefit-cost analysis and other accounting tools to assess the “net value” of particular programs and regulations. But we know less about the impacts of broader public sectors such as education, health, and the environment, which are poorly reflected in aggregate measures yet far too complex for standard benefit-cost analysis. At this more aggregated sectoral level, we will depend on improvements in our national accounting system.
Comparative advantages in the twenty-first century economy will significantly depend on the health of our public economy, determined by how we invest in common assets and reduce collective risks. For our national accounting system, the heart of the issue is measuring our public economy in a way that is consistent with how we measure the private economy. Such consistency is necessary for effective policy development in relation to public sources of growth. By these criteria, we are not so much transforming a core government function as adapting it for new national needs: Just as GDP provided critical information for developing one set of policy tools in an earlier stage of our economic development—in particular around the business cycle—we need to adapt our national accounting system for the very different policy challenges we face in the twenty-first century. If nothing else, providing accurate information about our economy is a vital public service for a better-informed citizenry. But the stakes are much higher, of course, if improving economic performance is considered a public responsibility as well.
III. Measuring Public Growth
Beyond GDP and Public GDP
The focus on public value is part of a broader rethinking of how we measure economic performance in our national accounting system, and this broader critique helps to illuminate why the public measurement issues are increasingly salient today.
For decades now we have relied on Gross Domestic Product (GDP) and related measures of market output to gauge the health of our national economy, and, more and more, GDP growth has become the main barometer for measuring our progress as a nation and the success of our political leaders. But as Nobel-laureates Joseph Stiglitz and Amartya Sen write in their seminal report, noted above, the “information contained in the aggregate GDP data” has long been diverging from “what counts for common people’s well-being.”
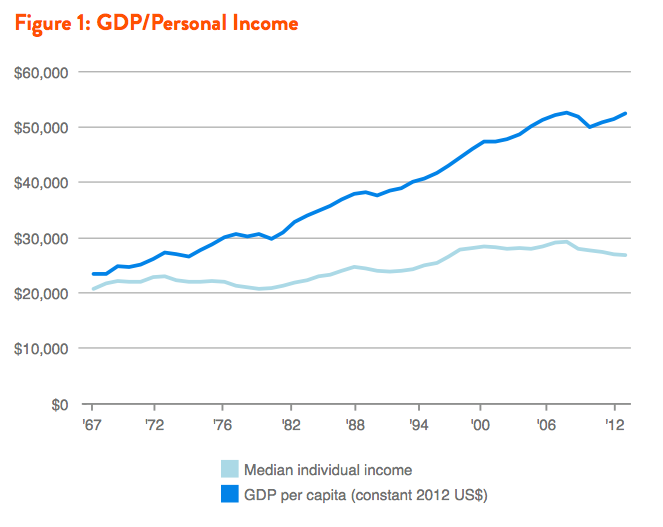
Indeed, since 1980, GDP has more than doubled and the richest Americans more than doubled their share of national income, but median personal income was basically flat and the gap between personal income growth and GDP growth steadily widened, as shown in Figure 1.
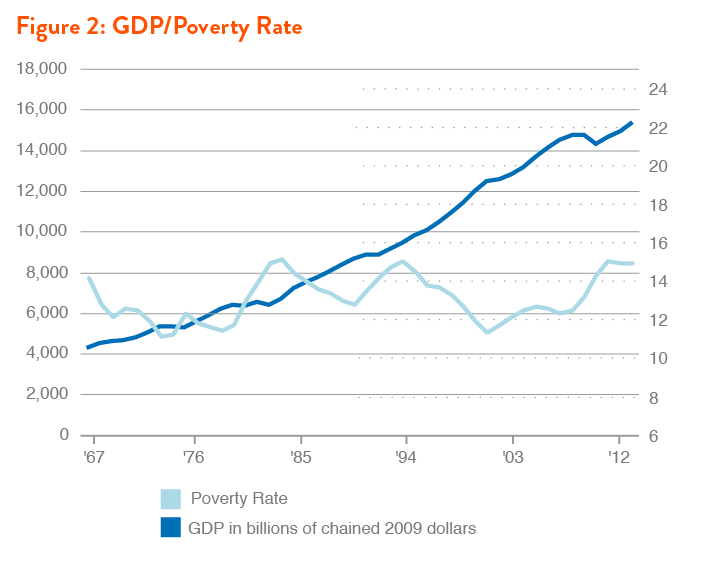
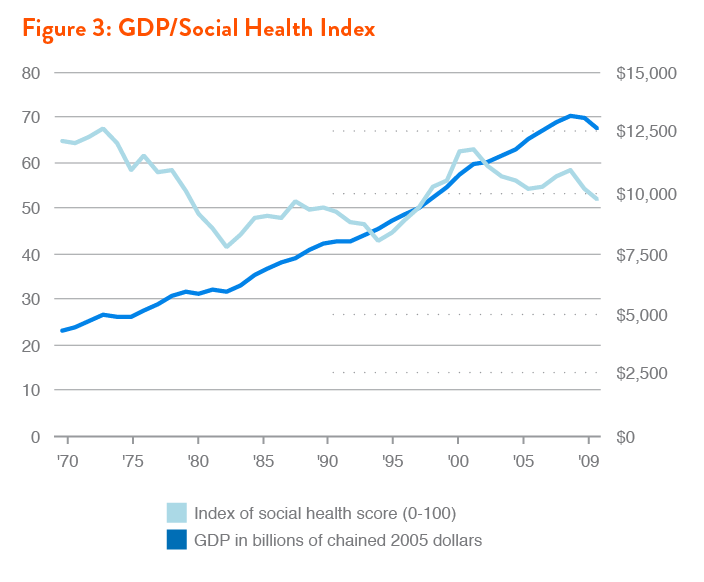
Poverty and other social welfare indicators have not improved with GDP growth, as seen in Figures 2-3.
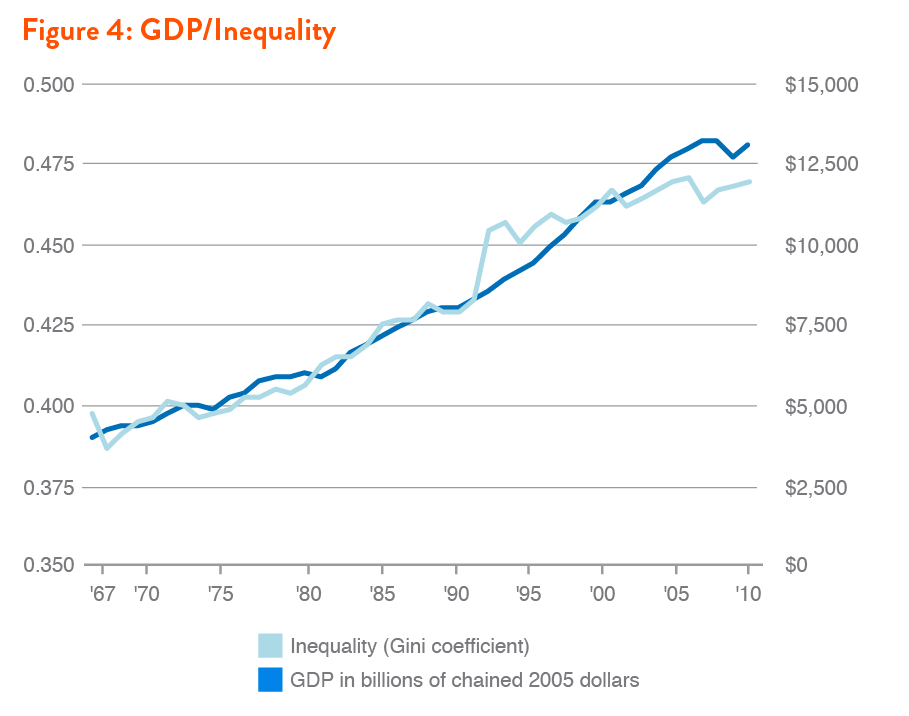
Inequality, however, tracks nearly perfectly with GDP growth over the last several decades, reaching record levels in the early 2010s, as indicated in Figure 4.
Experts working to improve our national accounting system have often focused on social welfare costs, environmental costs, and other economic “negatives,” but today the focus is expanding to include unmeasured positive aspects of our economy—positive because they contribute to social well-being and long-run growth, unmeasured because they are transacted outside of the marketplace, without any prices to be counted as “output” in the GDP framework. Key aspects of the positive “non-market” economy include household production (unpaid childcare, preparing meals, etc.) and charitable services. In these areas, goods and services are produced, often heavily subsidizing the market economy, but they are not measured as part of national production. The scale of non-market production is not small: In one recent estimate from the Bureau of Economic Analysis, household production alone was equal to 39 percent of GDP in 1965, and a still substantial 26 percent in 2010.
If some non-market sectors, like household production, might be considered part of our social economy, other non-market sectors are largely or entirely public in nature, because they are publicly financed, heavily regulated, or both. These sectors, including education, health, infrastructure, social services, and the environment, comprise a distinctive public economy, which is functioning and adding value, in part or in whole, outside of the GDP framework. Together, these public sectors play a significant role in long-run growth, without being measured as part of growth. As a result, large-order aspects of our economy and our long-run growth, accounting for “a very large portion of the growth in living standards,” as one major study asserts, are not well-integrated, conceptually or empirically, in economic policy or in other policy areas that rely on quantification and valuation of economic benefits.
More broadly, such a limited view of our economy distorts how we evaluate progress and judge political leadership, thereby restricting the development of alternative policy approaches.
In its many dimensions, our public economy—the non-market sectors with large public components—is very poorly measured in our national accounting system. In Table 1, a rough accounting of several major public activities sets into relief the question of public value in our overall economy. In the GDP lens, government literally adds no value beyond what government spends, and every public dollar has the same rate of return in our economy: 0.0%. Yet, juxtaposed with non-market output measures for public activities, the value of government begins to look very different.
We examine the valuation problems surrounding key public sectors in more detail below, focusing on education. Yet the broad implications and the practical significance should be clear up front: In a competitive global economy where success increasingly depends on building human and social capital along with reducing large collective risks, improving how we measure public contributions in these areas is essential for generating the kind of comparative advantages we need.
Nothing is more contentious today than government’s role in the economy, yet no part of our economic system is so obscure in the conventional growth measures. While some argue that radical reductions of government are needed to save the economy, and others argue the opposite, there is little evidence for either point of view in our standard measures of economic performance. Without improvements in this area, a large part of the debate about government’s role in the economy can only be speculative, ideological, or worse. Perhaps all sides can agree, therefore, that such improvements are an important step forward in confronting our economic challenges, whatever the answers may be.
GDP’s Category Problems: Private vs. Social Consumption
We turn now to examine the problem of unmeasured public value in more detail. As noted in the Introduction, GDP’s measurement of the public sector has two kinds of problems. One set of problems is reflected directly in the GDP tables and has to do with how different economic activities are categorized as part of GDP. The result is a distorted understanding of the structure of our economy and the relative importance of public and private contributions.* The other set of problems, more difficult, has to do with how government activity is measured and valued as part of our economy. In what follows, we start with the category problems and then turn to the measurement problems.
Essentially, the GDP structure obscures important trends in the composition of economic growth. In our national accounts, Gross Domestic Product measures the output of the economy in four basic dimensions: consumption (C), plus private investment (I), plus government spending (G), plus net exports (NX). So, GDP is equal to C + I + G + NX. “Consumption” refers to personal consumption expenditures for market goods and services, or “PCE”; “Investment” is gross spending by firms on capital equipment and structures, as well as residential and equipment investment for the rental market; “Government” refers to federal and state and local spending on goods and services and gross public investment in equipment and structures; “Net exports” is exported goods and services minus imported goods and services. Table 2 illustrates the basic structure of GDP, with totals for year 2011.
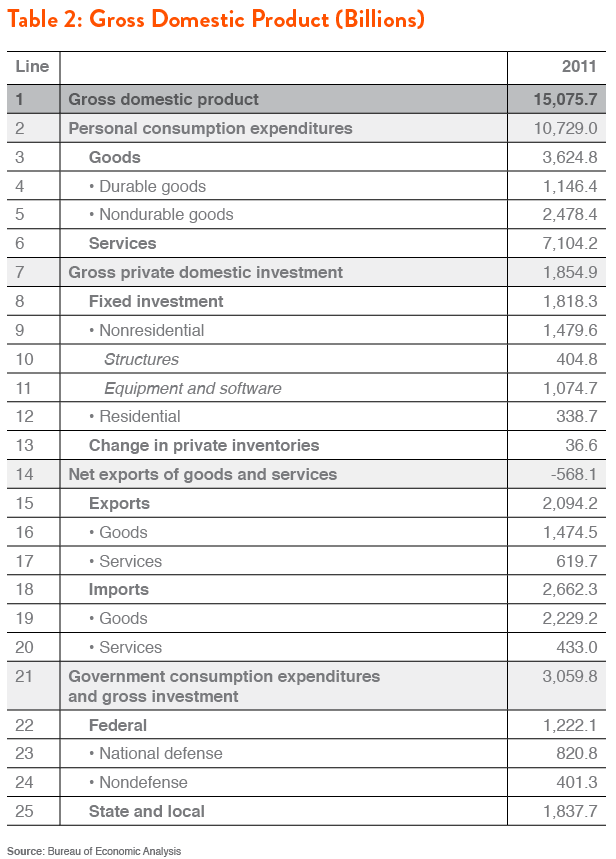
Social transfers are not directly measured in GDP, a problem we turn to below. Total government spending at all levels, including social transfers, is equal to roughly 36 percent of GDP today, while total government consumption and investment is about 20 percent. It is important to understand the difference between government spending that counts for GDP (20 percent) and total government spending as “a share of,” meaning relative to, GDP (36 percent). The difference between them is essentially the cost of social transfers.
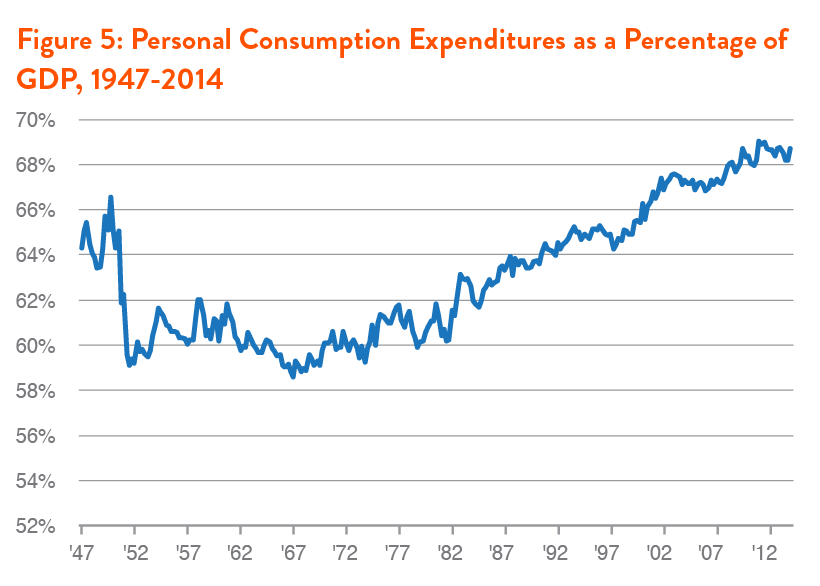
The frequently heard notion that “two-thirds” or “70 percent” of our economy depends on personal consumption encapsulates what might be called GDP’s “category problems.” In the GDP framework, personal consumption has long been the largest single category of activity, with small up-and-down variations year-to-year but climbing steadily since the early 1950s and peaking at 71 percent of GDP in 2010, as seen in Figure 5.
The first category problem with GDP, as mentioned above, is that government spending on social transfers is not counted directly, even though this public spending—Medicare and Medicaid payments, Social Security payments, veterans’ benefits, food stamps, unemployment benefits, student aid, etc.—heavily subsidizes personal consumption and raises the level of GDP. In the GDP method, public benefits are not directly counted because these expenditures are “transfers,” where the flow of resources does not contribute directly to output. The non-productive “transfer” concept clearly is problematic in the case of public health care benefits, which flow directly from government to medical providers on behalf of individuals. One could argue that the pay-go financing system of Medicare benefits, with significant redistributive effects within the population at a given time and across generations, necessarily defines such spending, on the whole, as a social transfer system. Over a lifetime, the average two-earner couple in 2010 was expected to receive $351,000 in Medicare benefits, while only paying $116,000 in Medicare taxes, according to one widely discussed study.
But, clearly, the flow of resources in such a system, however redistributive, contributes directly to the economy and is essential for the economic well-being of elder households. The key difference is that the consumption is not private. It is structured by legislation, protected by public agreement, and heavily subsidized by government. Clearly, it is public consumption more than private consumption.
“Transfer receipts” totaled $2.3 trillion or about 21 percent of PCE in 2011. Most of the value of these public benefits is spent, not saved, and so ends up in PCE, disappearing into the “70 percent” of GDP that depends on “consumer spending” in our prevailing narrative. The net output of non-profit groups serving households, nearly $300 billion in 2011, is also counted in PCE, insensibly. Netting out the value of social transfers and charitable services reduces personal consumption in the form of direct household expenditures to 50 percent of the economy, not 70 percent. Conversely, adding social transfers and charitable services to government consumption—under a concept of public or social consumption—pushes the public share of GDP (including direct government spending) from 20 percent to roughly 40 percent. It should also be noted that a significant percentage of PCE consists of consumption financed by government salaries, but public salaries are counted as government consumption in the GDP framework. Public salaries totaled $1.5 trillion in 2011, equal to roughly 14 percent of personal consumption that year. Assuming that government employees, like private employees, consume most of their earnings, here, again, we are led to question the idea that “personal consumption,” in the conventionally perceived sense of private spending from private earnings, is a two-thirds share of our economy and the key to economic success.
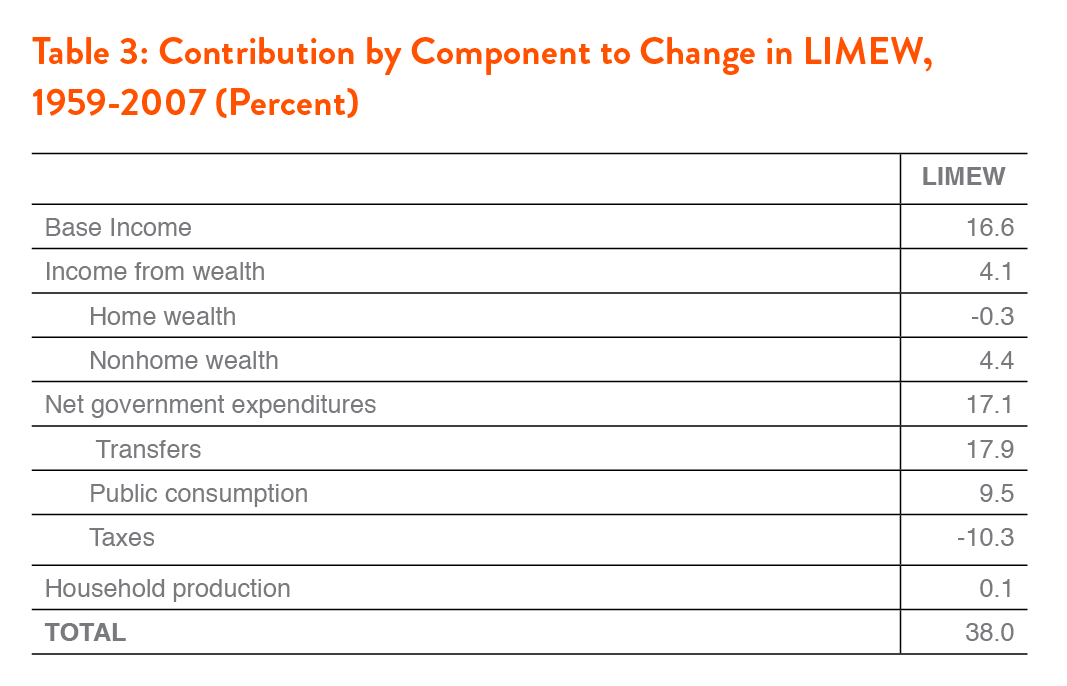
Among other approaches, models of “extended income” help to illuminate large effects of social income growth at the household level. The Levy Institute’s Measure of Economic Well-Being (LIMEW), for example, includes the household-level value of social transfers as well as public services used directly by individuals (education, water supply, sanitation, etc.), net of taxes. LIMEW estimates show that, for the middle quintile of households, public expenditures were the single largest contributor to economic well-being gains between 1959 and 2007, responsible for nearly half of the total well-being growth of 38 percent over the period, with most of the rest coming from market income gains.
GDP’s picture of private, consumer-driven growth is misleading in another important way as well, namely, by including the cost of import-content in personal consumption. When someone in the United States pays $500 for an Apple iPhone, $500 is added to personal consumption in GDP even though roughly $180 of that spending supports production in China and other countries, not in the United States. Overall, including intermediate imports such as crude oil, roughly 14 percent of U.S. personal consumption supports production in other countries.
To be clear, GDP has a net export measure that subtracts the value of imports from total output, properly adjusting the level of GDP. But by including the overseas production share of U.S. consumption in PCE, GDP again distorts our understanding of the structure of our economy and the sources of growth. In sum, not all personal consumption is private market consumption—much of it is effectively public consumption; and not all personal consumption in GDP contributes to the U.S. economy—a significant fraction supports other countries’ growth.
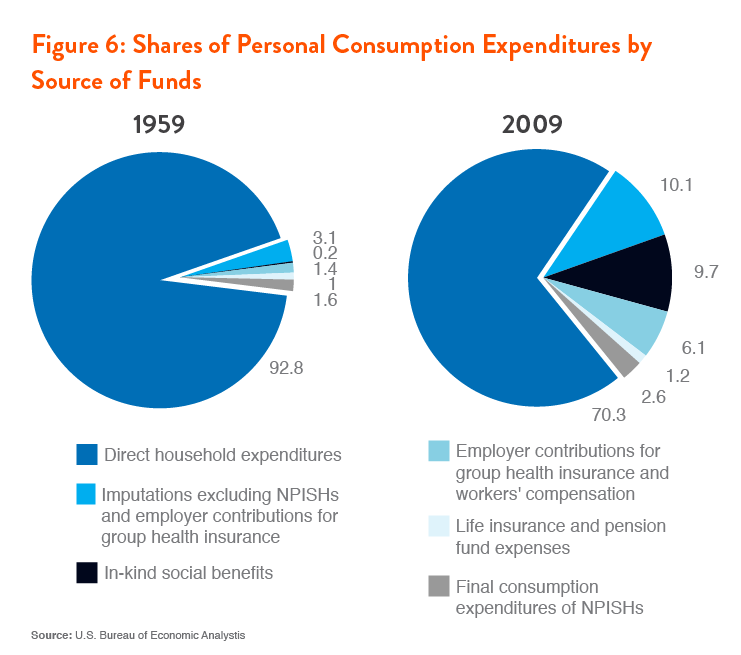
In one summary analysis, 30 percent of PCE in 2009 was comprised of what the author termed “indirect expenditures”—including expenditures funded by government and employers (health care premiums), non-profit expenditures for services provided to households (net of sales to households), imputed income from owner-occupied housing, and other spending not contributed directly by households.
Thus, in 2009 direct household consumption from wages was only 48 percent of GDP, not 69 percent, as the story is usually told. As seen in Figure 6, moreover, the indirect share of personal consumption has quadrupled since 1959.
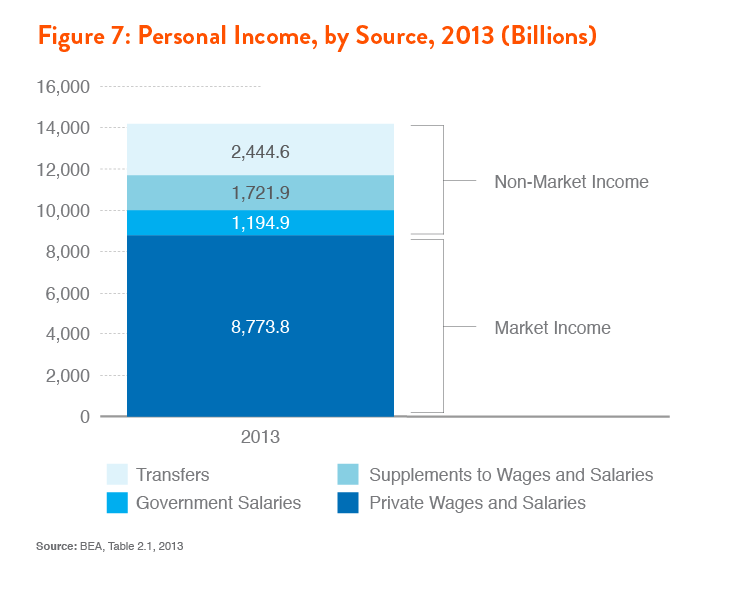
Another approach looks at the share of personal income that comes from non-market money-income sources, including government salaries, social transfers to individuals, and employer-provided benefits. In 2013, the non-market share of total personal income was approximately 38 percent, as seen in Figure 7.
The structure of our economy and the sources of growth look very different in light of these distinctions, much more balanced between public and private contributions. This is clearly important for understanding government’s role and measuring government impacts both from a household perspective and from a pro-growth perspective that includes the public economy, but it is also important from other perspectives, such as inequality. According to an estimate for 2007, including social transfers in household income reduces the level of inequality in the United States by more than 18 percent compared to a measure of market inequality.
Thus, the public share of personal consumption is not just a question of the sources of growth. It is also a question of the role of government in achieving a more equal society. Notably, social transfers in many European countries reduce inequality by much larger margins.
Measuring and Valuing Government Output
GDP’s category problems help to create a distorted image of our economy as a largely private system without a public structure or public sources of growth. Yet, when it comes to the role of government, even the deep confusions of GDP are overshadowed by the exclusions. Essentially, GDP excludes any notion of public value related to public costs. This is rooted in the simplifying—yet increasingly obsolete—assumption that value requires a market price. Of course, most public goods and services, such as public education, are provided for free or for nominal fees. Thus, their value in GDP, which only captures the value of purchased goods and services, can only be measured at the cost of the various inputs for the service, for example teacher salaries. This is the problem we have emphasized—that GDP growth only captures what governments spend, not what they produce.
To understand how limited this is, we need to recognize GDP’s core principle of counting final consumption only, not intermediate inputs. This approach makes sense for the private economy, but it cannot be accurately applied in measuring the public economy. For example, GDP does not include the timber purchases of the American Furniture Company, because this would be “double counting,” since the timber costs are already included in the price of the company’s furniture products. In contrast, GDP only measures government’s intermediate consumption, that is, what it spends on inputs for its production of goods and services. For example, if government spends money to implement an effective program for reintegrating ex-prisoners into their communities, GDP counts the program’s input costs (mainly labor costs), but not the program’s outputs—amount of services provided and the number of prisoners enrolled—or the program’s outcomes in the form of reduced recidivism and the social and economic benefits that derive from successful participation in the program. Or take an example of government investment in infrastructure: If a government finances construction of a bridge across a river, the cost of building the bridge is counted in GDP, but the value of the bridge, in terms of greatly reduced transportation costs and more commercial activity, is not counted as a government contribution to the economy. Perhaps most significantly, counting education and health spending as government consumption or as personal consumption through a social transfer clearly misses the mark economically. Considered economically, spending on the education and health of our population is clearly a form of investment in human capital, generating private and social returns that may exceed or far exceed the input costs.
Measuring government output at the cost of inputs creates two major problems for public policy. The first is about the efficiency of government. In the private economy, inputs and outputs both have prices and both are measured in the national accounts. As a result, we are able to calculate the productivity of market sectors by measuring inputs against outputs. Lacking output values for government, we cannot measure changes in the productivity of public services. Relative to volumes of inputs (teacher work-hours), or relative to government costs (teacher salaries), we do not know if we are getting more or less output from public education systems, whether quantitatively (numbers of students educated), qualitatively (levels of student performance), or in terms of socioeconomic outcomes (economic and social returns from educational attainment). As the National Research Council’s Panel to Study the Design of Non-market Accounts put it, developing “measures of the output of the government sector that are independent of the inputs...is essential to confronting a number of basic research questions,” such as: “What is the return on capital investment by the government [including human capital investment]? What is the return on government-supported research and development? Are government workers growing more or less productive over time? Do government enterprises—such as utilities, airports, transit services, schools, and hospitals—operate efficiently?”
The United Kingdom’s Atkinson Review is the most comprehensive effort to develop new measurement principles for national accounting of public goods and services (the report is named after its principle researcher, the economist Anthony Atkinson).
The main focus of the Atkinson Review is developing principles for measuring the output of government services independently of measured inputs.
Given significant public concern about the efficiency of its large national services, such as the National Health Service, it is natural that U.K. leaders would emphasize output measures. But, from a standpoint of long-term prosperity, the most important need is to measure outcomes (social results), not just outputs (what government spends money on to generate the outcomes). Wherever possible, moreover, we should be measuring the economic and social welfare outcomes, particularly where government spending is clearly (or potentially) a valuable form of investment, as with education, health, infrastructure, and research. Yet we are ill-equipped to measure public value in a way that is consistent with how we measure private value. As a result, a significant portion (exponentially significant, by some estimates) of valuable output, particularly in the form of non-market capital development, is obscured by or excluded from our measured growth and, more to the point, from the measurable landscape of public policy.
Further, in some areas of our public economy, most notably the environment, national accounting is limited by the lack of a common framework for measuring regulatory contributions to growth and economic welfare. Similar issues arise with financial regulation, public health regulation, consumer protection, and workplace safety, yet it is clear from many case studies that regulation in these areas and others often generates net gains in our economy by reducing social costs, improving human welfare, and even spurring valuable innovation over and above the private costs of regulatory compliance. While we do not focus here on this problem—what might be termed the problem of unmeasured regulatory value in our economy—we offer some initial thoughts on an alternative approach in our conclusion.
IV. Beyond GDP: Education
A Human Capital Century
Education has been a major focal point in the study of economic growth since the 1960s, beginning with the development of human capital theory by Gary Becker and Theodore Schultz, among others. Human capital consists of the skills, knowledge, and ideas acquired by individuals in various stages of their lives, from early childhood, through formal education, through learning on the job. These aspects of a person are considered to be a form of capital because they yield economic returns over a life-time. In his pioneering econometric studies drawing on data from the 1950 and 1960 Censuses, Jacob Mincer found that an additional year of education yielded personal lifetime income gains of 5-10 percent, and today the consensus range is roughly 8-13 percent, with greater yields from additional education at the post-secondary level. Mincer’s formulations for relating educational attainment to personal income gains remain foundational for human capital measurement today. A second body of work on human capital focuses on the macroeconomic effects of education, or how increasing educational attainment in a population affects regional or national development through various kinds of social spillover effects. In general, private returns have been easier to measure and found to be larger than social returns, at least in advanced countries. A third body of work focuses on the returns from educational advance in various dimensions of social welfare, including reductions in crime and social dependency, reduced public health costs, and more civic engagement.
While the idea of human capital is traceable as far back as Adam Smith’s The Wealth of Nations and Thomas Jefferson’s early vision for a national education system, human capital measurement did not become a major concern in economics until the 1950s and 1960s, during the advent of modern economic growth theory and empirical studies of growth. At that time, growth was conventionally understood to be driven by increasing labor inputs (population growth) and physical capital inputs (more machines), but this view was challenged by empirical data revealing large gaps between inputs (conventionally defined) and outputs. In Robert Solow’s pioneering, Nobel Prize-winning studies of the 1950s, the output gap (which came to be known as the “Solow residual”) was more than 80 percent, meaning that 80 percent of growth was essentially unexplained by the conventional model of labor and capital inputs. Human capital theory helped to answer the challenge of unexplained growth, and education became a primary focus in economics; consequently, a new set of challenges arose with various measurement issues related to human capital and the economics of education.
It is no surprise that U.S. economists led the way in human capital theory and measurement. In fact, long before the economists began to pay attention, federal, state, and local policies in the United States already reflected an economic understanding of education, along with a democratic understanding. As Harvard economists Claudia Goldin and Lawrence Katz exhaustively document in their widely-discussed book The Race Between Education and Technology, more than any other country, the United States invested early and generously in primary and secondary education, with a public, universal approach that created the world’s best-educated workforce by the middle of the twentieth century. We also invested in a world-class higher-education system, which remains the highest quality post-secondary system in the world, although other countries rapidly caught up in the last few decades and today some have surpassed the United States in college graduation rates as well as education quality.
America’s educational investments paid off in the twentieth century. Very conservatively, Goldin and Katz find that increased educational attainment in the U.S. population was responsible for 15 percent of real per capita income growth in the period from 1915 to 2005, without even accounting for the social spillovers from education.
By comparison, education spending, most of which is public spending, averaged roughly 5 to 7 percent of GDP in the second half of the twentieth century, when free K-12 schooling became the national norm. At more than double the rate of education spending, education’s contribution to income growth appears to represent a substantial case of positive returns from public investment. Related research suggests even larger returns. In his notable 1999 study “Measuring Labor’s Share,” Alan Krueger found that, by the mid-1990s, most labor income, and more than two-thirds of national income, was due to advances in the human capital of the workforce, including formal education and learning from work experience.
Looking at productivity gains, Charles Jones estimates that approximately 80 percent of output growth per worker between 1950 and 1993 was attributable to a combination of education gains (30 percent) and investments in research (50 percent).
Clearly, while these estimates vary widely, there is little doubt that a significant part of economic growth and rising living standards has depended on investments in education and ideas, with a large share coming from government. Thus, integrating human capital measurement into our national accounting system is likely to be important for developing effective growth strategies and related policy ideas in the future.
Education Capital in the National Accounting System
A leading proposal put forward by the National Research Council’s Panel to Study the Design of Nonmarket Accounts recommends implementation of a supplemental or “satellite” account for the education sector. This could be an important information source, the Panel noted, for generating a more complete picture of the inputs and outputs of educational investment, and in turn a better understanding of how education contributes to our economy over time.
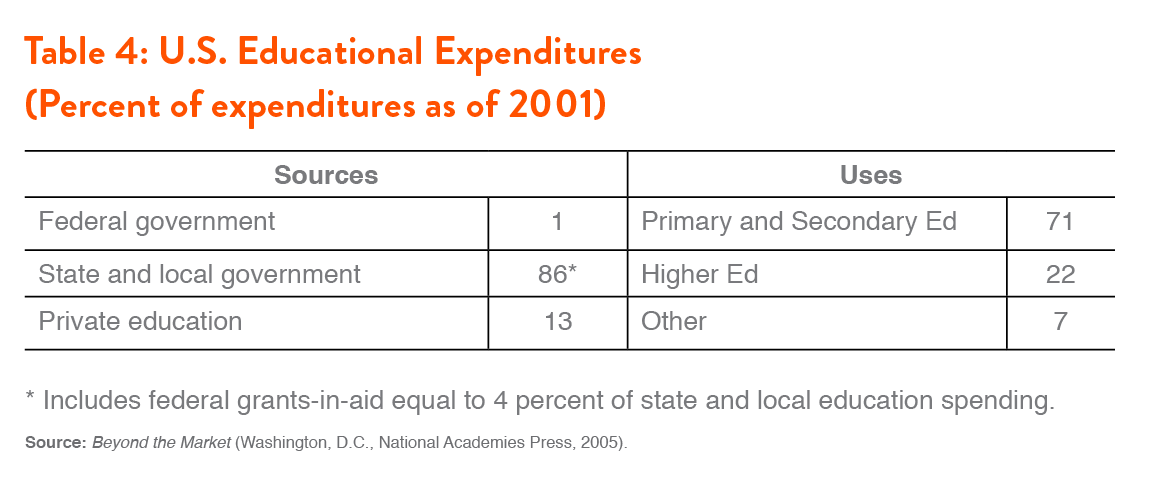
In the GDP framework, the value of the education sector is equal to the sum of public and private expenditures on education services. Measured in this way, the education sector contributed roughly 6-7 percent of GDP in the 2000s, with largely public sources and uses, broken down in Table 4.
Working from this expenditure baseline, economists seeking to improve how education is measured in the GDP framework have adopted two basic approaches, both aiming toward a more complete accounting of the investment value of education. The first, pioneered by John Kendrick, is an input-based, or cost-based, approach, but with a fuller accounting that includes non-market costs. The second approach, developed by Dale Jorgenson and Barbara Fraumeni, is an “output-based” approach. The output approach measures education as investment in human capital, valued not in terms of costs but in terms of lifetime income gains related to educational attainment. A third approach we should mention is the “indicator” approach, which attempts to measure quantities of educational inputs (teacher work hours and salaries, etc.) against quantities and quality of educational output (number of graduates and what they know, etc.). This approach (like that of the Atkinson Review) is notable for making it possible to estimate the productivity of the education sector as captured in the ratio of inputs to quality-adjusted outputs. But it does not capture the economic value of education for purposes of national accounting.
Kendrick’s model for human capital measurement does not only include formal education. It also includes childhood development as measured by child-rearing costs, as well as investments in health, training, and mobility as measured by expenditures on these goods and capabilities. However, Kendrick’s primary advance with the cost-based approach of human capital measurement was incorporating non-market inputs, most importantly the time devoted to schooling by students, parents, and others. In his model, human capital formation is estimated by the yearly increments of expenditures in all of these areas (including time expenditures), with the human capital stock of the nation being equal to the cumulative sum of these expenditures over time. In the 1960s, Kendrick estimated that the value of the human capital stock grew from $1.3 trillion to $3.7 trillion, compared to net growth of physical capital from $1.8 trillion to $3.2 trillion over the same period. Thus, by the late 1960s, the U.S. capital stock was more than twice as large as the capital stock conventionally measured, Kendrick showed. Among other things, such large revaluations of the capital stock has significant implications for saving-oriented economic development models and related policies.
Although most experts have followed Kendrick’s lead in including non-market inputs as part of the cost-structure of educational investment, leading researchers today agree than an input-based approach for measuring the education sector and the value of educational investment is inadequate, both for policy needs and for an accurate understanding of the economic importance of education. Alternatively, economists have developed output-based accounting models, building on the Mincerian econometric approach of linking economic returns to increments of education. This approach has been developed most comprehensively by Jorgenson and Fraumeni and it is recommended by the NRC panel on nonmarket accounts. The OECD has also adopted a version of the Jorgenson-Fraumeni approach in a new module for national human capital estimates.
In this model, education is treated as investment in human capital, on the principle that educational attainment yields economic returns over a lifetime. Here, the output of the education sector is measured independently of the costs of providing education. Essentially, educational output is the value of the human capital created by investments in education, including non-market investments of time. In a national or state accounting framework, education capital is measured for the whole population or the working-age population. The value of the human capital is the present discounted value of lifetime income gains attributable to increments of education across the population in a given year or period, and these yearly increments of human capital cumulatively form the stock of human capital over time, alongside other capital stocks.
With the recommendation of an output-based approach to measuring educational investment, important methodological questions will need to be resolved. For example, if human capital is measured in terms of lifetime market income gains, how can we account for human capital in an aging population increasingly supported by social transfers and retirement benefits? Should a high-income person’s higher retirement benefits not be included in the measurement of human capital? Another issue is the non-market benefits of education, with strong correlations between education levels and healthy lifestyles, better parenting, and more civic engagement. Should the non-market benefits of education be counted in human capital measures? The Jorgenson-Fraumeni model includes non-market benefits, which are considered to be roughly equal in value to market benefits. Essentially doubling the value of human capital (and generating very large estimates of the human capital stock relative to GDP and other forms of capital), this “full return” approach has been criticized as economically unrealistic and unhelpful from a policy perspective.
In a different model currently being developed for the state of Oregon, human capital is measured by market returns only.
Two further methodological issues loom large for incorporation of human capital in a national accounting system. The first is that formal education is not the only driver of lifetime income trends, which means that valuing human capital by measuring economic returns from education may lead us to overestimate the effects of formal education. Family contributions, early childhood education, and learning on the job are also surely a significant part of the story, and experts widely agree that future research should focus on these additional important factors.
The second issue is the assumption that lifetime income gains from education reflect workers’ marginal products in isolation from other factors. Clearly, many factors beyond educational attainment contribute to rising incomes in a given society. For example, highly educated workers in a country or state with inadequate infrastructure are likely to earn less than similarly educated workers in a society with state-of-the-art infrastructure. Likewise, union density, health policy, and trade policy may enhance or limit the value of education in a given society. Higher or lower union density, for example, may impact wage levels in a population independently of educational attainment in the population. Likewise, healthier societies, due to any number of policy reasons (including levels of education), are likely to be more productive and have higher average incomes, all other things being equal.
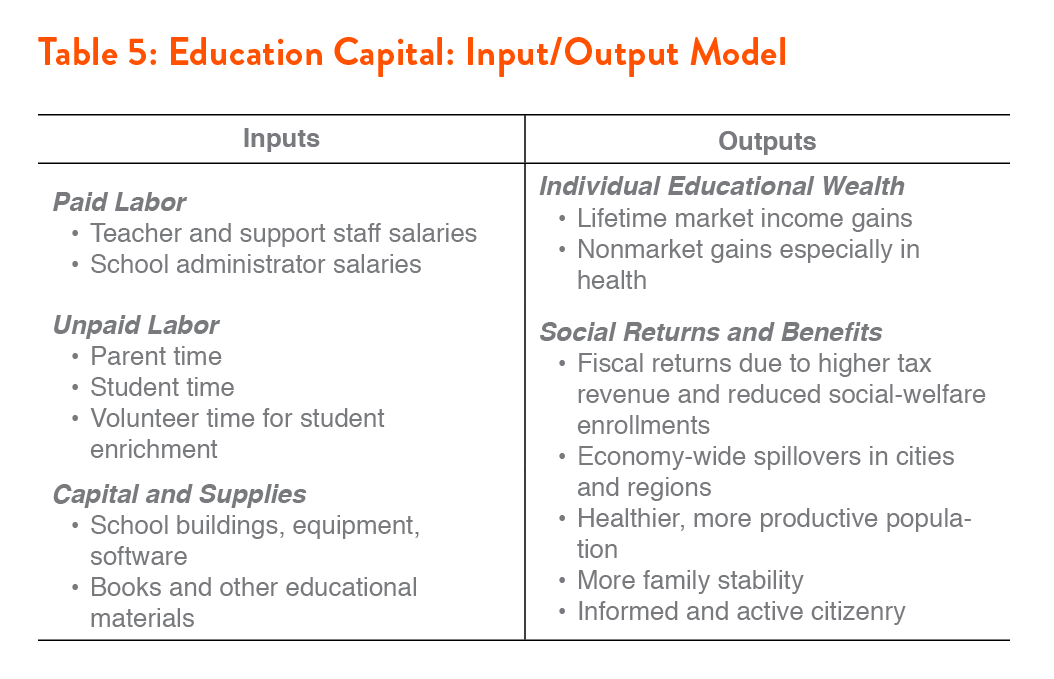
With all of these considerations toward the goal of getting us closer to measuring the true value of educational attainment in the population, we can sketch the basic framework for a national education account fairly simply. Essentially, it would bring the Kendrick framework for cost-based estimates together with some version of the Jorgenson-Fraumeni framework for measuring educational output. In Table 5, we can see how this would be constructed and the components on each side of the account.
A Measurable Good for Public Policy
As a measurable good in our economy, education capital is a salient idea and focal point from multiple angles of policy development. In the broadest sense, measuring education capital in a national accounting framework is necessary for a more accurate view of national wealth in the twenty-first century economy. Many economists point with concern to a flattening of domestic investment in recent decades. As a share of GDP, gross domestic investment fell to roughly 16 percent in 2005 and only recovered to 13 percent in 2012, compared to roughly 20 percent in 1979. At the same time, the share of national income allocated to current consumption has grown roughly from 60 percent to 70 percent over the same period (the caveats regarding direct household consumption versus socialized forms of consumption, analyzed earlier, do not alter the fact that we are spending more of our national income on current consumption and saving less). By standard accounting, a declining ratio of investment to personal consumption, as we’ve seen over the last several decades, is often interpreted as a warning signal about unsustainable growth. By spending too much of our national income on current consumption, we are eroding our asset-base for future consumption. But what does the ratio of investment to consumption look like if we include human capital investment?
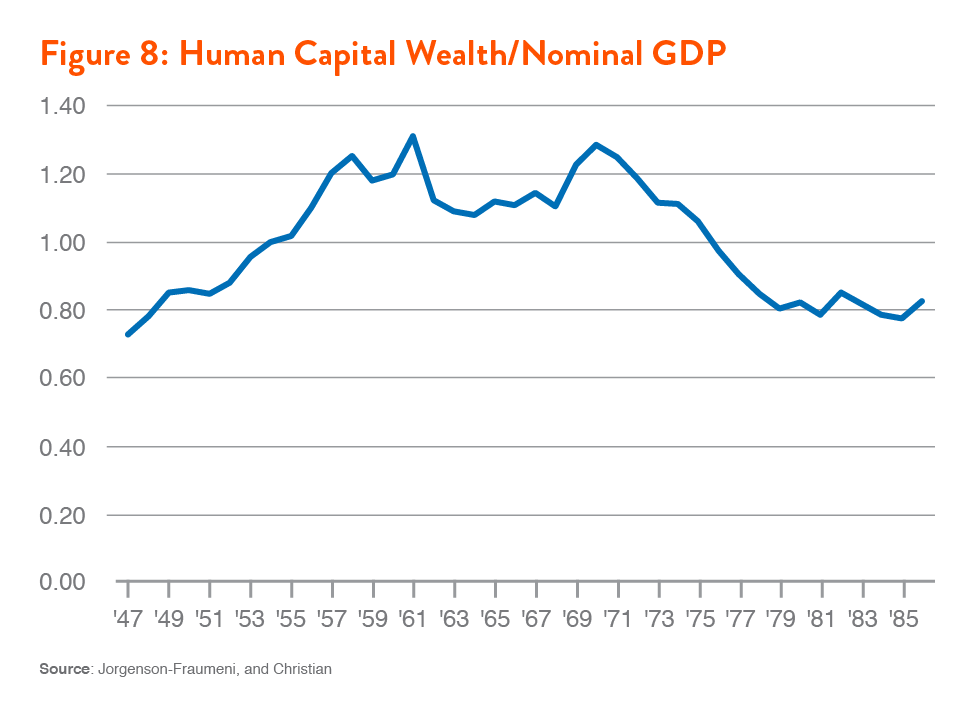
Inclusive of education capital, domestic investment naturally was more robust than it appeared in recent decades. However, in Jorgenson-Fraumeni estimates for education capital in the period from 1948 to 1986, there is notable downward trend relative to GDP growth beginning in the early 1970s, as seen in Figure 8. This corresponds with a deceleration of college attainment for men that began in 1950, only partially offset by gains for women. Among people born between 1950 and 1980, college attainment grew by only 6 percent, compared to roughly 17 percent for those born between 1920 and 1950. What these education trends may have to do with the well-known productivity collapse and growth slowdown that began in the early 1970s is potentially a much more illuminating question if human capital is integrated into our accounting. Unfortunately, we cannot know about the real rate of investment, along these lines, until we begin to measure human capital in a way that is consistent with how we measure other forms of capital in our economy.
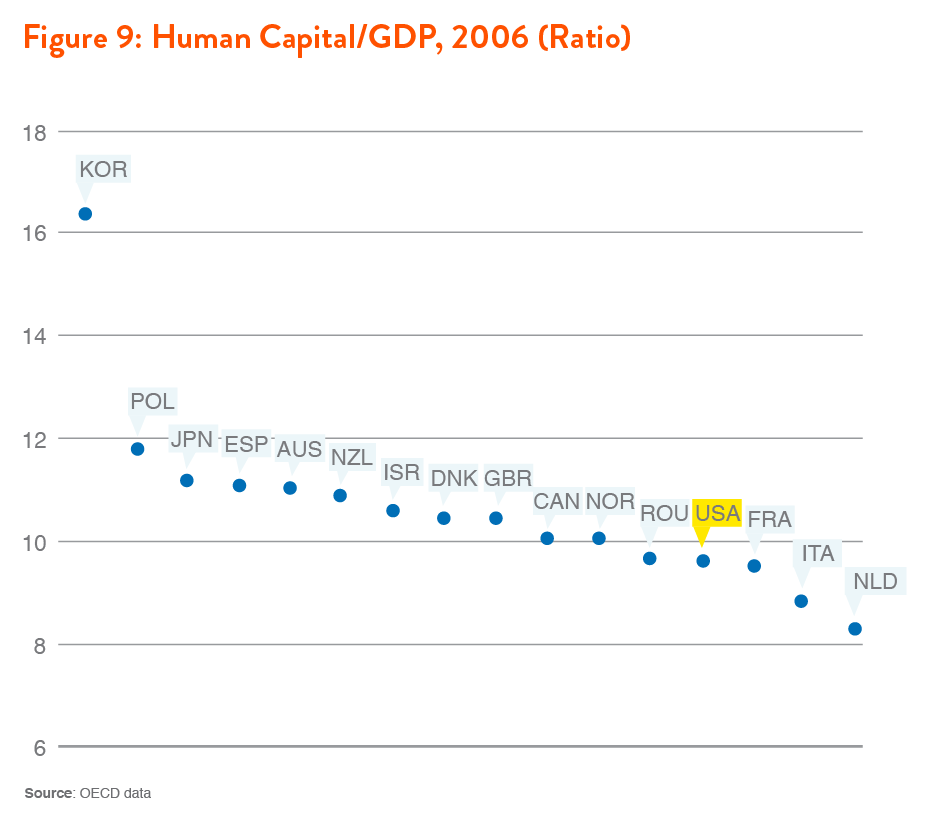
Human capital estimates are also illuminating from other perspectives. In more recent estimates from the OECD (using a version of the Jorgenson-Fraumeni model), the U.S. was ranked 13th out of 16 countries for human capital as a ratio of GDP, in a range from 8x (Netherlands) to more than 16x (South Korea), as shown in Figure 9. Estimates comparing human capital to other forms of capital can also be illuminating.
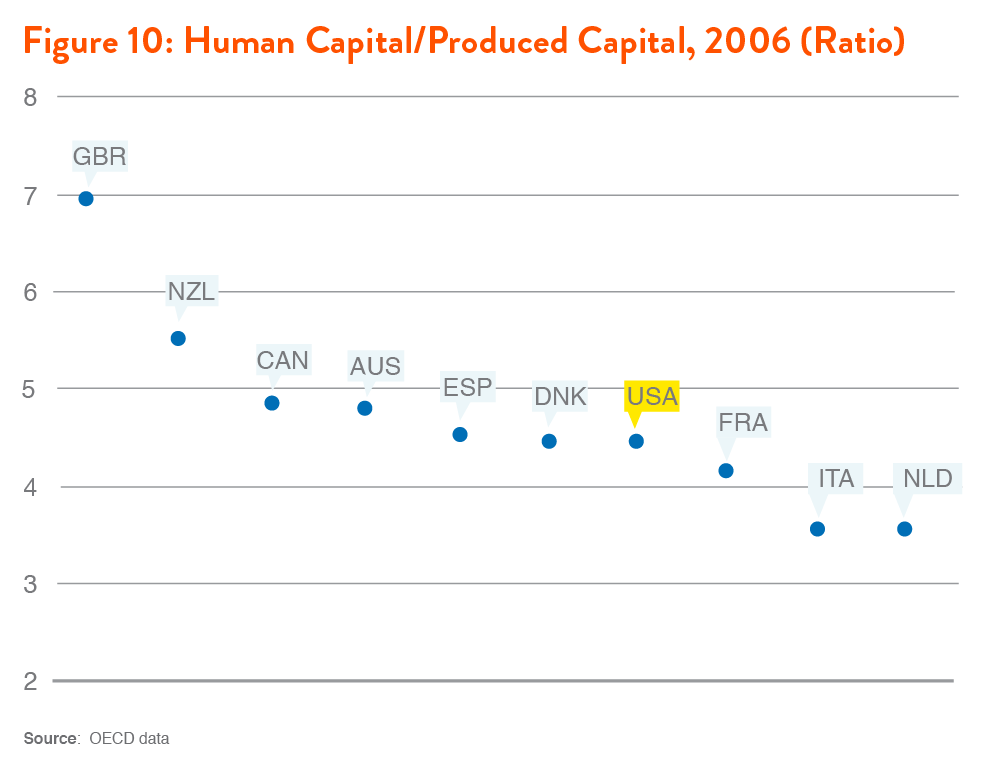
In Figure 10, with estimates for ten OECD countries, human capital exceeds produced capital (structures and machines) in every country. The U.S. stands at the lower end of the range, with human capital leading by a factor of 4.5 compared to seven for Great Britain. Similar comparisons can be made with financial capital and environmental capital, helping to create a more comprehensive understanding and likely a more sustainable view of national wealth and investment, both for policy development and for broader growth strategies.
Yet, for policy purposes, human capital accounting should be developed cautiously. Clearly, in valuing the education sector, we should not expect cost-based estimates and output-based estimates to be the same. Indeed, this seems very unlikely even simply in light of the investment-type behavior reflected in expanding college enrollments and student indebtedness in recent years. At the same time, very large gaps between inputs and outputs (e.g., as generated by the inclusion of non-market benefits in some models) may reflect an overestimation of the returns to education, which could lead to inefficient investment decisions and an incorrect ranking of priorities for economic growth. In this light, while an output-based approach to education is clearly necessary in any serious effort to improve the national accounting system, refining the model to get as close as we can to measuring the real returns from educational investment is essential. As noted, in addition to developing reasonable output measures, such refinement means estimating and controlling for (or netting out) other contributions that may be conflated with educational returns.
A sufficiently refined framework can bring us close to measuring the true value of education and how educational investment is contributing to our economy over time. Notably, however, educational accounting cannot be a tool of policy analysis for improving educational attainment or education quality, at least not directly. Human capital measurement does not directly help us in assessing different approaches toward the goal of raising graduation rates or education quality. Rather, it is a tool for measuring the economic yields from educational attainment. As such, in the context of policy development, education accounting is most relevant as a lens for rationalizing costs associated with improving educational attainment. For example, the state of Oregon currently has a long-term education plan with the objective of reaching an 80 percent post-secondary graduation rate, inclusive of vocational training, college, and graduate school programs.
An education account can be used to measure the investment value of this education policy under different budget scenarios and possibly different compositions of investment (pertaining, say, to a prioritization of early childhood education). Measuring the capital value of educational investment does not guarantee, of course, that a given set of investments, under a given set of policies, will succeed in producing a more educated population with more human wealth. Rather, it is precisely the value of effective education policy and sufficient public investment in education that is captured in such an account.
Conclusion
In today’s polarized politics, the problem of unmeasured public value is a damaging one for reasonable debate about fiscal policy and the role of government. Yet it is also a technically challenging problem, requiring significant new work to develop sound, feasible solutions in a national accounting system and concrete policy settings. In the foregoing assessment, we have outlined the strong case for tackling this problem and examined some technical aspects of the problem in specific areas. In conclusion, we offer a set of four summary propositions to guide further discussion of this issue and hopefully motivate concrete action toward improving how we measure the output and value of government.
From GDP to SDP
The GDP structure gives a false impression of the composition of U.S. growth, in terms of the relative importance of private consumption from wages compared to socialized consumption from transfers, non-profit services, government salaries, and various other forms of indirect income such as employer-paid healthcare premiums. There is also the problem of “growth leakage” from import-content. The share of social consumption in our GDP growth has at least quadrupled since the 1950s and will continue to grow in an aging society without strong political support for full-employment policies (or population growth). Moreover, the leakage of growth will expand along with trade deficits, likely offsetting the domestic growth benefits of any wage increases that might be won. In light of all this, the GDP structure should be refined to better reflect these trends in the composition of growth, differentiating between what might be termed Private Domestic Product (PDP) and Social Domestic Product (SDP). Related analysis of PDP and SDP can help to shape a more balanced view of combined public and private prosperity and to reorient the concept of growth around public and social goods, with less reliance on resource-intensive individual consumption.
Measuring and Valuing Public Contributions
Government activities—including services, public goods provision, and core social investments (education, health, infrastructure, research)—should not be measured at cost in the national accounts, for lack of market prices. Instead, methods for measuring the output and value of government activities should be developed and integrated in the national accounts, including economic or social-welfare valuation wherever possible. The latter is particularly applicable and important in areas where government is clearly a primary investor in forms of capital, most notably human capital (through education and health spending), infrastructural capital (for energy, transport, etc.), environmental capital (through regulatory protection and risk management, and restoration programs), and intellectual capital (through research funding for basic science and technological development).
Regulatory Saving
In some areas of our public economy, most notably the environment, national accounting is limited by the lack of a common framework for measuring regulatory contributions to growth and economic welfare. Yet it is clear from many case studies that environmental regulation and others forms of regulation often generate net gains in our economy by reducing social costs, improving human welfare, and even spurring valuable innovation over and above the private costs of regulatory compliance. We should develop methodologies to measure these gains in aggregate, considered as a form of national saving. In this model, our regulatory saving rate is the ratio of aggregate net regulatory benefits relative to GDP or relative to other macroeconomic saving measures such as investment in physical capital. Capturing the specific values generated by regulation in a national accounting framework presents many challenges, of course. Yet, when regulatory benefits are not differentiated in our measured growth, policy development to improve or extend regulatory controls in different important areas and in multiple areas cannot be subject to macroeconomic analysis in a way that is consistent with how we measure the economic impacts of other kinds of policy, such as monetary policy or employment programs. Ultimately, without adequate measures of regulatory saving, economic growth strategies will tend to be structurally weakened by unanticipated and potentially very large social costs.
A Twenty-First Century National Accounting System
A national accounting system designed for the challenges of the 1930s clearly is not sufficient for the challenges of the twenty-first century. Since the 1930s, we have developed a human-capital driven economy and a more socialized structure of economic growth, including government support for knowledge and innovation, extensive provision of public education, extensive social insurance for older Americans, and strong regulation of the environment and other key areas of social risk. At the same time, we have acquired new and potentially very costly collective action problems with our environment, along with economic and social disparities that have greatly limited productive activity in many communities. Adapting our national accounting system for these new realities of wealth creation, socialized growth, and collective risk is not a silver bullet, but it is an important step in the right direction, with minimal budgetary costs and potentially significant impacts on policy development. While the National Research Council and other scientific bodies have made significant strides in developing feasible designs for improving our national accounting system in some key areas, we need to develop a coherent national policy in this area as soon as possible. Initially, this should include two major steps toward implementation: 1) organizing a high-level federal commission bringing together leading researchers with statistical agency heads and economic policy advisors to build consensus on a scope and sequence of feasible yet relevant measurement reforms, and 2) executive branch and/or legislative authorization of a comprehensive program to improve the national accounts and an institutional structure for implementation, supported with sufficient appropriations.
* Michael Mandel of the Progressive Policy Institute has previously commented on this issue and I have benefited from several conversations with him.