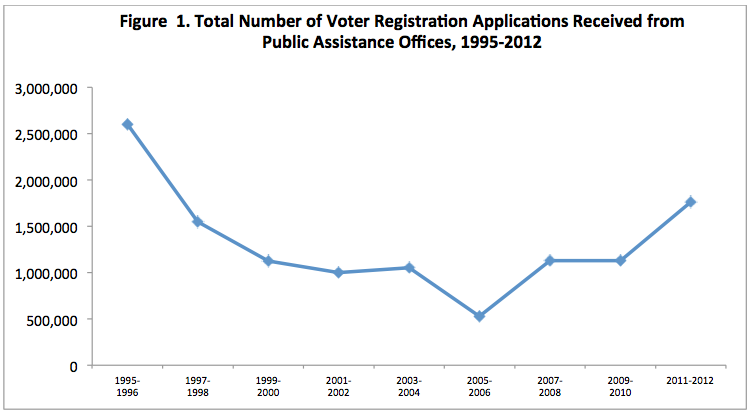
Fundamental to a healthy, thriving democracy is the participation of every eligible voter. Voter registration is a fundamental first step to bringing more voices into our electoral system. As the National Voter Registration Act (NVRA) celebrates its 20th Anniversary, the latest numbers from the Election Assistance Commission (EAC) on the impact of the NVRA show public assistance offices received 1.8 million voter registration forms nationwide.
These numbers are an increase from the 1.14 million registration forms reported in the previous reporting period
and 2.4 times as many registration applications as the 527,752 received in 2005-2006.
These increases show the impact of improved implementation of Section 7 of the NVRA in many states over the past several years.
Under Section 7 of the NVRA, any office that provides public assistance, as well as state-funded programs primarily engaged in providing services to persons with disabilities, must also provide voter registration services.
Beyond just providing registration forms, Section 7 requires that applicants receive the same level of assistance when completing voter registration forms as is provided with completing the agencies’ own forms, and requires agencies to transmit completed registration applications to the appropriate election official.
As the chart below shows, nearly 1.8 million voter registration applications came from public assistance offices in 2011-2012. In 2005, non-profit partners Demos, Project Vote, and the Lawyers’ Committee for Civil Rights Under Law began working with and litigating against states to improve compliance with Section 7 requirements. Since that time, as shown below, there has been a steady increase in voter registration applications from public assistance from 2005-2006 onwards.
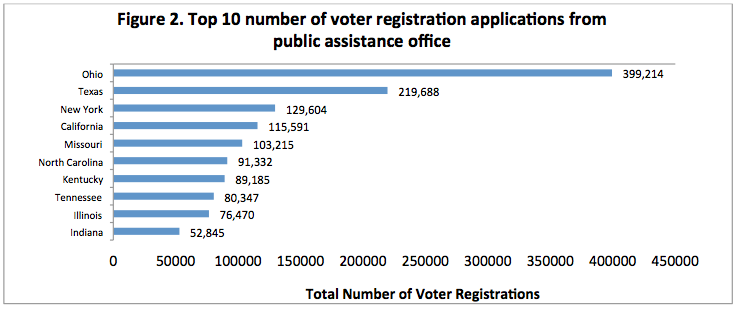
Top Performers
The first chart below shows the top 10 states with the highest absolute number of voter registration applications from public assistance offices.
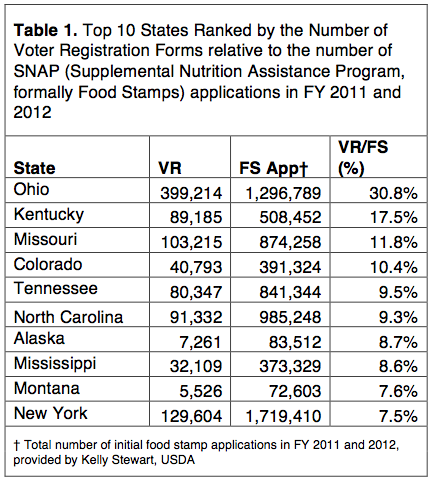
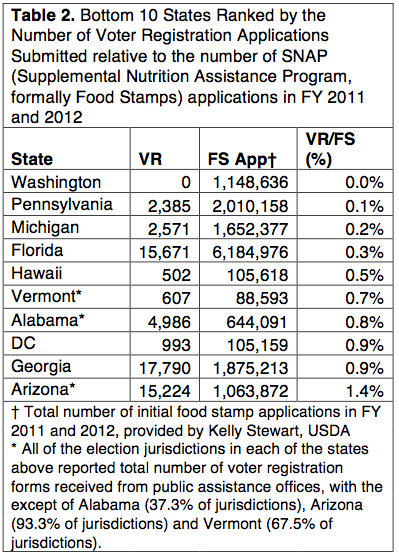
Given that the size of a state’s public assistance caseload obviously affects the absolute number of voter registration applications submitted, it is also informative to rank states on a measure that takes caseload differences into account. The table below shows the top 10 states for voter registration applications submitted relative to the number of Supplemental Nutrition Assistance Program (SNAP) applications, a good proxy for a state’s public assistance caseload. This comparison is a conservative estimate of one subsection of individuals that should be served under the Section 7 requirements. Of the states listed below, Ohio, Missouri, Colorado, Tennessee, North Carolina and Mississippi all had some type of intervention completed prior to 2011 to increase compliance with Section 7.
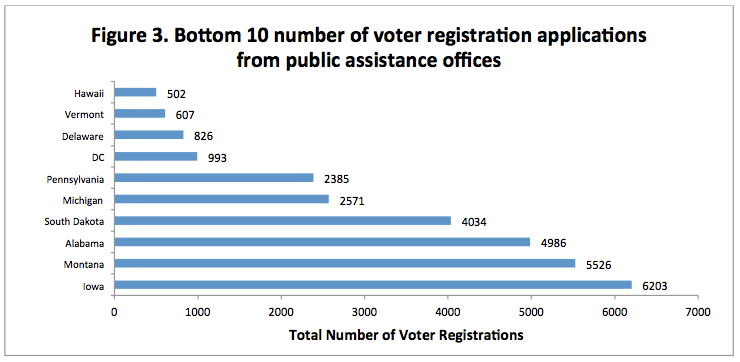
Worst Performers
At the opposite end of the spectrum, the bar graph below shows the 10 states reporting the fewest number of voter registration applications submitted to public assistance offices. Consistent with the reasoning explained above, the table below the bar graph shows the bottom 10 states for voter registration applications received relative to the number of SNAP applications. Washington State remarkably reported zero voter registration applications from public assistance agencies.
The Impact of Section 7 Interventions
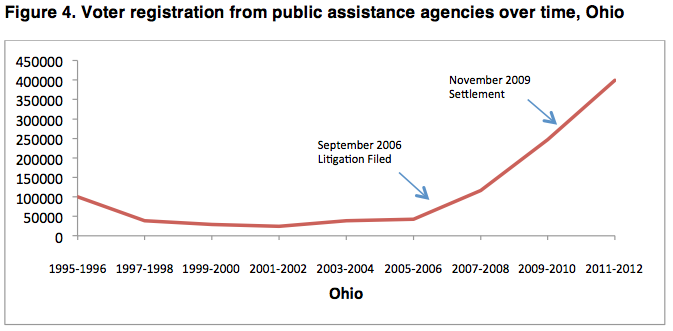
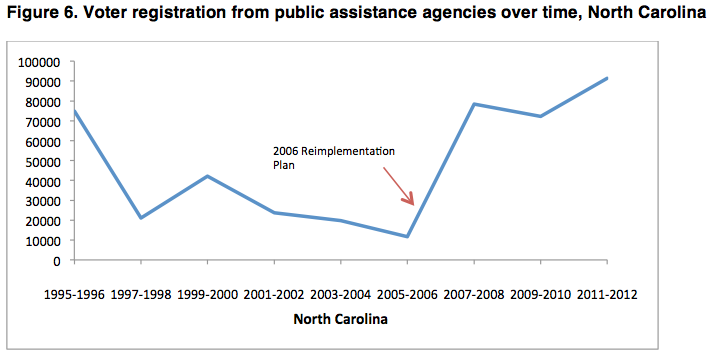
As shown in the series of charts below, in the overwhelming majority of cases, intervention by non-profit partners has resulted in a substantial increase of voter registration application forms from public agencies.
In Ohio, after Demos and its partners filed litigation to increase compliance with Section 7 in 2006, voter registration applications immediately increased in the following reporting cycle. Since that time, voter registration applications have significantly increased to a high of 399,214 from 2011-2012.
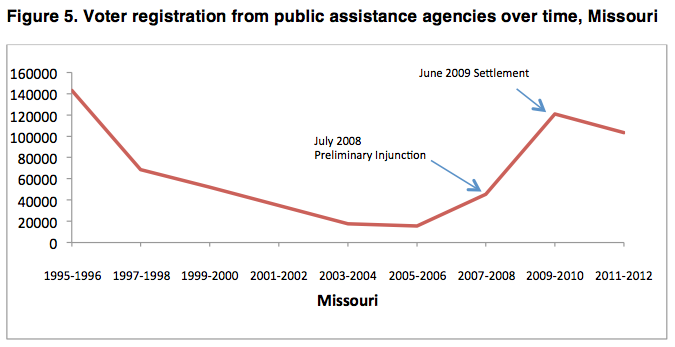
In Missouri, a similar pattern emerges. After collecting 140,000 voter registration applications in the first reporting period after implementation of the NVRA, the state saw a steep decline with only 15,568 applications at public assistance agencies reported in 2005-2006. After Demos and its partners intervened with a pre-litigation notice letter in July 2007 and a lawsuit in 2008, voter registration applications have increased significantly- despite a slight decline from the last reporting period- with 103,215 applications received in 2011-2012, over six times as many as in 2005-2006.
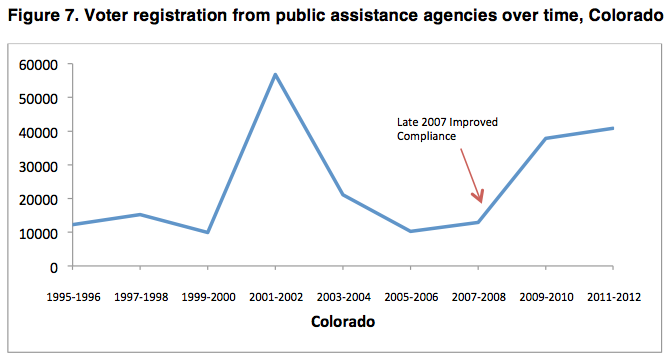
After a spike of 56,000 applications in 2001-2002 in Colorado, voter registration applications in public agencies began to fall dramatically to a low of just over 10,000 in 2005-2006. Led by Project Vote, a partnership between advocacy groups and the Colorado Secretary of State’s office began to improve NVRA compliance with the state’s Department of Human Services in 2007. The first of two pre-litigation notice letters was sent in May 2008 and voter registration applications have steadily increased since then to 40,793 in 2011-2012.
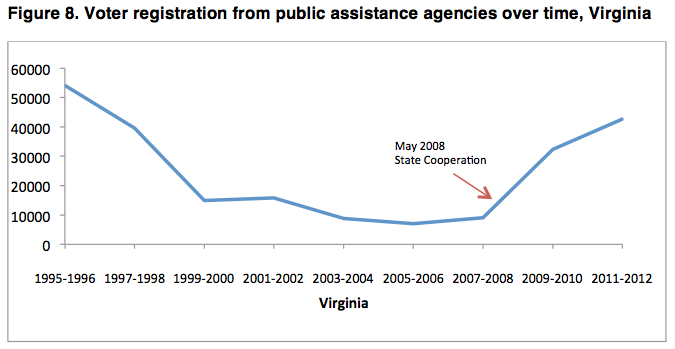
Voter registration application from Virginia’s public assistance agencies reached a low of 7,030 in 2005-2006. In May 2008, Demos and its partners began working in cooperation with state elections and public assistance officials to improve procedures. As a result, voter registration applications have increased substantially and in 2011-2012, the state collected 42,698 applications at public assistance agencies in the state.
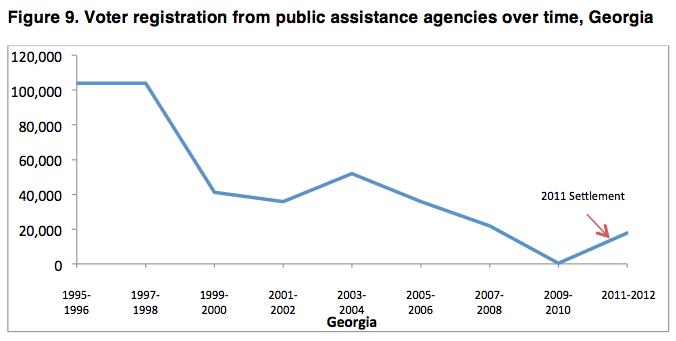
As shown below, voter registration applications in Georgia steadily declined after an initial high of over 103,942 the year after the NVRA was enacted. In the 2009-2010 reporting period, public assistance offices reported just 279 applications. After a lawsuit by the non-profit partners and a settlement agreement in 2011, voter registration applications rose to 17,790 from 2011-2012-- over 60 times the number received in the previous reporting period.
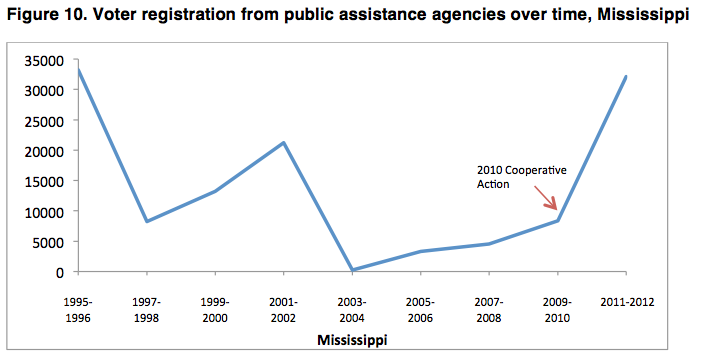
Mississippi experienced a sharp drop in voter registration applications from public assistance agencies from 1995-1996 to the 1997-1998 reporting period. After increasing for the next few reporting cycles, public assistance agencies reported a low of just 245 voter registration applications in 2003-2004. Cooperative action between Demos and the state of Mississippi in 2010 resulted in the state reporting 32,109 voter registration applications from these agencies, nearly as high as when the NVRA was enacted.
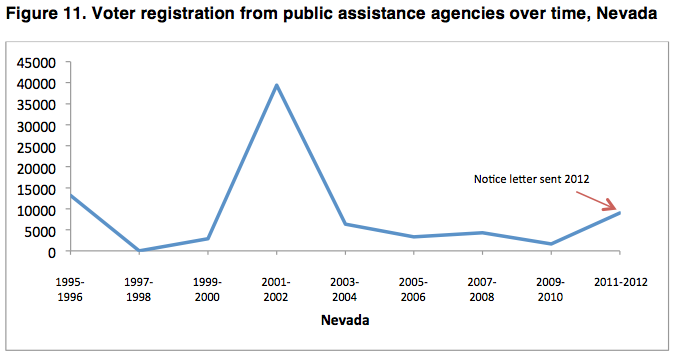
In Nevada, after a spike in 2001-2002, voter registration applications declined to a low of 1,677 in 2009-2010. Litigation by Demos and its partners is on-going but has catalyzed improvements, and registration applications received in 2011-2012 increased to 9,057.
Conclusion
While there are clearly success stories, the data in the recent EAC report shows that there is still work to be done to ensure that all eligible voters are registered. The number of overall voter registration applications from public agencies continues to increase but is still lower than the initial high of over 2.5 million in 1995-1996. Work done by Demos and its allies shows how increased state compliance with NVRA provisions results in more voter registration applications being received.
A healthy, thriving democracy requires widespread participation. Bringing more low-income voters into the electoral system through vigilant enforcement of Section 7 increases the diversity of political voice and makes our democracy stronger and more accountable.
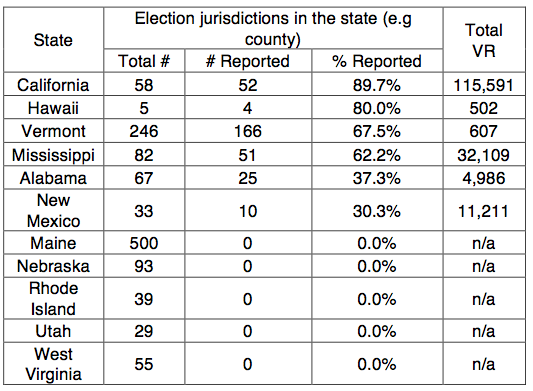
Appendix 1: Incomplete State Reporting
Some of the states may have more voter registration applications than presented in the preliminary data from the EAC due to incomplete reporting. The table below shows the states with fewer than 90 percent of jurisdictions reporting and how many jurisdictions within the state did not report.