This is the second of a series of articles, entitled “The Financial Pipeline Series”, examining the underlying validity of the assertion that regulation of the financial markets reduces their efficiency. These articles assert that the value of the financial markets is often mis-measured. The efficiency of the market in intermediating flows between capital investors and capital users (like manufacturing and service businesses, individuals and governments) is the proper measure. Unregulated markets are found to be chronically inefficient using this standard. This costs the economy enormous amounts each year. In addition, the inefficiencies create stresses to the system that make systemic crises inevitable. Only prudent regulation that moderates trading behavior can reduce these inefficiencies.
Introduction
The prior article in this series points out that the most important social purpose of the financial markets is to facilitate the movement of funds from (a) holders that seek investment opportunities to (b) businesses and governments who need to put investment capital to work in productive ways and to individuals who seek to borrow for their current needs. This function is referred to in this series as “Capital Intermediation.” The article describes findings that the cost of Capital Intermediation has increased significantly over the 35 years of financial market deregulation in the United States, despite advances in information technology and quantitative analysis that intuitively should have increased efficiencies in the process. Instead, Capital Intermediation has become less efficient.
Academics speculate that this increased cost must have something to do with the massive increase in trading in the securities and commodities markets over this period. This is correct, but incomplete. Volume, per se, has not caused Capital Intermediation to become more inefficient. Rather, particular types of trading that generate tremendous volumes have caused it. Thus, observed high trading volume includes - actually is dominated by - specific types of trading that increase the inefficiency of Capital Intermediation and its cost. The increased volumes in the traded markets are largely a result of high-speed, computer driven trading by large banks and smaller specialized firms. This article illustrates how this type of trading (along with other activities discussed in subsequent articles) extracts value from the Capital Intermediation process rendering it less efficient. It also describes how the value extracted is a driver of even more increased volume creating a dangerous and powerful feedback loop.
Tying increased trading volume to inefficiencies runs counter to a fundamental tenet of industry opponents to financial reform. They assert that burdens on trading will reduce volumes and thereby impair the efficient functioning of the markets.
The industry’s position that increased volume reduces transaction cost is superficial, if not negligently or intentionally erroneous. Its position is based on a simplistic syllogism: all trading volume increases market liquidity, market liquidity reduces transaction costs and reduced trading costs benefit the economy. But there are critically important distinctions between trading volume and levels of market liquidity; and trading activity that increases the cost of Capital Intermediation, even though it may reduce transaction costs, does not necessarily benefit the economy on a net basis.
This article will explore the concepts of volume and market liquidity, including critical distinctions between them. Liquidity benefits market participants. A market is considered liquid to the extent that there are levels of buying and selling interest sufficient so that one who wishes to transact can be assured that he or she can complete the transaction close to the price most recently quoted on the market. Another way to think about liquidity is that it provides stability of prices within the current spread between reliable purchase and sale price quotes. Predictability and stability are closely related.
Deregulation and technology advances have greatly increased trading volume. However, this article will show that much of today’s historically high trading volume does not provide market liquidity when markets are under stress - that is to say at precisely the time that liquidity is most needed. On the contrary, this large category of trading volume reverses itself and consumes market liquidity in great quantities at these times. The shift from providing liquidity to consuming it is unpredictable and, as a result, even more disruptive. And these shifts occur on a daily basis.
Furthermore, a substantial portion of this volume is specifically designed to subvert the essential price discovery function of the marketplace. Price discovery allows market participants to observe market prices levels at a given point in time. In a well-functioning market, price levels reflect the fundamental value of securities and derivatives being traded based on currently available information that is relevant to fundamental value.1 Even when the market is not stressed, commonly used high volume trading tactics drive market prices away from the fundamentally sound values that efficient markets achieve. As a result, the price levels discovered by market participants are distorted by market maneuvers and are unreflective of fundamental values, reducing market efficiency.
Finally, in order to avoid these tactics, many market participants have opted for “Dark Pools” and trading that is internalized to broker/dealers. In each of these trading venues, price quotes and orders are hidden from the general market. These are alternatives to “Lit Venues,” i.e., exchanges and transparent trade matching venues in which quotes are disclosed. This reduces price transparency overall. Notwithstanding some analytical work that has been interpreted to the contrary, the migration of trading price data to Dark Pools and internalization programs damages essential price discovery.
Chronic price distortions are not merely vehicles for clever traders to get the better of slower and weaker market participants. Distortions caused by illusory liquidity, aggressive trading tactics and non-transparent trading make the marketplace unreliable. There is ample evidence that major securities and derivatives markets in the US are widely viewed as unreliable. In response, investors adjust the prices required to induce them to deploy their funds so as to provide a buffer against unreliability. This is a drag on productive investment in businesses, governments and households. It is also a direct transfer of value from the productive users of capital (and ultimately the American public) to the financial institutions that exploit (and quite often create prior to exploiting) these price distortions.
Trading Volume in the Era of Deregulation
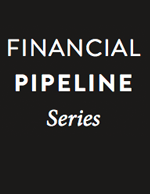
Across all markets, trading activity has increased enormously during the time of deregulation. Equities markets are the deepest and most liquid securities markets. Trading in the US equities markets has reached extraordinary levels. (See Figure 1)
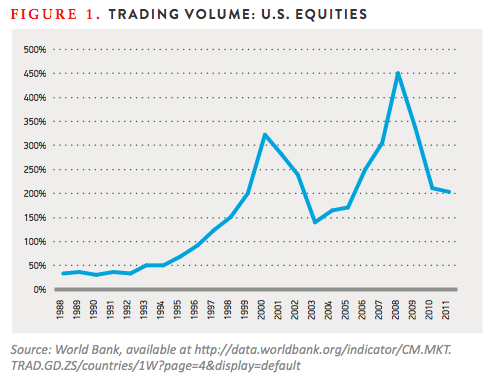
This has not been because of new issues of shares that would have increased the amount of equities available to trade. The supply of new issue equities has been relatively low for years. (See Figure 2)
It is abundantly clear that equities trading volume growth is a function of algorithmic and high frequency trading (“HFT”). This technique, developed over the last two decades, is employed widely in the markets. It is characterized by fully automated trading strategies intended to profit from market liquidity imbalances or other short-term pricing inefficiencies.2 It has been estimated that today 73% of equity trading volume is a result of algorithmic and high frequency trading.3 HFT has changed fundamental characteristics of markets. It has been estimated that at the end of the Second World War, the average holding period for stocks was 4 years. By the turn of the millennium, it was 8 months. By 2008, the average holding period declined to 2 months. And it has been estimated that, at least for actively traded shares, it had declined to 22 seconds by 2011.4 Obviously, trading that churns the market has increased tremendously.
While there has been speculation that high frequency trading may have declined recently, a November 2012 study funded by the Commodity Futures Trading Commission focusing on the equities futures market, an integral element of the equities market, finds that the percentage share of HFT in that sector has remained constant.5
Bond market trading has increased as well. From 1996 through 2008, annual trading volume in bond markets increased by 3.13 times, though trading declined in 2009 and 2010 because of the financial crisis effects on the Federal Agency and Mortgaged Backed Securities markets. Over the same period, new issuance increased by 2.8 times.6
The derivatives market volume growth is even more dramatic. The new issue/trading comparison is irrelevant in this instance since derivatives are not assets that are bought and sold. They are bilateral contracts to be performed in the future. (See the third article in this series for an in-depth analysis of derivatives.) A party does not actually buy a derivative from someone else, as one might with shares of stock or bonds. Every transaction is a new position. The outstanding notional amount of financial (non-commodities) derivatives in 1987 was $866 billion. By the beginning of 2010, the amount was $466.8 trillion.7
Thus, volumes in all traded markets have increased dramatically during the period of deregulation while the efficiency of Capital Intermediation has declined. As indicated by Professor Philippon of NYU, the declining efficiency of intermediation must be related to the incremental quantity trading and its properties.8
Basic Concepts: Liquidity and Bid/Ask Spreads
Contrary to the Efficient Market Hypothesis, the evidence indicates that increased volume of trading activity is not a universal good. There is no doubt that a portion of the volume traded by purely financial market participants facilitates the efficient intermediation of capital transfers between suppliers and productive users. But, as we shall see, not all incremental volume has this effect. Before we delve into this issue, a review of some basic properties of trading markets is needed.
The concept of market liquidity is misused and abused almost universally by the financial services industry, experts and commentators. It refers to the extent to which the initiation of a market transaction changes the transaction price that would be expected based on recent price quotes that are widely known. If, for example, a large number of willing buyers are active in a market at a given price level, a seller is more likely to receive the going price for a sale he or she posts to the marketplace seeking a transaction counterpart. In this circumstance, the buying and selling interest in the market is so large that the transaction is unlikely to exceed the level of willing buyers or sellers at the best available reliable price.
Conventional thinking is that a large number of transactions taking place in a market means that transaction liquidity is high and the seller is more likely to receive the price most recently bid to other sellers when his or her posted offer to sell is matched with a buyer. As we shall see, this is exceedingly simplistic.
Bid/ask spreads are related to market liquidity. A bid price is an offer to buy an amount of securities or derivatives at a stated price. An ask price is a similar offer to sell. Bid and ask prices are posted on exchanges or other Lit Venues so that prospective entrants to the market can see the most reliable expected acquisition cost or expected sale price if they choose to transact. The size of the prospective entrant’s transaction is important to the extent it consumes all of the purchasing interest or sale interest at the published bid and ask levels. If this happens, the price will be less favorable than indicated by the best priced quotes since additional buying or selling interest will have to be attracted to fulfill the transaction.
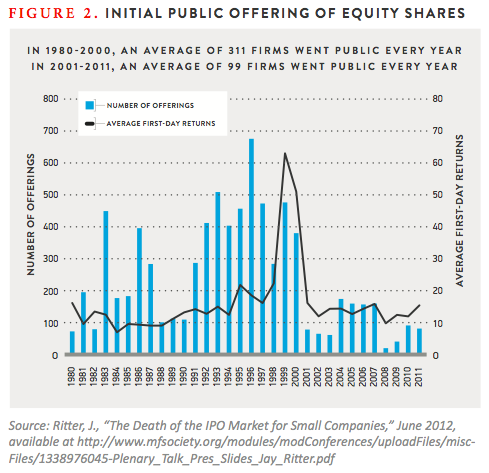
A bid/ask spread describes the price range between actual recent transaction proposals, both to buy and to sell, in a marketplace. (See Figure 3.) There is reasonable certainty that some amount of securities can be sold at the bid price and that some amount can be purchased at the ask price, assuming that quantities do not exceed posted bid or ask quantity limits. If an investor interested in buying shares of “AET” looks at this screen, he or she sees that the last purchase and sale was at a price of $13.01 per share and that the current asking price is $13.02 per share. The investor also sees that there are offers to buy AET, or bids, at $13.01 per share, so he or she should expect to buy AET shares at a price somewhere between $13.01 and $13.02 unless his or her order is so large that it wipes out the $13.02 ask quotes and a higher price is required to attract more sellers. In that case, the market liquidity was insufficient to allow the investor to acquire the shares at the quoted price. (See Figure 3)
Bid/ask spreads are thought to be narrower in highly liquid markets. Competition to profit from the spread between bid prices and ask prices in highly liquid markets is greater. And resale/repurchase is more reliably accomplished if the trader wishes to do so at a subsequent time, which has a significant value that is an independent component of the price paid or received at the execution of the transaction. For example, a purchaser will pay less if the market is illiquid because the ability to realize any gain at a subsequent time is less certain.
Bid/ask spreads are a measure of transaction cost.9 Financial institutions have historically engaged in the business of simultaneously quoting both bid and ask prices. The financial institution will sell at the ask price and immediately cover the sale with a purchase at the bid price. This activity is called market making, a trading strategy designed to capture the spread between the two quoted prices. The market maker provides other market participants immediate and reliable access to a purchase or sale at the going price at the moment of execution. It is said to provide “liquidity.”
Conceptually, the price that the market “charges” a transacting market participant a price paid in exchange for access to liquidity (e.g., making the securities available at a reliable and predictable price). It is the spread between the bid and ask prices, or the profit a financial institution would earn if it immediately covered the purchase or sale at these reliable levels. (See Figure 4)
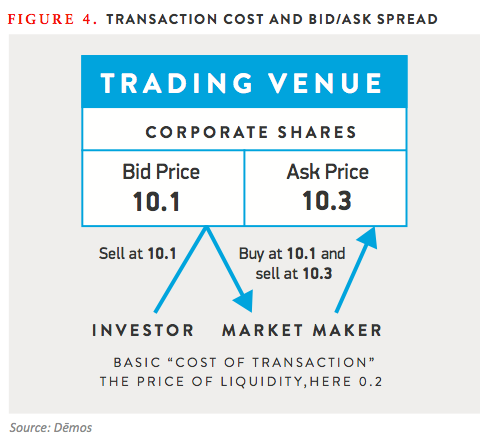
This is not necessarily the result in any given transaction. Purchases and sales are consummated inside and outside the bid/ask price spreads, sometimes because a market entrant seeks to transact in quantities in excess of the purchase or sale interest level at the best prices currently quoted by market makers. However, the bid/ask spread is the generally accepted quoted cost for consummating a transaction that market participants rely on.
Many market participants assume that higher levels of buying and selling interest reduce transaction costs as measured by bid/ask spreads. Recent studies have described the effect of changing volume levels on bid/ask spreads, but it is an extremely complex relationship.10 It is certain that the relationship between volume and bid/ask spreads is far from linear. It is also clear that factors specific to the security or derivative being traded have a substantial effect on the relationship. For example, if the economy is booming, bid/ask spreads may be narrow for lower credit quality bonds. But, if the economy is shaky and there is an increased risk of corporate defaults, the bid/ask spreads for those bonds may be wide even if the available liquidity is the same. This is because financial institutions who quote bid and ask prices (i.e., market makers, as described above) must price in the uncertainty of a credit event intervening in the process of covering off a position.
There are other attributes of trading volume that affect both the cost of transactions and Capital Liquidity. These are explored below.
Trading Volume and Transaction Liquidity
Conventional analysis of market efficiency centers on the instantaneous price effect of liquidity on individual transactions by examining quoted bid/ask spreads. The term “Transaction Liquidity” will refer to the trading volume that narrows the spread between the bid and ask prices, thereby reducing transaction costs.11
Some types of trading activity always reduce transaction costs because of the design of the activity. Other types of trading activity only sometimes reduce individual transaction costs. At other times, however, these types of activity have profound negative consequences for transaction costs. They are almost never neutral. Another way to describe this type of trading activity is that it switches back and forth between providing liquidity and consuming it. On the whole, the actual and threatened negative consequences from abrupt and unpredictable shifts from providing liquidity to consuming it distort the market so profoundly that they significantly increase the cost of Capital Intermediation.
Finally, a third category of trading employs strategies that are intended to distort market prices and then take advantage of the distortion. These types of trading generate no value to anyone other than the trader pursuing the strategy. These types of trading activity may be neutral in terms of its effect on transaction costs; but they always increase Capital Intermediation costs.
Liquidity Providers and Liquidity Takers
Market participants that routinely post reliable and meaningful offers to buy or sell at the going prices are liquidity providers. Market participants that do not routinely post such prices to buy and/or sell are liquidity takers. An investor who enters the market intermittently, only when he or she needs to transact, is an obvious liquidity taker. Such an investor can be referred to as a “Value Investor.”
At high levels of market liquidity, bid and ask prices are reliable; and the difference between expected minimum sales prices and expected maximum purchase prices – the bid/ask spread - is generally thought to be narrow. This is because the difference between those prices represents the profit that should be received by a special class of market liquidity providers who are in the market only to accommodate buyers and sellers. Such a liquidity provider is called a “Market Maker.” Market Makers provide resting orders to buy and sell at prices that bracket their profit expectation. The orders are “resting” because they are made available for a period of time. Their business model is to buy at the going price and immediately sell at the going sale price, profiting from the difference.
By doing this, Market Makers provide certainty to the marketplace. For example, a Value Investor is assured that he or she can transact within a range of known prices. Diverse and robust Market Maker interest, competing to profit from the difference between the price to purchase and the price to sell, tends to narrow the difference between bid and ask prices (though other, more powerful forces can intervene).
A trader who is continuously in the market seeking to profit from short term market strategies does not have to be motivated exclusively by the prospect of profiting from difference between current buy and sell prices, as a Market Maker is. That kind of trader expects to profit from information in his or her possession predictive of changing price levels and trading strategies designed to extract the value of that information. They profit from other market participants who lack this information or the means to extract its value. These market participants can be referred to as “Information Traders.”
An empirical study of the Taiwan stock exchange concludes that “[w]e have shown that dealers do not provide liquidity to the market; instead, they trade on information.”12 The authors note that this behavior is particularly prominent during times of stress. The distinction being drawn is that the traders are not motivated by the profit potential from Market Making, a pure form of intermediation that is a low risk, stable profit business. Instead of providing liquidity in exchange for the bid/ask spread, the dealers in the study trade for the purpose of taking on positions and profiting from changes in market price. Their strategy is to profit from superior information. Information Traders only provide liquidity serendipitously (and, as pointed out in the study, unreliably, especially in stressed conditions when it is needed the most). The study is consistent with the general view that Market Making has declined in importance, being replaced by the less reliable, serendipitous liquidity provided by Information Traders. Market Making has become more risky because of persistent and serious market distortions, described in detail below.
It is obvious that a market participant is a liquidity provider only if the prices he or she quotes can be relied upon by other market participants, specifically Value Investors and those Information Traders who at the time are acting as liquidity takers. A price quote that appears on a screen is useless as a source of liquidity if it is not available when it comes time to transact. An Information Trader provides meaningful liquidity when his or her quoted prices represent levels that are reliable and meaningful to the participants who are liquidity takers. Sometimes an Information Trader provides such quotes and sometime it does not. When it is active, but not providing such quotes, it is a liquidity taker.
The following chart describes the categories of market participants.
|
Market
Makers
|
Continuously Quoting Prices to Buy and Sell to profit from Difference between Quoted Buy Prices and Sell Prices
|
Always Liquidity
Providers
|
|
Information Traders
|
Sometimes Quoting Prices to Buy or Sell
|
Sometimes Liquidity Providers and Sometimes Liquidity Takers
|
|
Value
Investors
|
In the Market to Transact at Prices Indicated by the Quotes of Liquidity Providers
|
Always Liquidity Takers
|
Information Traders and Liquidity
The differentiation between Information Trader activity that provides liquidity and that which does not is critical to understanding the markets. Information Traders represent the vast majority of volume in most markets; and they are unpredictable and therefore disruptive.
Most volume in the traded markets is attributable to Information Traders. Academic studies of actual market behaviors make it clear that much of the volume in markets generated by Information Traders represents buying and selling interest that is, at best, unreliable and, at worst, an accelerant of large price moves that are unrelated to fundamental value. This is largely a result of the sheer speed of the sophisticated Information Traders and the tremendous volume of trading they represent. In many markets, trading is dominated by Information Traders employing high-speed computers that enter offers to buy or sell according to preset algorithms. In some markets, this constitutes as much as 73% of all activity.13 This class of Information Traders is called “High Frequency Traders” or “HFTs.”
An algorithm may dictate the purchase (or sale) of large quantities of a security. But if a perturbation occurs in the market, the algorithm very often reverses the course of trading, dictating immediate and massive sales (or purchases), even though underlying cause of the perturbation was an obvious error. This happens quite frequently in the real world, sometimes causing massive market price moves based on no objectively valid information. Such a move is called a “flash crash” and has become a routine event in many markets. (The largest flash crash to date, which occurred on May 6, 2010, is discussed in detail below.)
This type of volume does not provide useful liquidity. It is unreliable and can destabilize prices rather than providing predictability. Worse, Information Trader volume can appear to a market observer to be stabilizing, but converts instantaneously and unpredictably into a destabilizing force under stressed or unforeseen market conditions. This prospect hangs over a market creating underlying uncertainty that impacts prices even when markets are stable.
Destabilization of market prices, as a result of high-speed algorithmic Information Trader activity, has become a chronic condition. The damage done to trading markets was described by Thomas Petterfry, the immensely successful founder of Interactive Brokers, a discount brokerage that was an early user of technology to transact in the markets.
It is not so much anymore that the public does not trust their brokers. They do not trust the markets. And why should they, given our showing in the last few years? To the public the financial markets may increasingly seem like a casino, except that the casino is more transparent and easier to understand.14
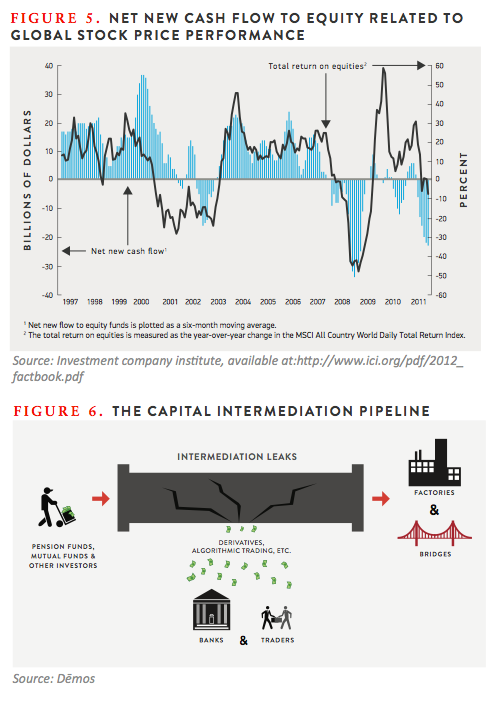
The most profound effects relate to retail investors. The data set forth in Figure 515 indicates a massive change in the behavior of retail investors as represented by inflows into equity investment funds. Retail investors historically invest more heavily as stock market prices rise. That has not been the case in recent years. This is partly related to the residual effects of the financial crisis. But it is notable that the “Flash Crash” in 2010, the most dramatic destabilization caused by high frequency trading to date and discussed below in detail, is coincident with commencement of net cash outflows despite increasing stock prices. Retail investors have not returned even though the bull market has continued.16
But the effects are not limited to the departure of retail investors from the markets. Other market participants stay in the markets, but adjust their price demands to compensate for the disruption.
Therefore, Information Trader volume in the deregulated markets sometimes lowers transaction costs and at other times causes transaction cost to skyrocket. But in all cases it is designed to extract value well in excess of the bid/ask spread for the trader who generates the volume. And even when it reduces the cost of a given transaction, if it does not, on a net cost/benefit basis, make Capital Intermediation more efficient, it serves no social benefit. The evidence discussed below strongly suggests that high-speed algorithmic Information Traders extract far more value than they add, burdening the Capital Intermediation process.
Mechanics of Value Extraction
Incremental volume that is not based on manipulative trading tactics can decrease individual transaction costs, which promotes efficiency. But social benefit from this function is achieved only to the extent the financing cost to capital consumers is very close to the price needed to induce suppliers to part with their funds. In that case, Capital Intermediation is made more efficient. Some (but not all) trading bridges the gap between the specific needs of capital consumers and capital suppliers in terms of timing and other mismatches, all for a “fee” that is determined by market activity. To the extent that this fee is as low as it can be, this type of trading constitutes socially valuable “liquidity,” in the jargon of the markets.
The prior article in this series draws a distinction between “Transaction Liquidity,” that reduces the cost of individual transactions, and “Capital Liquidity,” that assures that the spread between the price received by capital suppliers and the cost paid by capital raisers is as low as possible. Above, we discuss volume provided by Information Traders that sometimes constitutes Transaction Liquidity, and sometimes actually consumes liquidity in large and unpredictable amounts. And we identify other trading activity by Information Traders that never provides Transaction Liquidity in return for the value extracted.
This excess volume that never or only intermittently provides Transaction Liquidity, on balance, extracts more value from the capital allocation process than the value it provides to suppliers and consumers of capital.17 It is an important element of the value extraction from Capital Intermediation discussed in the prior article. (See Figure 6)
Manipulation of Market Infrastructure
The traded markets rely on a great deal of infrastructure provided by firms that compete for volume. Key among the infrastructure providers are the exchanges and other transaction-matching venues in which buyers are matched with sellers based on mutually agreeable terms, such as product definition (e.g., Apple common shares), price and quantity. These venues generate their revenues from fees based on volume. Competition is based on attracting volume.
A major criterion for traders choosing among venues is certainty that their desired transaction will be executed. Another way to say the same thing is that hey seek out liquidity. If a venue can attract large volumes from Market Makers and Information Traders, the venue will at least appear to have liquidity that will attract other fee paying customers.
Commencing with the late 1990’s, matching venues started the practice of rebating fees for large volume. Of course, this meant that the lower-volume customers of the venue had to pay more, but at least they had greater certainty of execution. The competition became so intense that in some venues the “rebates” for posting orders to buy and sell became profitable to the traders. HFTs constructed “rebate harvesting” software that was designed to implement high-volume order posting and simultaneous purchases and sales for the sole intent of profiting from the rebates.18
Even better for the “liquidity” providers entitled to rebates, venues altered their rules to allow them preferential access to transactions. In effect, they could jump the queue rather than waiting their turn.19
Apparent liquidity was a function of orders rather than transactions. Thus the firms that benefited from harvesting rebates placed many orders that they had no desire to turn into transactions. But even if an order were taken up before it was cancelled, the HFT could expect to profit from the bid/ask spreads, and the profit would be even greater since the HFT would not bear the cost of matching fees. For others, the effective transaction cost would increase. The higher than necessary fees meant that the bid/ask spread no longer told the entire story for the common market participant.
Manipulation of rebates and queue jumping distort results from trading. While Value Investors appear to benefit from greater certainty of execution, they must bear the increased cost from the churning of trading activity among Information Traders that never touches them, exemplified in its most extreme form by rebate harvesting. In terms of the efficiency of Capital Intermediation, the rebate system and the rules allowing preferential access to transactions constitute a significant transfer of value to the financial sector.
Layering and Capital Intermediation Inefficiency
Several studies have examined the phenomenon of layered financial intermediation.20 These studies have made useful observations, but their focus has been on the consequences of layered intermediation related to the immediate trigger of the financial system collapse. The principal structures examined have been from the asset-backed securities markets in which mortgages were originated, sold to large financial institutions and packaged into tranched bond offerings. The bonds were then underwritten and sold to investors, traded and finally used to create derivatives that synthetically expanded exposures. Sometimes the same bank and its affiliates originated the mortgages, assembled and packaged them, underwrote the bonds backed by the mortgages, made markets in the bonds and transacted the derivatives, profiting at each layer. These studies describe persuasively how this layering of intermediation resulted in the replication of both value extraction and risk and its accumulation within layers, all with enormous systemic impact.
The layering of intermediation is far broader than the asset-backed market. It also occurs in less structured and obvious ways. The analyses of the asset-backed market track mortgages through a linear chain of processes and examines costs directly associated with each link in the chain. The layering more broadly applicable to intermediation is less direct. Conceptually, the Capital Intermediation process is subject to the layers of transactions occurring daily in the market situated between the suppliers and consumers of capital.
This is not a structured process in which dollars can be tagged and traced through layers, but is a function of the overall market over time. Investors don’t merely buy securities and passively hold them. They invest in the market price for a given security over time. Further, they periodically replace the security by selling and acquiring another security. Valuation of an investment security and its successive replacements depends on the dynamic market price over time. Investors need to know the price at which they can sell a position, should that be necessary. That represents the current value of the position, referred to as its “marked-to-market” value.
The investor marks the position representing the securities (and their successors if they are replaced) to current market prices daily. Each day, the investor makes the decision to hold the security or to replace it. Therefore when the investor allocates a sum of money to investment, he or she is investing in a series of daily transactions (including the decision to hold the security) that are affected by the changing fundamental value of the security and its successors, but also by the market activities of others that affect daily valuation via non-fundamental forces.
When a business or government issues debt or equity, the price it receives is determined by the expected return required to induce investors to transact. If the expected return is uncertain, the price paid by the investor must be lower to compensate for uncertainty. The return may be uncertain because the business or government is risky from a fundamental value perspective. But it may also be uncertain on a market reliability basis. For example, if the prices generated by the market are unreliable or if the market lacks reliable liquidity for the execution of a transaction at the apparent price, the ongoing value is subject to price risk over and above fundamental value risk.
In the real world, a dollar of investment sometimes passes (somewhat) directly from an investor to a consumer of capital. For instance, this occurs, to some extent, in an initial public offering in which a bank buys the security from the issuer and sells it immediately to a Value Investor who proceeds to hold it. Other securities in the IPO are likely sold to Information Traders who do not put the security away for longer term investment purposes. The layered market profoundly affects even a relatively direct investment by a Value Investor in an IPO. The price of the security is established initially in a marketing process that is subject to distortions cause by HFTs and other Information Traders, among other things. The most widely known and extreme case was the chaotic Facebook IPO in May 2012 in which the NASDAQ exchange was overwhelmed by computer program-driven orders and cancellations.21 The price received by Facebook for its shares was reduced by the chaotic conditions that day and the underwriting banks lost money as well. And subsequent issuers received lower prices because the underwriters feared a recurrence of the chaos.
However, the Value Investors also price-in expected future disruptions in the secondary market for the shares they buy and hold, over and above the value extracted by Information Traders during the IPO process. Assume that there is a “Value Extraction Return Premium” attached to a security. It is set by Value Investors to offset the cost of future market disruption. When a business or government raises money in the market, it pays that premium to the Value Investors (in the form of a higher interest rate or lower share price). But the reason the Value Investors require the Value Extraction Return Premium is that they know they must pay it back to Information Traders over time as a result of unreliable valuation prior to and at the time the position is liquidated or replaced. The Valuation Extraction Return Premium ultimately is paid to Information Traders as they extract value from the market through various market activities.
The best empirical evidence of this is probably the financial sector’s increased share of GDP and profits in the economy as a whole, as described in the first article in this series. No sector of the economy is better suited to benefit from advances in information technology and quantitative analysis. Furthermore, the rise of mutual funds and other aggregated investment funds has increased the scale of investment activities. The financial sector should be able to perform the intermediation function far more efficiently than in the past. On a transaction-by-transaction basis, these advances have resulted in lower transaction spreads as markets have become more liquid and efficient. Thus, the increased share of the economy represented by the financial sector, occurring simultaneously with transaction efficiencies that have had the effect of reducing the share, indicates that a substantial portion of market activity extracts value from the Capital Intermediation process.
In addition, the CFTC-sponsored study on profitability of HFTs demonstrates persistent and substantial profitability for this large element of the trading market even though the risk taken on to earn this profit is very small.22 Consistent profit, in excess of the bid/ask spread, with very little risk means that the HFTs are extracting value based on structural, rather than fundamental, information. There is simply no other way that these conditions could co-exist. The HFTs are reaping the Value Extraction Return Premium that they caused to exist.
High Frequency Trading
High Frequency Trading has been defined as follows: “HFT refers to fully automated trading strategies with very high trading volume and extremely short holding periods ranging from milliseconds to minutes and possibly hours.”23 At the speed of HFT transaction execution, no human decision-making is possible. The decisions are driven by algorithms that dictate the placement of orders and purchases or sales based on observed market conditions.
Undoubtedly, some algorithmic trading is executed by individuals, but it is an essential element of automated, high frequency trading. Some of the specific tactics embedded in algorithms can only be implemented in the automated execution mode, particularly if they involve multiple bids or offers designed to elicit reactions from other market participants that provide intelligence as to motivations and position size.
A computer driven trading operation enslaved to an algorithm is like a “trader-bot,” intended to act just like a human trader but at high speed. As we shall see, this intent cannot be fulfilled because the flexibility of algorithms is always more limited than a human’s. The entire concept is based on information asymmetry. An HFT system is able to observe and act on patterns in the market faster than others. It may also use its speed to induce behaviors by sending signals that are misinterpreted by market participants. But, in all events, HFT relies on the ability to perceive and accurately assess patterns.
Software, however speedy, is limited in terms of perception. Think of the “CAPTCHA” anti-spam system in which the forms of letters and numbers are altered. A human can interpret the correct symbols. But the slight alterations baffle sophisticated computers. The securities and derivatives trading environment is infinitely more complex than six letters and numbers. Nuanced interpretation is a constant problem for HFT with costly consequences to the economy.
As described above, HFT is pervasive, especially in the equities markets where it has been estimated that it represents 73% of all volume.
HFT is also a powerful device. On August 1, 2012 an employee of Knight Capital accidentally loaded outdated software into Knight’s HFT system (that controlled trading in a proprietary Dark Pool – see below) causing Knight to lose $440 million in 45 minutes.24
Clearly, HFT is the dominant form of Information Trader activity and a likely source of value extraction from the Capital Intermediation process.
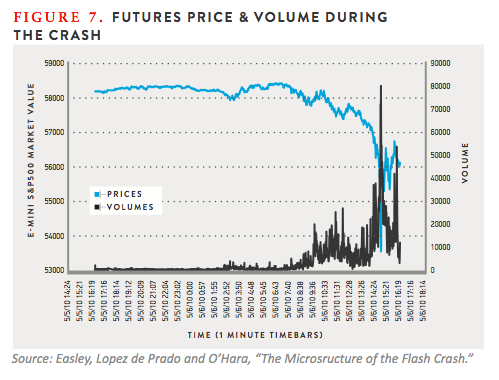
The inquiry into the “Flash Crash” of May 2010 resulted in a study of market dynamics during that event by Andrei Kirilenko, the Chief Economist of the Commodity Futures Trading Commission, and others.25 On May 6, 2010, the Dow Jones Average plunged over 1000 points in a matter of minutes (See Figure 7). This represented approximately $1 trillion of market value.26 The market soon recovered, but the mayhem caused by the rapid moves was substantial.
The culprit most cited was a mutual fund whose algorithms governing trading tactics (inadvertently, perhaps) triggered a $4 billion sale of stock without regard to price. I happened to be watching CNBC during the episode and a commentator almost immediately said that an error must have sent the algorithms spinning out of control. He was like the human reading the “CAPTCHA” letters and numbers. But like the spam “bots” the HFTs simply sold until there was nothing left to sell because they could not interpret the data that did not fit into pre-programmed patterns.
The Kirilenko Flash Crash study targets the role of algorithmic, high frequency trading as it interacted with the initial aberrant price move caused by the mutual fund. The study contrasts behavior of “HFTs” and “Intermediaries,” as defined therein. Intermediaries, that is to say Market Makers, tended to moderate the price moves because they did not instantaneously exit the markets, dumping inventories on the way out. In contrast, HFTs exacerbated the Flash Crash by reacting to price moves automatically as their systems responded to unusual market moves in ways dictated by algorithms. Eventually, the Market Makers were “run over” by the HFTs in the stampede and did not return to the market until it stabilized for fear of incurring further losses. Dr. Kirilenko has described an “ecosystem of market participants” that interacted through algorithms and high-speed trading systems to create a serious stock market anomaly.27
A separate study of the Flash Crash describes “order flow toxicity” as a driving force.28 Toxicity induces a herding response and becomes a feedback loop. Trades in which liquidity providers continuously lose money eventually kill all liquidity. In this way, HFTs become liquidity consumers. Because most HFT programs are designed to be net flat at the end of the day (the idea is to buy and sell rapidly, not to hold securities or derivatives, especially overnight), panic ensues creating more toxicity and so on.
These two studies demonstrate that there is a great distinction between volume and market liquidity. For example, as the Kirilenko Flash Crash study shows, HFT activity can amplify the price effect of a given market event. Prior to the event, market participants misperceive the volume generated by the algorithmic traders as stabilizing liquidity. However, the systems are rigged to exit the market and dump inventories at the worst possible time, in terms of stability. When the event occurs, the “stabilizing liquidity” converts instantaneously into trading that consumes massive amounts of liquidity. The perceived stabilizing liquidity is an illusion, an even more disruptive circumstance than if the stabilizing liquidity had never existed at all.
The point is made eloquently by Eric Hunsader, the founder of Nanex, a high speed market date feed service.
In summary, HFT algos reduce the value of resting orders [for example, a Market Maker’s orders] and increase the value of how fast orders can be placed and cancelled. This results in the illusion of liquidity. We can’t understand why this is allowed to continue, because at the core, it is pure manipulation.29
The statement was made in an article referencing a specific algorithm known as “the Disruptor” that is specifically intended to disrupt the stabilizing order behavior of a liquidity provider.
The 2010 Flash Crash was a dramatic example of events that occur daily in the markets. Mini-flash crashes distort markets repeatedly, causing prices to be unreliable and volatile. This has been validated by a recent study that finds that high frequency trading is positively correlated with stock price volatility after controlling for fundamental volatility and other exogenous determinants.30 That is to say that all volatility caused by factors other than the HFT activity is filtered out and a strong correlation between HFT activity and the remaining volatility is found and recurs frequently in each trading day. The study identifies intra-day volatility that is actually a series of mini-flash crashes.
But what about the time periods in which HFTs are not exiting the marketplace precipitously. It is notable that a number of studies have concluded that high frequency trading provides benefits.31 However, these focus on the narrowing of bid/ask transaction spreads that are a consequence of increased volume. They identify the value of Transaction Liquidity. This is a reasonable conclusion, if the focus is narrowed to that level (though incomplete given the Kirilenko Flash Crash study).
The recent study of HFT trading profits sponsored by the CFTC reaches a very different conclusion.32 Using data from the equities futures market, a key sector of HFT equities trading, the study finds that the level of trading profits from HFT is extraordinarily high in relation to the risk taken to achieve these profits and that the profit levels are persistent. It finds that the profits are generated from other market participants over periods of seconds or minutes. Higher levels of profit are generated from smaller Value Investors, Market Makers and Information Traders than from larger institutional investors.
These findings persuasively suggest that HFT does not merely provide liquidity to the market, but rather extracts value well beyond the value of liquidity provided. Importantly, since the profitability of HFT is disproportionate to the risk being taken, HFT is an opportunistic activity whose presence in the market is primarily extractive.
Another study focuses on the effect on the narrower class denoted “liquidity traders,” who are merely intending to make investments.33 These traders are referred to herein as Value Investors. It also discusses the effect on HFT on “professional traders,” referred to herein as Market Makers and Information Traders whose activities establish bid/ask spreads. The study characterizes the basic purpose of HFT as the use of speed to insert the HFT trader in between Value Investors and Market Makers. The idea is to buy from (or sell to) a Value Investor and instantaneously sell to (or buy from) a Market Maker. The conclusions of this study are described as follows:
We analyze the impact of high frequency trading in financial markets based on a model with three types of traders: liquidity traders (LTs), professional traders (PTs), and high frequency traders (HFTs). Our four main findings are: i) The price impact of liquidity trades is higher in the presence of the HFTs and is increasing with the size of the trade. In particular, we show that HFTs reduce (increase) the prices that LTs receive when selling (buying) their equity holdings. ii) Although PTs lose revenue in every trade intermediated by HFTs, they are compensated with a higher liquidity discount in the market price. iii) HF trading increases the microstructure noise of prices. iv) The volume of trades increases as the HFTs intermediate trades between the LTs and PTs. This additional volume is a consequence of trades which are carefully tailored for surplus extraction and are neither driven by fundamentals nor is it noise trading. In equilibrium, HF trading and PTs coexist as competition drives down the profits for new HFTs while the presence of HFTs does not drive out traditional PTs.
In other words, bid/ask spreads are not widened, but absolute price levels are altered to the detriment of the Value Investors, especially large institutional investors that transact large positions. Since Value Investors make their decision to invest based on return on funds invested, prices must adjust to compensate for the lost value. In normal market conditions, Market Makers and liquidity providing Information Investors are unaffected. (It should be noted, however, as seen in the Kirilenko Flash Crash study, volatility caused by HFTs ultimately drives out Market Makers.) The other studies finding HFT to be benign may not be wrong except that they measure only the bid/ask spreads, not the overall cost to Value Investors of HFT.
Pro-Active Algorithmic Strategies
An analysis of the algorithms often used by Information Traders provides further insight into the phenomenon of value extraction. Trading algorithms are, of course, constructed by individuals. They reflect strategies that an individual trader could rationally pursue for profit. As a result, a known algorithmic tactic provides insight into broader market behavior.
Algorithmic trading is not limited to passive monitoring of market moves, the activity described in the Flash Crash studies. Some algorithmic strategies are far more aggressive. The algorithms are proprietary so there is no way to judge how many are aggressive and how aggressive they are. Nonetheless, aggressive tactics can be used to secure certain profits. It is safe to assume that their use is widespread.
The best indication of the level of aggressive algorithmic strategies is provided in a study of the practice of “Quote Stuffing.”34 This is a tactic in which HFTs flood an exchange or other transaction-matching venue with quotes to buy or sell in order to slow down the venue’s processing times. HFTs do this so that aggressive tactics can be implemented without intervention from other traders. They also employ Quote Stuffing to slow down one exchange so that price differences between that exchange and another that is operating normally can be exploited.35 Therefore, when quote stuffing occurs, it is highly likely that an aggressive tactic is underway. The study reaches the following conclusion:
We find that quote stuffing is pervasive with several hundred events occurring each trading day and it impacts over 74% of US listed equities. Our results suggest that, in periods of intense quoting activity, stocks experience decreased liquidity, higher trading costs and increased short term volatility.
Quote stuffing operations have been estimated to “consume 97% of computer system resources that the whole market has to bear.”36
Therefore, aggressive algorithmic programs powered by high speed technology are constantly deployed to extract value from the markets using tactical trading that is implemented in milliseconds.
Trading tactics are dictated by information. Some information is in the form of earnings reports, crop yields, political events and similar data. These types of information are directly related to the fundamental value of businesses and assets and are used to adjust the price of securities and derivatives to objectively sound levels. (As discussed above, fundamental value refers to the intrinsic value of a stock, bond or derivative based on available information.37) It has long been known that asymmetrical distribution of information that is directly relevant to fundamental value can distort the intermediation function of the markets.38
Another type of information relates to non-fundamental motivations that are predictive of market behavior by individual participants in a market. Tactics based on this type of information are driven by the expected short-term behavior of other market participants based on specific stimuli, not based on generally available information on supply and demand and company data. If, for example, a trader knows that a buyer who is relatively insensitive to price is currently in the market, he or she can corner the market for the specific category of securities sought by the buyer and exploit this price insensitivity.
This type of asymmetry can affect prices broadly as well as securing profit for an algorithmic trader in a single set of trades. This happens when the trading provides misleading signals as to fundamental value. The signals are generally not intentional; rather they arise from the perceptions others in the market have when they see the trades executed by an algorithmic trader using aggressive tactics.
Here is how it works: There is an assumption that trading is motivated by views on fundamental value. Traders must operate under this assumption to protect themselves from unforeseen large price moves based on fundamental value information. As a result, a reported trade will be interpreted as a statement about the buyer’s or seller’s perception of fundamental value, at least until other information contradicts this assumption. A trader with a view as to fundamental value will be forced to question his or her view when he or she sees a trade that is not in line with his or her perception of fundamental value. Trading behavior based on non-fundamental information is indistinguishable from trading based on fundamental information to other market participants (unless the trader is using software designed to detect an HFT tactic, which sometimes happens). Trading against the non-fundamental trader entails risks that he or she has superior fundamental information, and since no trader can afford infinite losses, the fundamental trader will, at a minimum, change his or her price of indifference or perhaps exit the market.39
Trading algorithms typically rely on non-fundamental forms of information that are pertinent for only a short period of time (in contrast with fundamental information, which has a longer “shelf-life.”). This information can represent short-term profit opportunities for a nimble high frequency trader, especially if it is a well-capitalized bank. Aggressive strategies target individual market participants (and sometimes individual exchanges or other trading venues) rather than seeking profit from overall market information.
This is completely consistent with the Zhang study, described above in the context of the correlation between HFT and volatility. The other primary finding in the study is described as follows: “”I find that high-frequency trading is negatively related to the market’s ability to incorporate information about firm fundamentals into asset prices. Stock prices tend to overreact to fundamental news when high-frequency trading is at high volume.”40
Hunting Whales
A classic aggressive strategy involves hunting and trapping “whales.” It is a good example of aggressive HFT strategy.
It is initiated by a “pinging” operation. This involves placing multiple orders designed to detect the presence of a market participant with a large position that it is in the process of accumulating or liquidating. “High frequency traders employ pattern recognition software to detect large institutional orders sitting in dark pools or other liquidity venues.”41 When it pings, the algorithmic trader places orders to buy and/or sell in an array of prices inside the bid/ask spread. If the potential target market participant starts walking through the orders, it becomes clear that a large position is in play that could consume all of the liquidity on one side of the market (bid or ask). Traders sometimes refer to the potential target as a “whale.” Often, a whale intends to buy or sell a large block for structural reasons and is relatively less sensitive to price than other buyers and sellers. If the trader’s order strategy reveals price insensitivity, the whale becomes a target.
For example, an investment fund might have experienced large redemptions from its investors that require liquidation of investments under the terms of the fund. The fund is compelled to sell promptly and is relatively insensitive to price. It is a properly motivated whale.
Once a whale is sighted and its price insensitivity is confirmed, it becomes clear that dominating the other side of the market will give the algorithmic trader control of the bid/ask pricing mechanism. In our example, the algorithmic trader would meet the offers of all of the bidders for the shares that the whale seeks to sell, becoming the sole and dominant purchaser in the marketplace. The algorithmic trader establishes a narrow band of absolute market power controlling the particular securities or derivatives that the whale seeks to buy or sell. The whale will be compelled to either abandon the market or transact at the price demanded by the algorithmic trader.
In an instant, the algorithmic trader cancels all “pinging” orders and buys the market in order to extract as much value as possible. It will also likely flood the trading venue with orders to create congestion and slow other market participants who are also watching and might intervene. The whale must transact at the price required by the algorithmic trader to accumulate or liquidate the position, as appropriate. When the transaction with the whale is accomplished, the quote stuffing orders are all cancelled.
In the final step, the algorithmic trader liquidates the position acquired from the whale immediately, but at a new bid/ask spread reestablished at market levels that are more competitive. The algorithmic trader intends that its profit from moving the bid/ask spread to take advantage of the whale’s price insensitive motivation will exceed the potential loss from the operation if the whale detects that it is being taken advantage of. For this reason, the strategy is most useful if all of the steps can be executed quickly, before detection is possible.
By displacing the entire side of a bid/ask spread, the HFT eliminates all meaningful depth of buying or selling interest for a short time period. As a result, the observed spread in the market is meaningless. Various studies that examine the narrowing of bid ask spreads in the modern marketplace miss the crucial point that HFT tactics like the one described are missing the point that the narrowing is an illusion.42 If the study draws the conclusion that HFT narrows spreads, it is simply misleading.
This is only one type of aggressive trading strategy among many that are more elaborate. However, it is a clear example of an activity that is designed to extract value from the daily, routine functioning of a securities or derivatives market. It provides no value to the intermediation between the suppliers of capital and consumers of capital.
Thus, for purposes of efficient Capital Intermediation, the question of execution at a narrow bid/ask spread is by no means the entire story. The far more important issue is the mid-market price level around which the bid and ask prices are spread. This mid-market price point has the appearance of the true fundamental price. When prices shift, it is impossible to determine if it is because of fundamental information or because of trading strategies based on non-fundamental market information. Market participants are biased to assume that it must indicate a change in the market view of fundamental value in order to avoid risk. Perceptions are altered to the detriment of Value Investors and Information Traders that are out of the information loop and these perceptions are unfounded, in terms of fundamental information.
Trading that alters that fundamental price level extracts profit without enhancing broad productivity. In this way it extracts value from the Capital Intermediation system and does not constitute Capital Liquidity.
Although high frequency and algorithmic trading are powerful forces in many markets, their influence varies. However, this form of trading provides insights into the types of trading activities that are used, with varying degrees of automation, to extract value from the Capital Intermediation process making it less efficient. Nothing is more automated and efficient than HFT. Firms spend millions of dollars to move servers closer to the servers of exchanges, simply to reduce transaction execution times by nanoseconds.43 This efficiency brings great value to the HFTs. Yet, despite this efficiency, HFT adds to the cost of Capital Intermediation.
This specific example of value extraction using an HFT strategy described above is the tip of the iceberg in terms of the variety of trading strategies. This article is not intended to catalogue trading tactics, but to demonstrate that value extraction must be occurring. Because HFT algorithms are proprietary, there is no way to estimate the overall value extracted by the practice. Nonetheless, algorithmic trading is widely practiced by many types. The extracted value must be very large.
Dark Pools and Internalization
One measure of the value extracted by algorithmic and high frequency trading is the length to which market participants that might be the targets of their tactics go to avoid them. Many HFT tactics are designed to function in exchange environments and in other Lit Venues. Bid/ask spreads and transaction prices are made available so that the HFTs have information sources to mine and interpret. In order to protect themselves from predatory HFTs, many institutional investors employ algorithmic tactics operating at high speeds as countermeasures. They also sometimes hide from the stalking predators. The places they hide are called Dark Pools. These are environments, often operated by large banks, in which bids and offers are “matched” when their prices cross based on programs that drive the Dark Pool. It was originally assumed, therefore, that no predatory HFT can “see” the market participant’s activities before the trade he or she wishes to transact is consummated.44
Institutional investors are often the targets of HFTs. They transact in large blocks that can challenge available liquidity on any trading venue. Investment funds are also required to buy or sell positions according to time constraints because of rules governing the management of the investors’ money. Institutional investors can be less driven by price than by the need to buy or sell large positions because of these factors.
The use of Dark Pools involves a trade-off. While the investor is less susceptible to aggressive gaming tactics of HFTs, he or she has no information on the buying and selling interest inside the Dark Pool. There is no visible bid/ask spread in the Dark Pool. The investor has little relevant information on the depth of buyer or seller interest at a given price. The trade-off for a more secure trading environment is that the prospect of actually completing a transaction at a given price is uncertain.
Lit Venues are trading venues in which information about bids and offers is freely available. It is this information that is used by HFTs to first detect large institutional investors, or whales, and then to distribute market information synthesized as by HFT algorithmic tactics to extract value from whales.
Dark Pools became popular in the last few years because the information flows are limited. The trading rules for the venue simply provide less data so that detection of whales is more difficult. There are three categories of Dark Pools:45
- Category 1 – The Dark Pools match trades at current prices derived from Lit Venues. For example, a Dark Pool might allow a participant to enter an order at the National Best Bid and Offer price, which is derived by a survey of multiple venues for the best price. There is no assurance for the participant that the Dark Pool has sufficient matching interest to fulfill the order, either fully or in part.
- Category 2 – The Dark Pools act as an undisclosed limit order book, meaning the participant places an order to buy or sell up to a quantity at a determinable price. That price is midpoint price of the market that the Dark Pool represents. For example, a participant can place an order to buy up to 1,000 shares of Company X at the bid/ask midpoint up to a price limit stated in the order. The price then moves as the bid/ask prices move around until the order is fulfilled or cancelled. Often, in Category 2 Dark Pools, the sponsor of the pool can participate as a proprietary trader in the pool. These types of Dark Pools are operated by Goldman, Citi, Morgan Stanley, UBS and Credit Suisse, for instance.
- Category 3 – The Dark Pool is an electronic market maker with the sponsor acting as the market maker. If a participant uses the Dark Pool, it takes the price provided by the sponsor. This is the type of Dark Pool sponsored by Knight Capital, mentioned above. Since the sponsor represents the sole market maker, it is clear how loading outdated software could cost half a billion dollars within a few minutes as occurred with Knight.
The first cousin of Dark Pools is a less formal practice by large broker-dealers known as “internalization.” A customer gives the order to a broker-dealer who matches it with another customer or set of customers. In terms of result, it is similar to the third category of Dark Pool.
As described above, the principal cost of using a Dark Pool or internalization is that the participant placing the order is much less certain that its order will be fulfilled than if it uses a Lit Venue which informs him or her of the depth of the market. For more price-volatile securities, the risk of non-fulfillment is higher because of the velocity and amplitude of price movements.46 Therefore, they are more popular for less volatile securities.
When transactions are matched in Dark Pools or via internalization, the price and quantity data are not disseminated in the markets. This is a concern because data of this type are important to “price discovery” – the ability of market participants to process trading activity data in order to form an opinion regarding market price. It has been estimated that about one-third of equities trading now takes place in Dark Pools or via internalization.47 The information generated by trading in Lit Venues is therefore materially incomplete.
Ironically, Dark Pools have now become a haven for HFTs. At first, HFTs deployed ever more sophisticated pattern recognition software to Dark Pools to detect whales and similar market participants despite the cloaking afforded by the venues. Now, Dark Pools are popular because they are out of the sight of regulators and because their complex cross matching algorithms can be gamed (or, even worse, the Dark Pool sponsors use them to give preference to HFTs that generate large volumes). Institutional investors use the Dark Pools to get access to the volumes of trading. If true, this decrease in transparency damages the integrity of the market.
This is a very practical concern. Since the Flash Crash in May 2010, individual investors, mostly acting through investment funds, have departed the equity markets in large droves. It is widely believed that this exodus has been motivated by the declining integrity of the market as a result of HFT activity, exacerbated by the rise of Dark Pools.48
A recent study comes to a completely different conclusion.49 The study models behavior of types of market participants who might use a Dark Pool or a Lit Venue. The algorithms employed in the study are depictions of a logical foundation that would govern behavior in the environment constructed by the author. In the author’s synthesized world, informed market participants are more likely to use a Lit Venue because they avoid the risk of non-execution and the potential cost of being subject to price tactics is low since they are highly informed. Therefore, Dark Pools are used more by low-information market participants, whom he refers to as “liquidity traders.” The price discovery afforded by the Lit Venue is a better quality because the participants are, on average, better informed.
The concern with the study is that its foundation is an assumption as to the motivation of the two types of traders.
My inquiry into dark pools builds in a simple model of strategic venue selection by informed and liquidity traders. Informed traders hope to profit from proprietary information regarding the value of the traded asset, whereas liquidity traders wish to meet their idiosyncratic liquidity needs. [Emphasis added.]
To the author, it is the information on which the informed traders act that causes their trades to provide a purer form of price discovery. The study fails to consider that the informed traders are very likely to be acting on non-fundamental information, analyzing data to discover the precise short-term motivations of other market participants. The informed trader might then use market-price manipulative tactics to exploit these motivations. This is not activity based on the “value” of the traded asset in any meaningful sense. It is exploiting idiosyncratic motivations behind transactions that have nothing to do with fundamental value. In this sense, Dark Pools and internalization concentrate the manipulative behavior embedded in aggressive HFT tactics in the Lit Venues.
Contrary to the Zhu study, logic suggests strongly that Dark Pools and internalization are detrimental to price discovery. The Zhu study’s reliance on elaborate gaming based on fundamental flawed assumptions is unlikely to be appreciated by policy makers. The elegant quantitative analysis it uses is seductive to less critical audiences, particularly those who may be susceptible to the influence of the financial services lobbyists. It is a particularly dangerous reference piece unless it is countered by others from the academic community.
Conclusion
The increasing inefficiency of the Capital Intermediation process is in part attributable to the trading practices of HFTs, which generate high trading volume and no investment. The cost to the system is generated by several factors. First, the illusion of market liquidity provided by HFT volume leads to the inherent instability of market pricing mechanisms. In addition, aggressive HFT tactics mislead market participants in terms fundamental price. Finally, Dark Pools, trading venues that exist because of HFTs, impair price discovery.
All of these distortions extract value for the HFTs. Investors pay the cost initially because their investments are less valuable in conditions of chronic price distortion. However, investors must compensate for the additional cost that results from the extracted value by adjustment of price. This price adjustment is paid for by the consumers of capital. Thus, the Capital Intermediation process is made more costly and inefficient.
ENDNOTES
- Fundamental value refers to the intrinsic value of a stock, bond or derivative based on available information. In the context of a share of stock: “Fundamental analysis entails the use of information in current and past financial statements, in conjunction with industry and macroeconomic data to arrive at a firm’s intrinsic value.” Kothari, S., “Capital Markets Research in Accounting,” Massachusetts Institute of Technology – Sloan School of Management, March 2001 available at http://papers.ssrn.com/sol3/papers.cfm?abstract_id=235798.
- Golub, A., “Overview of High Frequency Trading,” European Community Seventh Framework Program, April 2011, available at https://fp7.portals.mbs.ac.uk/Portals/59/docs/MC%20deliverables/WP27%20A%20Golub%20paper%201_IntroHFT.pdf.
- Iati, R., “High Frequency Trading Technology,” The Tabb Group, 2009, available at http://www.tabbgroup.com/PublicationDetail.aspx?PublicationID=498.
- Mr. Patterson based the 22 second estimate on an interview of Professor Michael Hudson of the University of Missouri at Kansas City (available at http://www.therealnews.com/t2/index.php?option=com_content&task=view&id=31&Itemid=74&jumival=6000#.UQVySejaicY). The author spoke with Professor Hudson regarding this estimate. He reported that he had been told by a number of trading professionals that this was the case. He then examined data from the New York Stock Exchange and the Chicago Mercantile Exchange and compared shares of actively traded stock outstanding with activity in those shares on the exchanges. He concluded that the data were consistent with and reinforced the 22 second estimate.
- Baron, M., Brogaard, J. and Kirilenko, A,. “The Trading Profits of High Frequency Traders,” November 2012, available at http://conference.nber.org/confer/2012/MMf12/summary.html.
- SIFMA, US Bond Markets Average Daily Trading Volume and Issuance in the US Bond Markets, available at http://www.sifma.org/research/statistics.aspx.
- International Swaps and Derivatives Association, Over the Counter Derivatives Data Sources, available at http://www.isda.org/statistics/pdf/ISDA-Market-Survey-historical-data.pdf.
- Philippon, T., “Has the U.S. Finance Industry Become Less Efficient,” May 2012, available at http://pages.stern.nyu.edu/~tphilipp/research.htm.
- More precisely, it is the base cost of a transaction. As one might expect, customers are charged any number of fees by broker/dealers as “add-ons” for specific services provided.
- Jens Dick-Nielsen, Peter Feldhutter, and David Lando, “Corporate Bond Liquidity Before and after the Onset of the Subprime Crisis,” May 31, 2011, available at http://papers.ssrn.com/sol3/papers.cfm?abstract_id=1364635
- Many securities and derivatives trade without market based bid/ask spreads. However, the counterparty is typically a sophisticated financial institution that prices the instrument, often on a disaggregated basis and often based on modeled bid/ask spreads based on price correlated liquid instruments. Leaving aside the prudency of engaging in such a business, the underlying principles are the same.
- Chae, J., and Wang, A., “Who Makes Markets? Do Dealers Provide or Take Liquidity?,” August 2003 p30 available at http://papers.ssrn.com/so13/papers.cfm?abstract id=1364635.
- “High Frequency Trading Technology: A Tabb Anthology,” Tabb Group, 2009, available at www.tabbgroup.com/PublicationDetail.aspx?PublicationID=505&MenuID=13&ParentMenuID=12&PageID=8.
- Patterson, S., “Dark Pools,” 2012, at page 293
- Investment Company Institute, “2012 Investment Company Fact Book,” available at http://www.ici.org/pdf/2012_factbook.pdf.
- Popper, N., “Stock Trading Is Still Falling After ’08 Crisis.” New York Times, May 6,2012, available at http://www.nytimes.com/2012/05/07/business/stock-trading-remains-in-a-slide-after-08-crisis.html?pagewanted=all&_moc.semityn.www.
- Excess volume is different from “excess liquidity” which refers to availability of cheap money, as a result of accommodative monetary policy. See Ruffa, R., and Stracca, L., ”What is Global Excess Liquidity and does it Matter?” November 2006, available at http://ssrn.com/abstract_id=942737. Excess liquidity can induce greater trading volumes, however.
- Federspiel, F,, and Berkely, A., “High Frequency Trading and the Evolution of Liquidity in US Equity Markets,” August 2009, available at http://www.advancedtrading.com/exchanges/high-frequency-trading-and-the-evolution/219401479.
- Patterson at page 159.
- Hyun Son Shin, “Financial Intermediation and the Post Crisis Financial System,” June 4. 2009; Tobias Adrian and Hyun So Shin, “The Changing Nature of Financial Intermediation and the Financial Crisis of 2007-2009,” Federal Reserve Bank of New York Staff Report, March 2010.
- Demos, T., “NASDAQ ‘Embarrassed’ Over Facebook IPO,” Financial Times, May 20, 2012, available at http://www.ft.com/intl/cms/s/0/83fc3c2a-a2bb-11e1-826a-00144feabdc0.html#axzz27c0MPuQZ.
- Baron, M., Brogaard, J. and Kirilenko, A,. “The Trading Profits of High Frequency Traders.”
- Zhang, F., “High Frequency Trading, Stock Volatility, and Price Discovery,” December 2010, available at http://papers.ssrn.com/sol3/papers.cfm?abstract_id=1691679.
- Jarzemsky, M and Russolillo, S., “’Knight’ mare Triggered Volume Plunge at Knight Capital Dark Pool,” Wall Street Journal, September 25,2012, available at http://blogs.wsj.com/marketbeat/2012/09/25/knightmare-triggered-volume-plunge-at-knight-capital-dark-pool/.
- A. Kirilenko, A. Kyle, M. Samadi and T. Tuzun, “The Flash Crash: The Impact of High Frequency Trading on an Electronic Market,” May 2011 available at http://papers.ssrn.com/sol3/papers.cfm?abstract_id=1686004.
- Easley, D., Lopez de Prado, M. and O’Hara, M., “The Microstructure of the ‘Flash Crash,’” The Journal of Portfolio Management, Vol. 37, November 2010, available at http://papers.ssrn.com/sol3/papers.cfm?abstract_id=1695041.
- Presentation of Dr. Andrei Kirilenko, Commodity Futures Trading Commission Technical Advisory Committee Roundtable, October 12, 2010.
- Easley, D., Lopez de Prado, M. and O’Hara, M., “The Microstructure of the ‘Flash Crash,’” November 2010, available at http://papers.ssrn.com/sol3/papers.cfm?abstract_id=1695041.
- Hunsader, E, “Enough Already!” August 8,2011 available at http://www.nanex.net/Research/EMini2/EMini2.html.
- Zhang, 2010.
- See, for example, Hendershott, T., and Menkveld, A., 2010, Price Pressures, WFA 2010 Paper; Hendershott, T., and Riordan, R., 2009, Algorithmic Trading and Information, Working Paper.
- Baron, Brogaard and Kirilenko, “The Trading Profits of High Frequency Traders.”
- Cartea, A. and Penalva, J., “Where is the Value in High Frequency Trading?,” December 2011, available at http://papers.ssrn.com/sol3/papers.cfm?abstract_id=1712765.
- Egginton, J., Van Ness, B. and Van Ness, R., “Quote Stuffing,” March 2012, available at http://papers.ssrn.com/sol3/papers.cfm?abstract_id=1958281. Tactics that exploit the price differences between trading venues caused by differing data processing speeds is called “latency arbitrage,” revering to latent information anomalies.
- Id.
- Gai, J., Yao, C., and Ye, M., “The Externalities of High-Frequency Trading,” August 2012, available at http://papers.ssrn.com/sol3/papers.cfm?abstract_id=2066839.
- Kothari, S., “Capital Markets Research in Accounting.”
- Leyland, H and Pyle, D., “Informational Asymmetries, Financial Structure, and Financial Intermediation,” The Journal of Finance, May 1977.
- See Bloomfield, R., O’Hara, M. and Saar, G., “How Noise Trading Affects Markets: An Experimental Analysis,” May 2007, available at http://rfs.oxfordjournals.org/content/22/6/2275.abstract.
- Zhang, 2010.
- Zhang, 2010.
- Patterson at pages 283-4.
- Cyrus Sanati, “Sorry, SEC, Fast Trading on Wall Street is Here to Stay,” Fortune, February 28, 2012, available at http://finance.fortune.cnn.com/2012/02/28/high-frequency-trading-sec/
- That does not mean that the activities go undetected. HFTs routinely deploy their pattern recognition software to ferret out large Value Investor activity in Dark Pools. Zhang, 2010.
- Zhu, H., “Do Dark Pools Harm Price discovery?” July 2012 available at http://www.mit.edu/~zhuh/Zhu_darkpool.pdf.
- Ye, M., “Non-Execution and Market Share of Crossing Networks,” November 2010.
- Tabb, Larry, Morgan, Cheyenne, The Tabb Group, “Tales from the Dark Side: Out of Sight but Very Much in Mind,” April 9, 2012.
- Neiderbauer, D., (CEO OF NYSE Euronext), “It’s Time to Bring Dark Pools into the Daylight,” Financial Times, July 4, 2012.
- Zhu, Haoziang, “Do Dark Pools Harm Price Discovery?” July 2012.