On Two-Year Anniversary of Blow To VRA, New Evidence That Voter ID Laws are Racially Biased
As we near the two-year anniversary of the Supreme Court gutting the Voting Rights Act and the subsequent failure of Congress to restore it, Demos has found new evidence of racial bias in the passage of voter ID laws. Two weeks ago I put forward evidence that racism was tied with stringent voter ID laws. Since then, I’ve uncovered more evidence. My original case was based on a simple fact: in 2014, whites in the states with the most stringent voter ID laws were far more likely to have racist views about Black people. I supported this data with evidence from Keith Bentele and Ian Vandewalker that anti-black stereotyping strongly predicted the introduction of restrictive voting laws*. To further support the idea that racism is tied with voter ID laws, I combined data from 2010 with the data from 2014.
By examining differences between 2010 and 2014 we can get a sense for how the 2012 election and then the 2013 decision striking down the pre-clearance provision of the VRA has affect voter ID laws. I examine two measures: first, the number of states with a photo-ID, second the number of states with a strict photo ID law.** Before pulling in race data, I find that the number of photo ID laws increased dramatically between 2010 and 2014, from 10 in 2010 to 17 in 2014 (the number of strict laws increased from 2 to 8).
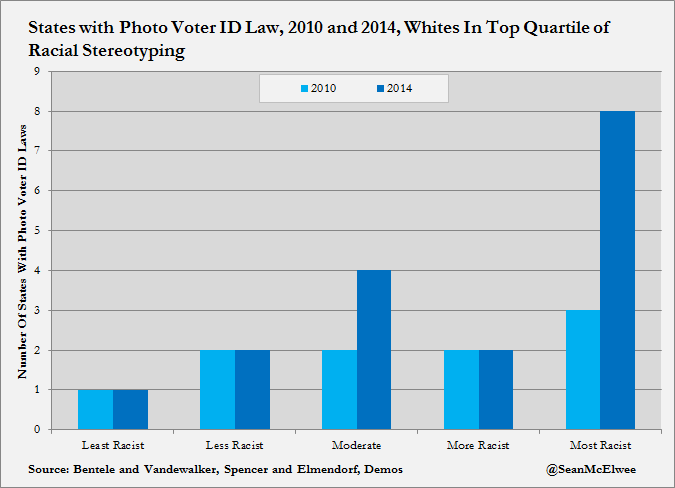
I broke states into five groups, based on the share of whites in the top quartile for racial stereotyping. As the chart below shows, only 1 state in the bottom quintile for racial stereotyping had a voter ID law in either 2010 or 2014 (Idaho). However, in 2010, 3 states in the top quintile for racial stereotyping did. By 2014, all but two states in the top quintile for racial stereotyping had passed a voter ID law. Given how important legislative control and other factors are to the passage of legislation, this fact is stunning.
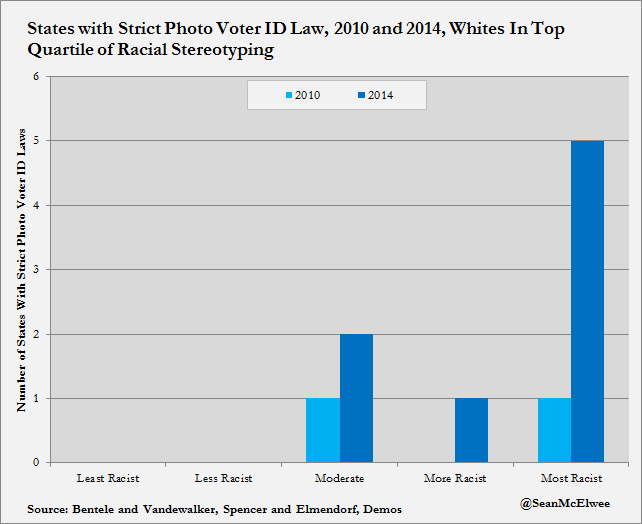
Next I measured strict photo voter ID laws, and find an even more stunning result: of the 8 states with a strictly enforced voter ID law, none are in the bottom half of racial stereotyping.
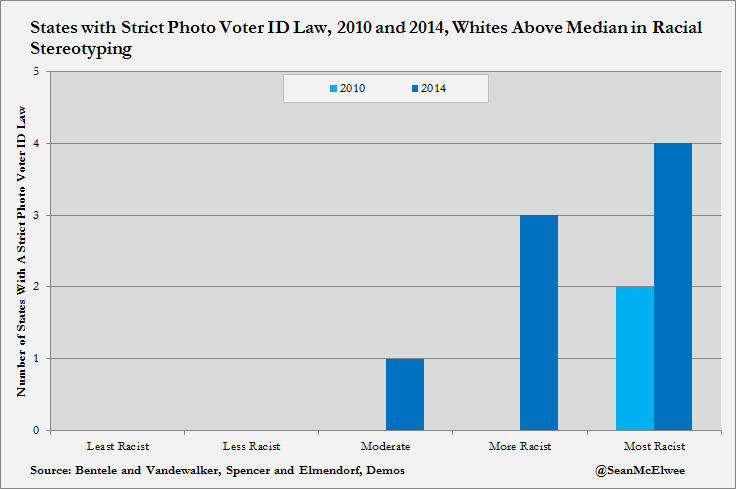
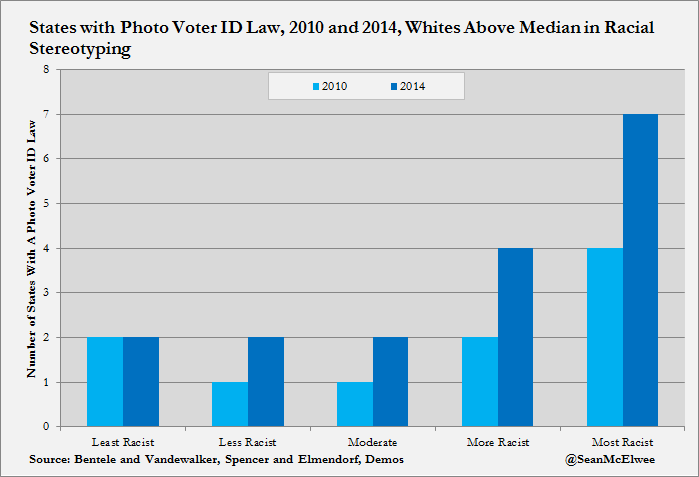
To test whether this might be due to measurement sensitivity, I re-ran the numbers using a different measure: whites above the median for racial stereotyping. This does even does not mitigate the problem: the least racist states remained basically the same between 2010 and 2014, while the most racist states ramped them up.
Finally, I ran the numbers using anti-Black attitudes across all non-Black people in the state. This too did little to change the results. Voter ID laws are racist.
*Vandewalker and Bentele use a slightly different measure of racial stereotyping, still from Elmendorf and Spencer. I used % of whites in the top quartile of racial stereotyping, they use % of total population in the top half of racial stereotyping.
** This includes some laws which have been stalled by courts - however, the goal is to see intent, and passed laws indicate intent. The difference between strict and non-strict laws are defined by the National Council of State Legislatures as follows:
Non-strict: At least some voters without acceptable identification have an option to cast a ballot that will be counted without further action on the part of the voter.
Strict: Voters without acceptable identification must vote on a provisional ballot and also take additional steps after Election Day for it to be counted.